Richland, Washington Submit your own pictures of this city and show them to the world
OSM Map
General Map
Google Map
MSN Map
OSM Map
General Map
Google Map
MSN Map
OSM Map
General Map
Google Map
MSN Map
OSM Map
General Map
Google Map
MSN Map
Please wait while loading the map...
Population in 2022: 62,821 (99% urban, 1% rural). Population change since 2000: +62.3%Males: 32,581 Females: 30,240
March 2022 cost of living index in Richland: 95.3 (near average, U.S. average is 100) Percentage of residents living in poverty in 2022: 7.5%for White Non-Hispanic residents , 12.2% for Black residents , 21.0% for Hispanic or Latino residents , 11.6% for American Indian residents , 20.4% for other race residents , 18.9% for two or more races residents )
Profiles of local businesses
Business Search - 14 Million verified businesses
Data:
Median household income ($)
Median household income (% change since 2000)
Household income diversity
Ratio of average income to average house value (%)
Ratio of average income to average rent
Median household income ($) - White
Median household income ($) - Black or African American
Median household income ($) - Asian
Median household income ($) - Hispanic or Latino
Median household income ($) - American Indian and Alaska Native
Median household income ($) - Multirace
Median household income ($) - Other Race
Median household income for houses/condos with a mortgage ($)
Median household income for apartments without a mortgage ($)
Races - White alone (%)
Races - White alone (% change since 2000)
Races - Black alone (%)
Races - Black alone (% change since 2000)
Races - American Indian alone (%)
Races - American Indian alone (% change since 2000)
Races - Asian alone (%)
Races - Asian alone (% change since 2000)
Races - Hispanic (%)
Races - Hispanic (% change since 2000)
Races - Native Hawaiian and Other Pacific Islander alone (%)
Races - Native Hawaiian and Other Pacific Islander alone (% change since 2000)
Races - Two or more races (%)
Races - Two or more races (% change since 2000)
Races - Other race alone (%)
Races - Other race alone (% change since 2000)
Racial diversity
Unemployment (%)
Unemployment (% change since 2000)
Unemployment (%) - White
Unemployment (%) - Black or African American
Unemployment (%) - Asian
Unemployment (%) - Hispanic or Latino
Unemployment (%) - American Indian and Alaska Native
Unemployment (%) - Multirace
Unemployment (%) - Other Race
Population density (people per square mile)
Population - Males (%)
Population - Females (%)
Population - Males (%) - White
Population - Males (%) - Black or African American
Population - Males (%) - Asian
Population - Males (%) - Hispanic or Latino
Population - Males (%) - American Indian and Alaska Native
Population - Males (%) - Multirace
Population - Males (%) - Other Race
Population - Females (%) - White
Population - Females (%) - Black or African American
Population - Females (%) - Asian
Population - Females (%) - Hispanic or Latino
Population - Females (%) - American Indian and Alaska Native
Population - Females (%) - Multirace
Population - Females (%) - Other Race
Coronavirus confirmed cases (Apr 27, 2024)
Deaths caused by coronavirus (Apr 27, 2024)
Coronavirus confirmed cases (per 100k population) (Apr 27, 2024)
Deaths caused by coronavirus (per 100k population) (Apr 27, 2024)
Daily increase in number of cases (Apr 27, 2024)
Weekly increase in number of cases (Apr 27, 2024)
Cases doubled (in days) (Apr 27, 2024)
Hospitalized patients (Apr 18, 2022)
Negative test results (Apr 18, 2022)
Total test results (Apr 18, 2022)
COVID Vaccine doses distributed (per 100k population) (Sep 19, 2023)
COVID Vaccine doses administered (per 100k population) (Sep 19, 2023)
COVID Vaccine doses distributed (Sep 19, 2023)
COVID Vaccine doses administered (Sep 19, 2023)
Likely homosexual households (%)
Likely homosexual households (% change since 2000)
Likely homosexual households - Lesbian couples (%)
Likely homosexual households - Lesbian couples (% change since 2000)
Likely homosexual households - Gay men (%)
Likely homosexual households - Gay men (% change since 2000)
Cost of living index
Median gross rent ($)
Median contract rent ($)
Median monthly housing costs ($)
Median house or condo value ($)
Median house or condo value ($ change since 2000)
Mean house or condo value by units in structure - 1, detached ($)
Mean house or condo value by units in structure - 1, attached ($)
Mean house or condo value by units in structure - 2 ($)
Mean house or condo value by units in structure by units in structure - 3 or 4 ($)
Mean house or condo value by units in structure - 5 or more ($)
Mean house or condo value by units in structure - Boat, RV, van, etc. ($)
Mean house or condo value by units in structure - Mobile home ($)
Median house or condo value ($) - White
Median house or condo value ($) - Black or African American
Median house or condo value ($) - Asian
Median house or condo value ($) - Hispanic or Latino
Median house or condo value ($) - American Indian and Alaska Native
Median house or condo value ($) - Multirace
Median house or condo value ($) - Other Race
Median resident age
Resident age diversity
Median resident age - Males
Median resident age - Females
Median resident age - White
Median resident age - Black or African American
Median resident age - Asian
Median resident age - Hispanic or Latino
Median resident age - American Indian and Alaska Native
Median resident age - Multirace
Median resident age - Other Race
Median resident age - Males - White
Median resident age - Males - Black or African American
Median resident age - Males - Asian
Median resident age - Males - Hispanic or Latino
Median resident age - Males - American Indian and Alaska Native
Median resident age - Males - Multirace
Median resident age - Males - Other Race
Median resident age - Females - White
Median resident age - Females - Black or African American
Median resident age - Females - Asian
Median resident age - Females - Hispanic or Latino
Median resident age - Females - American Indian and Alaska Native
Median resident age - Females - Multirace
Median resident age - Females - Other Race
Commute - mean travel time to work (minutes)
Travel time to work - Less than 5 minutes (%)
Travel time to work - Less than 5 minutes (% change since 2000)
Travel time to work - 5 to 9 minutes (%)
Travel time to work - 5 to 9 minutes (% change since 2000)
Travel time to work - 10 to 19 minutes (%)
Travel time to work - 10 to 19 minutes (% change since 2000)
Travel time to work - 20 to 29 minutes (%)
Travel time to work - 20 to 29 minutes (% change since 2000)
Travel time to work - 30 to 39 minutes (%)
Travel time to work - 30 to 39 minutes (% change since 2000)
Travel time to work - 40 to 59 minutes (%)
Travel time to work - 40 to 59 minutes (% change since 2000)
Travel time to work - 60 to 89 minutes (%)
Travel time to work - 60 to 89 minutes (% change since 2000)
Travel time to work - 90 or more minutes (%)
Travel time to work - 90 or more minutes (% change since 2000)
Marital status - Never married (%)
Marital status - Now married (%)
Marital status - Separated (%)
Marital status - Widowed (%)
Marital status - Divorced (%)
Median family income ($)
Median family income (% change since 2000)
Median non-family income ($)
Median non-family income (% change since 2000)
Median per capita income ($)
Median per capita income (% change since 2000)
Median family income ($) - White
Median family income ($) - Black or African American
Median family income ($) - Asian
Median family income ($) - Hispanic or Latino
Median family income ($) - American Indian and Alaska Native
Median family income ($) - Multirace
Median family income ($) - Other Race
Median year house/condo built
Median year apartment built
Year house built - Built 2005 or later (%)
Year house built - Built 2000 to 2004 (%)
Year house built - Built 1990 to 1999 (%)
Year house built - Built 1980 to 1989 (%)
Year house built - Built 1970 to 1979 (%)
Year house built - Built 1960 to 1969 (%)
Year house built - Built 1950 to 1959 (%)
Year house built - Built 1940 to 1949 (%)
Year house built - Built 1939 or earlier (%)
Average household size
Household density (households per square mile)
Average household size - White
Average household size - Black or African American
Average household size - Asian
Average household size - Hispanic or Latino
Average household size - American Indian and Alaska Native
Average household size - Multirace
Average household size - Other Race
Occupied housing units (%)
Vacant housing units (%)
Owner occupied housing units (%)
Renter occupied housing units (%)
Vacancy status - For rent (%)
Vacancy status - For sale only (%)
Vacancy status - Rented or sold, not occupied (%)
Vacancy status - For seasonal, recreational, or occasional use (%)
Vacancy status - For migrant workers (%)
Vacancy status - Other vacant (%)
Residents with income below the poverty level (%)
Residents with income below 50% of the poverty level (%)
Children below poverty level (%)
Poor families by family type - Married-couple family (%)
Poor families by family type - Male, no wife present (%)
Poor families by family type - Female, no husband present (%)
Poverty status for native-born residents (%)
Poverty status for foreign-born residents (%)
Poverty among high school graduates not in families (%)
Poverty among people who did not graduate high school not in families (%)
Residents with income below the poverty level (%) - White
Residents with income below the poverty level (%) - Black or African American
Residents with income below the poverty level (%) - Asian
Residents with income below the poverty level (%) - Hispanic or Latino
Residents with income below the poverty level (%) - American Indian and Alaska Native
Residents with income below the poverty level (%) - Multirace
Residents with income below the poverty level (%) - Other Race
Air pollution - Air Quality Index (AQI)
Air pollution - CO
Air pollution - NO2
Air pollution - SO2
Air pollution - Ozone
Air pollution - PM10
Air pollution - PM25
Air pollution - Pb
Crime - Murders per 100,000 population
Crime - Rapes per 100,000 population
Crime - Robberies per 100,000 population
Crime - Assaults per 100,000 population
Crime - Burglaries per 100,000 population
Crime - Thefts per 100,000 population
Crime - Auto thefts per 100,000 population
Crime - Arson per 100,000 population
Crime - City-data.com crime index
Crime - Violent crime index
Crime - Property crime index
Crime - Murders per 100,000 population (5 year average)
Crime - Rapes per 100,000 population (5 year average)
Crime - Robberies per 100,000 population (5 year average)
Crime - Assaults per 100,000 population (5 year average)
Crime - Burglaries per 100,000 population (5 year average)
Crime - Thefts per 100,000 population (5 year average)
Crime - Auto thefts per 100,000 population (5 year average)
Crime - Arson per 100,000 population (5 year average)
Crime - City-data.com crime index (5 year average)
Crime - Violent crime index (5 year average)
Crime - Property crime index (5 year average)
1996 Presidential Elections Results (%) - Democratic Party (Clinton)
1996 Presidential Elections Results (%) - Republican Party (Dole)
1996 Presidential Elections Results (%) - Other
2000 Presidential Elections Results (%) - Democratic Party (Gore)
2000 Presidential Elections Results (%) - Republican Party (Bush)
2000 Presidential Elections Results (%) - Other
2004 Presidential Elections Results (%) - Democratic Party (Kerry)
2004 Presidential Elections Results (%) - Republican Party (Bush)
2004 Presidential Elections Results (%) - Other
2008 Presidential Elections Results (%) - Democratic Party (Obama)
2008 Presidential Elections Results (%) - Republican Party (McCain)
2008 Presidential Elections Results (%) - Other
2012 Presidential Elections Results (%) - Democratic Party (Obama)
2012 Presidential Elections Results (%) - Republican Party (Romney)
2012 Presidential Elections Results (%) - Other
2016 Presidential Elections Results (%) - Democratic Party (Clinton)
2016 Presidential Elections Results (%) - Republican Party (Trump)
2016 Presidential Elections Results (%) - Other
2020 Presidential Elections Results (%) - Democratic Party (Biden)
2020 Presidential Elections Results (%) - Republican Party (Trump)
2020 Presidential Elections Results (%) - Other
Ancestries Reported - Arab (%)
Ancestries Reported - Czech (%)
Ancestries Reported - Danish (%)
Ancestries Reported - Dutch (%)
Ancestries Reported - English (%)
Ancestries Reported - French (%)
Ancestries Reported - French Canadian (%)
Ancestries Reported - German (%)
Ancestries Reported - Greek (%)
Ancestries Reported - Hungarian (%)
Ancestries Reported - Irish (%)
Ancestries Reported - Italian (%)
Ancestries Reported - Lithuanian (%)
Ancestries Reported - Norwegian (%)
Ancestries Reported - Polish (%)
Ancestries Reported - Portuguese (%)
Ancestries Reported - Russian (%)
Ancestries Reported - Scotch-Irish (%)
Ancestries Reported - Scottish (%)
Ancestries Reported - Slovak (%)
Ancestries Reported - Subsaharan African (%)
Ancestries Reported - Swedish (%)
Ancestries Reported - Swiss (%)
Ancestries Reported - Ukrainian (%)
Ancestries Reported - United States (%)
Ancestries Reported - Welsh (%)
Ancestries Reported - West Indian (%)
Ancestries Reported - Other (%)
Educational Attainment - No schooling completed (%)
Educational Attainment - Less than high school (%)
Educational Attainment - High school or equivalent (%)
Educational Attainment - Less than 1 year of college (%)
Educational Attainment - 1 or more years of college (%)
Educational Attainment - Associate degree (%)
Educational Attainment - Bachelor's degree (%)
Educational Attainment - Master's degree (%)
Educational Attainment - Professional school degree (%)
Educational Attainment - Doctorate degree (%)
School Enrollment - Nursery, preschool (%)
School Enrollment - Kindergarten (%)
School Enrollment - Grade 1 to 4 (%)
School Enrollment - Grade 5 to 8 (%)
School Enrollment - Grade 9 to 12 (%)
School Enrollment - College undergrad (%)
School Enrollment - Graduate or professional (%)
School Enrollment - Not enrolled in school (%)
School enrollment - Public schools (%)
School enrollment - Private schools (%)
School enrollment - Not enrolled (%)
Median number of rooms in houses and condos
Median number of rooms in apartments
Housing units lacking complete plumbing facilities (%)
Housing units lacking complete kitchen facilities (%)
Density of houses
Urban houses (%)
Rural houses (%)
Households with people 60 years and over (%)
Households with people 65 years and over (%)
Households with people 75 years and over (%)
Households with one or more nonrelatives (%)
Households with no nonrelatives (%)
Population in households (%)
Family households (%)
Nonfamily households (%)
Population in families (%)
Family households with own children (%)
Median number of bedrooms in owner occupied houses
Mean number of bedrooms in owner occupied houses
Median number of bedrooms in renter occupied houses
Mean number of bedrooms in renter occupied houses
Median number of vehichles in owner occupied houses
Mean number of vehichles in owner occupied houses
Median number of vehichles in renter occupied houses
Mean number of vehichles in renter occupied houses
Mortgage status - with mortgage (%)
Mortgage status - with second mortgage (%)
Mortgage status - with home equity loan (%)
Mortgage status - with both second mortgage and home equity loan (%)
Mortgage status - without a mortgage (%)
Average family size
Average family size - White
Average family size - Black or African American
Average family size - Asian
Average family size - Hispanic or Latino
Average family size - American Indian and Alaska Native
Average family size - Multirace
Average family size - Other Race
Geographical mobility - Same house 1 year ago (%)
Geographical mobility - Moved within same county (%)
Geographical mobility - Moved from different county within same state (%)
Geographical mobility - Moved from different state (%)
Geographical mobility - Moved from abroad (%)
Place of birth - Born in state of residence (%)
Place of birth - Born in other state (%)
Place of birth - Native, outside of US (%)
Place of birth - Foreign born (%)
Housing units in structures - 1, detached (%)
Housing units in structures - 1, attached (%)
Housing units in structures - 2 (%)
Housing units in structures - 3 or 4 (%)
Housing units in structures - 5 to 9 (%)
Housing units in structures - 10 to 19 (%)
Housing units in structures - 20 to 49 (%)
Housing units in structures - 50 or more (%)
Housing units in structures - Mobile home (%)
Housing units in structures - Boat, RV, van, etc. (%)
House/condo owner moved in on average (years ago)
Renter moved in on average (years ago)
Year householder moved into unit - Moved in 1999 to March 2000 (%)
Year householder moved into unit - Moved in 1995 to 1998 (%)
Year householder moved into unit - Moved in 1990 to 1994 (%)
Year householder moved into unit - Moved in 1980 to 1989 (%)
Year householder moved into unit - Moved in 1970 to 1979 (%)
Year householder moved into unit - Moved in 1969 or earlier (%)
Means of transportation to work - Drove car alone (%)
Means of transportation to work - Carpooled (%)
Means of transportation to work - Public transportation (%)
Means of transportation to work - Bus or trolley bus (%)
Means of transportation to work - Streetcar or trolley car (%)
Means of transportation to work - Subway or elevated (%)
Means of transportation to work - Railroad (%)
Means of transportation to work - Ferryboat (%)
Means of transportation to work - Taxicab (%)
Means of transportation to work - Motorcycle (%)
Means of transportation to work - Bicycle (%)
Means of transportation to work - Walked (%)
Means of transportation to work - Other means (%)
Working at home (%)
Industry diversity
Most Common Industries - Agriculture, forestry, fishing and hunting, and mining (%)
Most Common Industries - Agriculture, forestry, fishing and hunting (%)
Most Common Industries - Mining, quarrying, and oil and gas extraction (%)
Most Common Industries - Construction (%)
Most Common Industries - Manufacturing (%)
Most Common Industries - Wholesale trade (%)
Most Common Industries - Retail trade (%)
Most Common Industries - Transportation and warehousing, and utilities (%)
Most Common Industries - Transportation and warehousing (%)
Most Common Industries - Utilities (%)
Most Common Industries - Information (%)
Most Common Industries - Finance and insurance, and real estate and rental and leasing (%)
Most Common Industries - Finance and insurance (%)
Most Common Industries - Real estate and rental and leasing (%)
Most Common Industries - Professional, scientific, and management, and administrative and waste management services (%)
Most Common Industries - Professional, scientific, and technical services (%)
Most Common Industries - Management of companies and enterprises (%)
Most Common Industries - Administrative and support and waste management services (%)
Most Common Industries - Educational services, and health care and social assistance (%)
Most Common Industries - Educational services (%)
Most Common Industries - Health care and social assistance (%)
Most Common Industries - Arts, entertainment, and recreation, and accommodation and food services (%)
Most Common Industries - Arts, entertainment, and recreation (%)
Most Common Industries - Accommodation and food services (%)
Most Common Industries - Other services, except public administration (%)
Most Common Industries - Public administration (%)
Occupation diversity
Most Common Occupations - Management, business, science, and arts occupations (%)
Most Common Occupations - Management, business, and financial occupations (%)
Most Common Occupations - Management occupations (%)
Most Common Occupations - Business and financial operations occupations (%)
Most Common Occupations - Computer, engineering, and science occupations (%)
Most Common Occupations - Computer and mathematical occupations (%)
Most Common Occupations - Architecture and engineering occupations (%)
Most Common Occupations - Life, physical, and social science occupations (%)
Most Common Occupations - Education, legal, community service, arts, and media occupations (%)
Most Common Occupations - Community and social service occupations (%)
Most Common Occupations - Legal occupations (%)
Most Common Occupations - Education, training, and library occupations (%)
Most Common Occupations - Arts, design, entertainment, sports, and media occupations (%)
Most Common Occupations - Healthcare practitioners and technical occupations (%)
Most Common Occupations - Health diagnosing and treating practitioners and other technical occupations (%)
Most Common Occupations - Health technologists and technicians (%)
Most Common Occupations - Service occupations (%)
Most Common Occupations - Healthcare support occupations (%)
Most Common Occupations - Protective service occupations (%)
Most Common Occupations - Fire fighting and prevention, and other protective service workers including supervisors (%)
Most Common Occupations - Law enforcement workers including supervisors (%)
Most Common Occupations - Food preparation and serving related occupations (%)
Most Common Occupations - Building and grounds cleaning and maintenance occupations (%)
Most Common Occupations - Personal care and service occupations (%)
Most Common Occupations - Sales and office occupations (%)
Most Common Occupations - Sales and related occupations (%)
Most Common Occupations - Office and administrative support occupations (%)
Most Common Occupations - Natural resources, construction, and maintenance occupations (%)
Most Common Occupations - Farming, fishing, and forestry occupations (%)
Most Common Occupations - Construction and extraction occupations (%)
Most Common Occupations - Installation, maintenance, and repair occupations (%)
Most Common Occupations - Production, transportation, and material moving occupations (%)
Most Common Occupations - Production occupations (%)
Most Common Occupations - Transportation occupations (%)
Most Common Occupations - Material moving occupations (%)
People in Group quarters - Institutionalized population (%)
People in Group quarters - Correctional institutions (%)
People in Group quarters - Federal prisons and detention centers (%)
People in Group quarters - Halfway houses (%)
People in Group quarters - Local jails and other confinement facilities (including police lockups) (%)
People in Group quarters - Military disciplinary barracks (%)
People in Group quarters - State prisons (%)
People in Group quarters - Other types of correctional institutions (%)
People in Group quarters - Nursing homes (%)
People in Group quarters - Hospitals/wards, hospices, and schools for the handicapped (%)
People in Group quarters - Hospitals/wards and hospices for chronically ill (%)
People in Group quarters - Hospices or homes for chronically ill (%)
People in Group quarters - Military hospitals or wards for chronically ill (%)
People in Group quarters - Other hospitals or wards for chronically ill (%)
People in Group quarters - Hospitals or wards for drug/alcohol abuse (%)
People in Group quarters - Mental (Psychiatric) hospitals or wards (%)
People in Group quarters - Schools, hospitals, or wards for the mentally retarded (%)
People in Group quarters - Schools, hospitals, or wards for the physically handicapped (%)
People in Group quarters - Institutions for the deaf (%)
People in Group quarters - Institutions for the blind (%)
People in Group quarters - Orthopedic wards and institutions for the physically handicapped (%)
People in Group quarters - Wards in general hospitals for patients who have no usual home elsewhere (%)
People in Group quarters - Wards in military hospitals for patients who have no usual home elsewhere (%)
People in Group quarters - Juvenile institutions (%)
People in Group quarters - Long-term care (%)
People in Group quarters - Homes for abused, dependent, and neglected children (%)
People in Group quarters - Residential treatment centers for emotionally disturbed children (%)
People in Group quarters - Training schools for juvenile delinquents (%)
People in Group quarters - Short-term care, detention or diagnostic centers for delinquent children (%)
People in Group quarters - Type of juvenile institution unknown (%)
People in Group quarters - Noninstitutionalized population (%)
People in Group quarters - College dormitories (includes college quarters off campus) (%)
People in Group quarters - Military quarters (%)
People in Group quarters - On base (%)
People in Group quarters - Barracks, unaccompanied personnel housing (UPH), (Enlisted/Officer), ;and similar group living quarters for military personnel (%)
People in Group quarters - Transient quarters for temporary residents (%)
People in Group quarters - Military ships (%)
People in Group quarters - Group homes (%)
People in Group quarters - Homes or halfway houses for drug/alcohol abuse (%)
People in Group quarters - Homes for the mentally ill (%)
People in Group quarters - Homes for the mentally retarded (%)
People in Group quarters - Homes for the physically handicapped (%)
People in Group quarters - Other group homes (%)
People in Group quarters - Religious group quarters (%)
People in Group quarters - Dormitories (%)
People in Group quarters - Agriculture workers' dormitories on farms (%)
People in Group quarters - Job Corps and vocational training facilities (%)
People in Group quarters - Other workers' dormitories (%)
People in Group quarters - Crews of maritime vessels (%)
People in Group quarters - Other nonhousehold living situations (%)
People in Group quarters - Other noninstitutional group quarters (%)
Residents speaking English at home (%)
Residents speaking English at home - Born in the United States (%)
Residents speaking English at home - Native, born elsewhere (%)
Residents speaking English at home - Foreign born (%)
Residents speaking Spanish at home (%)
Residents speaking Spanish at home - Born in the United States (%)
Residents speaking Spanish at home - Native, born elsewhere (%)
Residents speaking Spanish at home - Foreign born (%)
Residents speaking other language at home (%)
Residents speaking other language at home - Born in the United States (%)
Residents speaking other language at home - Native, born elsewhere (%)
Residents speaking other language at home - Foreign born (%)
Class of Workers - Employee of private company (%)
Class of Workers - Self-employed in own incorporated business (%)
Class of Workers - Private not-for-profit wage and salary workers (%)
Class of Workers - Local government workers (%)
Class of Workers - State government workers (%)
Class of Workers - Federal government workers (%)
Class of Workers - Self-employed workers in own not incorporated business and Unpaid family workers (%)
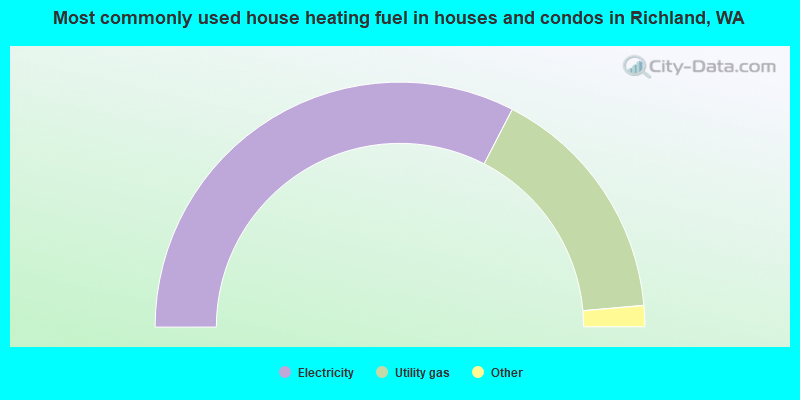
House heating fuel used in houses and condos - Utility gas (%)
House heating fuel used in houses and condos - Bottled, tank, or LP gas (%)
House heating fuel used in houses and condos - Electricity (%)
House heating fuel used in houses and condos - Fuel oil, kerosene, etc. (%)
House heating fuel used in houses and condos - Coal or coke (%)
House heating fuel used in houses and condos - Wood (%)
House heating fuel used in houses and condos - Solar energy (%)
House heating fuel used in houses and condos - Other fuel (%)
House heating fuel used in houses and condos - No fuel used (%)
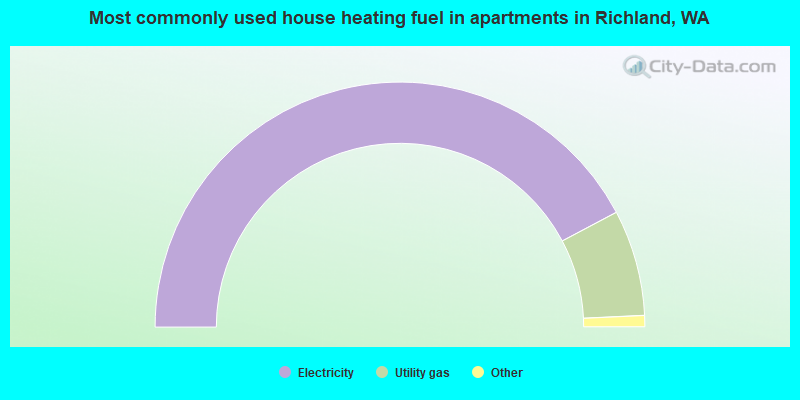
House heating fuel used in apartments - Utility gas (%)
House heating fuel used in apartments - Bottled, tank, or LP gas (%)
House heating fuel used in apartments - Electricity (%)
House heating fuel used in apartments - Fuel oil, kerosene, etc. (%)
House heating fuel used in apartments - Coal or coke (%)
House heating fuel used in apartments - Wood (%)
House heating fuel used in apartments - Solar energy (%)
House heating fuel used in apartments - Other fuel (%)
House heating fuel used in apartments - No fuel used (%)
Armed forces status - In Armed Forces (%)
Armed forces status - Civilian (%)
Armed forces status - Civilian - Veteran (%)
Armed forces status - Civilian - Nonveteran (%)
Fatal accidents locations in years 2005-2021
Fatal accidents locations in 2005
Fatal accidents locations in 2006
Fatal accidents locations in 2007
Fatal accidents locations in 2008
Fatal accidents locations in 2009
Fatal accidents locations in 2010
Fatal accidents locations in 2011
Fatal accidents locations in 2012
Fatal accidents locations in 2013
Fatal accidents locations in 2014
Fatal accidents locations in 2015
Fatal accidents locations in 2016
Fatal accidents locations in 2017
Fatal accidents locations in 2018
Fatal accidents locations in 2019
Fatal accidents locations in 2020
Fatal accidents locations in 2021
Alcohol use - People drinking some alcohol every month (%)
Alcohol use - People not drinking at all (%)
Alcohol use - Average days/month drinking alcohol
Alcohol use - Average drinks/week
Alcohol use - Average days/year people drink much
Audiometry - Average condition of hearing (%)
Audiometry - People that can hear a whisper from across a quiet room (%)
Audiometry - People that can hear normal voice from across a quiet room (%)
Audiometry - Ears ringing, roaring, buzzing (%)
Audiometry - Had a job exposure to loud noise (%)
Audiometry - Had off-work exposure to loud noise (%)
Blood Pressure & Cholesterol - Has high blood pressure (%)
Blood Pressure & Cholesterol - Checking blood pressure at home (%)
Blood Pressure & Cholesterol - Frequently checking blood cholesterol (%)
Blood Pressure & Cholesterol - Has high cholesterol level (%)
Consumer Behavior - Money monthly spent on food at supermarket/grocery store
Consumer Behavior - Money monthly spent on food at other stores
Consumer Behavior - Money monthly spent on eating out
Consumer Behavior - Money monthly spent on carryout/delivered foods
Consumer Behavior - Income spent on food at supermarket/grocery store (%)
Consumer Behavior - Income spent on food at other stores (%)
Consumer Behavior - Income spent on eating out (%)
Consumer Behavior - Income spent on carryout/delivered foods (%)
Current Health Status - General health condition (%)
Current Health Status - Blood donors (%)
Current Health Status - Has blood ever tested for HIV virus (%)
Current Health Status - Left-handed people (%)
Dermatology - People using sunscreen (%)
Diabetes - Diabetics (%)
Diabetes - Had a blood test for high blood sugar (%)
Diabetes - People taking insulin (%)
Diet Behavior & Nutrition - Diet health (%)
Diet Behavior & Nutrition - Milk product consumption (# of products/month)
Diet Behavior & Nutrition - Meals not home prepared (#/week)
Diet Behavior & Nutrition - Meals from fast food or pizza place (#/week)
Diet Behavior & Nutrition - Ready-to-eat foods (#/month)
Diet Behavior & Nutrition - Frozen meals/pizza (#/month)
Drug Use - People that ever used marijuana or hashish (%)
Drug Use - Ever used hard drugs (%)
Drug Use - Ever used any form of cocaine (%)
Drug Use - Ever used heroin (%)
Drug Use - Ever used methamphetamine (%)
Health Insurance - People covered by health insurance (%)
Kidney Conditions-Urology - Avg. # of times urinating at night
Medical Conditions - People with asthma (%)
Medical Conditions - People with anemia (%)
Medical Conditions - People with psoriasis (%)
Medical Conditions - People with overweight (%)
Medical Conditions - Elderly people having difficulties in thinking or remembering (%)
Medical Conditions - People who ever received blood transfusion (%)
Medical Conditions - People having trouble seeing even with glass/contacts (%)
Medical Conditions - People with arthritis (%)
Medical Conditions - People with gout (%)
Medical Conditions - People with congestive heart failure (%)
Medical Conditions - People with coronary heart disease (%)
Medical Conditions - People with angina pectoris (%)
Medical Conditions - People who ever had heart attack (%)
Medical Conditions - People who ever had stroke (%)
Medical Conditions - People with emphysema (%)
Medical Conditions - People with thyroid problem (%)
Medical Conditions - People with chronic bronchitis (%)
Medical Conditions - People with any liver condition (%)
Medical Conditions - People who ever had cancer or malignancy (%)
Mental Health - People who have little interest in doing things (%)
Mental Health - People feeling down, depressed, or hopeless (%)
Mental Health - People who have trouble sleeping or sleeping too much (%)
Mental Health - People feeling tired or having little energy (%)
Mental Health - People with poor appetite or overeating (%)
Mental Health - People feeling bad about themself (%)
Mental Health - People who have trouble concentrating on things (%)
Mental Health - People moving or speaking slowly or too fast (%)
Mental Health - People having thoughts they would be better off dead (%)
Oral Health - Average years since last visit a dentist
Oral Health - People embarrassed because of mouth (%)
Oral Health - People with gum disease (%)
Oral Health - General health of teeth and gums (%)
Oral Health - Average days a week using dental floss/device
Oral Health - Average days a week using mouthwash for dental problem
Oral Health - Average number of teeth
Pesticide Use - Households using pesticides to control insects (%)
Pesticide Use - Households using pesticides to kill weeds (%)
Physical Activity - People doing vigorous-intensity work activities (%)
Physical Activity - People doing moderate-intensity work activities (%)
Physical Activity - People walking or bicycling (%)
Physical Activity - People doing vigorous-intensity recreational activities (%)
Physical Activity - People doing moderate-intensity recreational activities (%)
Physical Activity - Average hours a day doing sedentary activities
Physical Activity - Average hours a day watching TV or videos
Physical Activity - Average hours a day using computer
Physical Functioning - People having limitations keeping them from working (%)
Physical Functioning - People limited in amount of work they can do (%)
Physical Functioning - People that need special equipment to walk (%)
Physical Functioning - People experiencing confusion/memory problems (%)
Physical Functioning - People requiring special healthcare equipment (%)
Prescription Medications - Average number of prescription medicines taking
Preventive Aspirin Use - Adults 40+ taking low-dose aspirin (%)
Reproductive Health - Vaginal deliveries (%)
Reproductive Health - Cesarean deliveries (%)
Reproductive Health - Deliveries resulted in a live birth (%)
Reproductive Health - Pregnancies resulted in a delivery (%)
Reproductive Health - Women breastfeeding newborns (%)
Reproductive Health - Women that had a hysterectomy (%)
Reproductive Health - Women that had both ovaries removed (%)
Reproductive Health - Women that have ever taken birth control pills (%)
Reproductive Health - Women taking birth control pills (%)
Reproductive Health - Women that have ever used Depo-Provera or injectables (%)
Reproductive Health - Women that have ever used female hormones (%)
Sexual Behavior - People 18+ that ever had sex (vaginal, anal, or oral) (%)
Sexual Behavior - Males 18+ that ever had vaginal sex with a woman (%)
Sexual Behavior - Males 18+ that ever performed oral sex on a woman (%)
Sexual Behavior - Males 18+ that ever had anal sex with a woman (%)
Sexual Behavior - Males 18+ that ever had any sex with a man (%)
Sexual Behavior - Females 18+ that ever had vaginal sex with a man (%)
Sexual Behavior - Females 18+ that ever performed oral sex on a man (%)
Sexual Behavior - Females 18+ that ever had anal sex with a man (%)
Sexual Behavior - Females 18+ that ever had any kind of sex with a woman (%)
Sexual Behavior - Average age people first had sex
Sexual Behavior - Average number of female sex partners in lifetime (males 18+)
Sexual Behavior - Average number of female vaginal sex partners in lifetime (males 18+)
Sexual Behavior - Average age people first performed oral sex on a woman (18+)
Sexual Behavior - Average number of woman performed oral sex on in lifetime (18+)
Sexual Behavior - Average number of male sex partners in lifetime (males 18+)
Sexual Behavior - Average number of male anal sex partners in lifetime (males 18+)
Sexual Behavior - Average age people first performed oral sex on a man (18+)
Sexual Behavior - Average number of male oral sex partners in lifetime (18+)
Sexual Behavior - People using protection when performing oral sex (%)
Sexual Behavior - Average number of times people have vaginal or anal sex a year
Sexual Behavior - People having sex without condom (%)
Sexual Behavior - Average number of male sex partners in lifetime (females 18+)
Sexual Behavior - Average number of male vaginal sex partners in lifetime (females 18+)
Sexual Behavior - Average number of female sex partners in lifetime (females 18+)
Sexual Behavior - Circumcised males 18+ (%)
Sleep Disorders - Average hours sleeping at night
Sleep Disorders - People that has trouble sleeping (%)
Smoking-Cigarette Use - People smoking cigarettes (%)
Taste & Smell - People 40+ having problems with smell (%)
Taste & Smell - People 40+ having problems with taste (%)
Taste & Smell - People 40+ that ever had wisdom teeth removed (%)
Taste & Smell - People 40+ that ever had tonsils teeth removed (%)
Taste & Smell - People 40+ that ever had a loss of consciousness because of a head injury (%)
Taste & Smell - People 40+ that ever had a broken nose or other serious injury to face or skull (%)
Taste & Smell - People 40+ that ever had two or more sinus infections (%)
Weight - Average height (inches)
Weight - Average weight (pounds)
Weight - Average BMI
Weight - People that are obese (%)
Weight - People that ever were obese (%)
Weight - People trying to lose weight (%)
According to our research of Washington and other state lists, there were 17 registered sex offenders living in Richland, Washington as of April 27, 2024 . The ratio of all residents to sex offenders in Richland is 3,234 to 1.The ratio of registered sex offenders to all residents in this city is much lower than the state average.
The City-Data.com crime index weighs serious crimes and violent crimes more heavily. Higher means more crime, U.S. average is 246.1. It adjusts for the number of visitors and daily workers commuting into cities.
- means the value is smaller than the state average.
- means the value is about the same as the state average.
- means the value is bigger than the state average.
- means the value is much bigger than the state average.
Crime rate in Richland detailed stats: murders, rapes, robberies, assaults, burglaries, thefts, arson Officers per 1,000 residents here:
0.94Washington average:
1.35
Latest news from Richland, WA collected exclusively by city-data.com from local newspapers, TV, and radio stations
Ancestries: German (11.5%), English (10.6%), European (7.1%), Irish (5.7%), American (5.6%), Italian (2.5%).
Current Local Time:
Land area: 34.8 square miles.
Population density: 1,804 people per square mile (low).
5,609 residents are foreign born (4.4% Asia , 1.9% Europe , 1.6% Latin America ).
This city:
9.0%Washington:
14.9%
Median real estate property taxes paid for housing units with mortgages in 2022: $3,373 (0.8%)Median real estate property taxes paid for housing units with no mortgage in 2022: $3,270 (0.8%)
Nearest city with pop. 50,000+: Kennewick, WA
Nearest city with pop. 200,000+: East Seattle, WA (164.6 miles
Nearest city with pop. 1,000,000+: Los Angeles, CA
Nearest cities:
Latitude: 46.28 N, Longitude: 119.28 W
Daytime population change due to commuting: +11,271 (+18.1%)Workers who live and work in this city: 17,767 (58.3%)
Single-family new house construction building permits:
2022: 270 buildings , average cost: $410,8002021: 406 buildings , average cost: $346,6002020: 386 buildings , average cost: $320,1002019: 370 buildings , average cost: $305,7002018: 323 buildings , average cost: $313,3002017: 271 buildings , average cost: $299,9002016: 271 buildings , average cost: $324,7002015: 235 buildings , average cost: $326,2002014: 231 buildings , average cost: $327,6002013: 250 buildings , average cost: $305,7002012: 256 buildings , average cost: $280,1002011: 265 buildings , average cost: $284,1002010: 344 buildings , average cost: $255,6002009: 219 buildings , average cost: $244,9002008: 227 buildings , average cost: $276,7002007: 296 buildings , average cost: $275,9002006: 318 buildings , average cost: $256,4002005: 340 buildings , average cost: $247,8002004: 296 buildings , average cost: $221,6002003: 321 buildings , average cost: $219,0002002: 378 buildings , average cost: $46,9002001: 383 buildings , average cost: $19,9002000: 231 buildings , average cost: $202,1001999: 195 buildings , average cost: $196,2001998: 130 buildings , average cost: $195,1001997: 100 buildings , average cost: $199,500Unemployment in December 2023:
Population change in the 1990s: +5,496 (+16.5%).
Most common occupations in Richland, WA (%)
Both Males Females
Other management occupations, except farmers and farm managers (7.1%)
Engineers (6.3%)
Life and physical scientists (4.2%)
Secretaries and administrative assistants (3.8%)
Other sales and related occupations, including supervisors (3.4%)
Preschool, kindergarten, elementary, and middle school teachers (3.3%)
Computer specialists (2.8%)
Engineers (10.7%)
Other management occupations, except farmers and farm managers (9.2%)
Life and physical scientists (5.5%)
Computer specialists (3.8%)
Electrical equipment mechanics and other installation, maintenance, and repair workers, including supervisors (3.5%)
Other production occupations, including supervisors (3.2%)
Building and grounds cleaning and maintenance occupations (3.0%)
Secretaries and administrative assistants (8.2%)
Preschool, kindergarten, elementary, and middle school teachers (5.5%)
Registered nurses (4.6%)
Other management occupations, except farmers and farm managers (4.5%)
Other office and administrative support workers, including supervisors (4.4%)
Other sales and related occupations, including supervisors (3.9%)
Information and record clerks, except customer service representatives (3.9%)
Earthquake activity:
Richland-area historical earthquake activity is significantly above Washington state average. It is 1316% greater than the overall U.S. average. On 4/13/1949 at 19:55:42, a magnitude 7.0 (7.0 UK, Class: Major, Intensity: VIII - XII) earthquake occurred 166.6 miles away from Richland center, causing $80,000,000 total damage On 2/28/2001 at 18:54:32, a magnitude 6.8 (6.5 MB, 6.6 MS, 6.8 MW, Class: Strong, Intensity: VII - IX) earthquake occurred 166.2 miles away from Richland center, causing $2,000,000,000 total damage and $305,000,000 insured lossesOn 2/28/2001 at 18:54:32, a magnitude 6.8 (6.8 MD, Depth: 32.2 mi) earthquake occurred 174.1 miles away from the city center On 10/28/1983 at 14:06:06, a magnitude 7.3 (6.2 MB, 7.3 MS, 7.0 MW) earthquake occurred 307.4 miles away from the city center, causing 2 deaths ( 2 shaking deaths) and 3 injuries, causing $15,000,000 total damage On 4/29/1965 at 15:28:43, a magnitude 6.6 (6.6 UK) earthquake occurred 161.3 miles away from the city center, causing $28,000,000 total damage On 10/3/1915 at 06:52:48, a magnitude 7.6 (7.6 UK) earthquake occurred 409.6 miles away from Richland center Magnitude types: body-wave magnitude (MB), duration magnitude (MD), surface-wave magnitude (MS), moment magnitude (MW) Natural disasters: The number of natural disasters in Benton County (16) is near the US average (15).Major Disasters (Presidential) Declared: 11Emergencies Declared: 2Floods: 9, Storms: 5, Mudslides: 3, Winter Storms: 3, Fires: 2, Landslides: 2, Drought: 1, Earthquake: 1, Heavy Rain: 1, Hurricane: 1, Snow: 1, Volcanic Eruption: 1, Other: 1 (Note: some incidents may be assigned to more than one category). Hospitals and medical centers in Richland: KADLEC REGIONAL MEDICAL CENTER (Voluntary non-profit - Private, provides emergency services, 888 SWIFT BLVD) LOURDES COUNSELING CENTER (1175 CARONDELET DRIVE) LIFE CARE CENTER OF RICHLAND (44 GOETHALS DRIVE)
RICHLAND REHABILITATION CENTER (1745 PIKE AVENUE)
CHINOOK KIDNEY CENTER (1315 AARON DR)
Amtrak station: RICHLAND (DENNY'S REST., G. WASH. WAY AT WILLIAMS) - Bus Station
.
Services: public restrooms, public payphones, full-service food facilities.
Nuclear power plants:
WNP 1. The Babcock & Wilcox Co.United Engineers & Constructors. The Babcock & Wilcox Co.Washington Public Power Supply System. Pressurized Water Reactor (PWR). Net Output: 1259 MWe. Cancelled..
WNP 2. Westinghouse Electric Corp.Burns & Roe, Inc.General Electric Co.Washington Public Power Supply System. Boiling Water Reactor (BWR). Net Output: 1112 MWe. Operable. Initial criticality: 01/1984. Commercial start: 12/1984..
Hanford-N . Light-Water-Cooled, Graphite-Moderated Reactor (LGR). Net Output: 860 MWe. Permanently shutdown. Date started: 07/1966. Date closed : 02/1988..
Colleges/Universities in Richland: Lucas Marc Academy Full-time enrollment: 218; Location: 71 Gage Blvd.; Private, for-profit; Website: lucasmarcacademy.com)
Academy of Cosmetology Full-time enrollment: 20; Location: 1368 Jadwin Ave; Private, for-profit; Website: www.academyofcosmetologyonline.com)
Colleges/universities with over 2000 students nearest to Richland:
Columbia Basin College (about 9 miles; Pasco, WA ; Full-time enrollment: 5,111)
Walla Walla Community College (about 50 miles; Walla Walla, WA ; FT enrollment: 4,263)
Yakima Valley Community College (about 64 miles; Yakima, WA ; FT enrollment: 3,632)
Central Washington University (about 78 miles; Ellensburg, WA ; FT enrollment: 10,960)
Eastern Oregon University (about 88 miles; La Grande, OR ; FT enrollment: 3,127)
Wenatchee Valley College (about 94 miles; Wenatchee, WA ; FT enrollment: 2,951)
Washington State University (about 106 miles; Pullman, WA ; FT enrollment: 25,055)
Public high schools in Richland:
Private high school in Richland: LIBERTY CHRISTIAN SCHOOL Students: 415, Location: 2200 WILLIAMS BLVD, Grades: PK-12)
Public elementary/middle schools in Richland:
Private elementary/middle school in Richland: SAGEBRUSH MONTESSORI SCHOOL Students: 61, Location: 304 THAYER DR, Grades: PK-T1)
See full list of schools located in Richland Library in Richland: RICHLAND PUBLIC LIBRARY Operating income: $1,826,417; Location: 1270 LEE BLVD; 147,098 books ; 571 e-books ; 8,013 audio materials ; 10,643 video materials ; 15 local licensed databases ; 11 state licensed databases ; 359 print serial subscriptions ; 1 electronic serial subscriptions )
User-submitted facts and corrections:
"Sham-na-pum Golf Course" was renovated and renamed "Columbia Point Golf Course" in the late 1990s.
Zip codes now also include 99353 and 99354, in addition to the already stated 99352.
Museum: Columbia River Exhbition of History, Science and Technology; location: 95 Lee Blvd.; hours of operation: Mon-Sat 10AM-5PM, Sun Noon-5PM, Closed New Years, Easter, Thanksgiving Day, and Christmas Day.
Notable locations in Richland: (A) , Buckskin Golf Club (B) , Columbia Point Golf Course (C) , Horn Rapids Desert Style Golf Course (D) , Richland Fire Dept Station 73 (E) , Richland Fire Dept Station 72 (F) , Richland Fire and Emergency Services Station 71 (G) . Display/hide their locations on the map
Shopping Center: (1) . Display/hide its location on the map
Church in Richland: (A) . Display/hide its location on the map
Cemeteries: (1) , Sunset Memorial Gardens (2) . Display/hide their locations on the map
Reservoir: (A) . Display/hide its location on the map
River: (A) . Display/hide its location on the map
Parks in Richland include: (1) , Leslie Groves Park (2) , Paul Liddell Park (3) , Columbia Point Marina Park (4) , Howard Amon Park (5) , James J Lawless Park (6) , Chamna Natural Preserve (7) , Riverview Natural Preserve (8) , Jefferson Park (9) . Display/hide their locations on the map
Tourist attractions: (1) , Allied Arts Association (Art Museums; 89 Lee Blvd) (2) , Atomic Bowl (Amusement & Theme Parks; 624 Wellsian Way) (3) , Jokers Sport Lounge & Casino (Amusement & Theme Parks; 624 Wellsian Way) (4) , Rambling Rovers Senior Travel Association (660 George Washington Wa) (5) . Display/hide their approximate locations on the map
Hotels: (1) , Haney's Inn (2153 Stevens Drive) (2) , Holiday Inn Express and Suites (1970 Center Parkway) (3) , Bali-Hi Motel (1201 George Washington Wa) (4) , Hampton Inn Richland-Tri Cities (486 Bradley Boulevard) (5) , Days Inn Richmond WA (615 Jadwin) (6) , Clarion Hotel (1515 George Washington Wy) (7) , Desert Gold Motel & RV Park (611 Columbia Park Trail) (8) , Red Lion Richland (802 George Washington) (9) . Display/hide their approximate locations on the map
Courts: (1) , United States Government - United States District Court- Federal Bldg (8300 Gage Boulevard Kennewick) (2) . Display/hide their approximate locations on the map
Birthplace of: Hope Solo - Soccer goalkeeper, Orson Scott Card - (born 1951), author, novelist, Jay Clough - Washington State politician, Leilani Mitchell - Basketball player, Mitch Canham - Baseball player, Randy Fullmer - Animator, Travis Buck - Baseball player, Ty Jones - NHL player (Florida Panthers, born : Feb 22, 1979), Tyler Brayton - 2005 NFL player (Oakland Raiders, born : Nov 20, 1979), Rob Rashell - PGA Tour Golf player (born : 12/30/75).
Benton County has a predicted average indoor radon screening level between 2 and 4 pCi/L (pico curies per liter) - Moderate Potential Drinking water stations with addresses in Richland and their reported violations in the past:
HGH INC WATER SYSTEM (Population served: 613, Groundwater):
Past health violations:
MCL, Single Sample - Between JAN-2011 and MAR-2011, Contaminant: Nitrate. Follow-up actions: St Compliance achieved (APR-01-2011)
MCL, Single Sample - Between APR-2009 and JUN-2009, Contaminant: Nitrate. Follow-up actions: St Compliance achieved (2 times from JUL-01-2009 to JUL-01-2009)
MCL, Single Sample - Between OCT-2007 and DEC-2007, Contaminant: Nitrate. Follow-up actions: St Compliance achieved (8 times from JAN-01-2008 to JAN-15-2008)
MCL, Single Sample - Between JUL-2006 and SEP-2006, Contaminant: Nitrate. Follow-up actions: St BCA signed (DEC-01-2005), St Compliance achieved (2 times from OCT-01-2006 to DEC-29-2006)
MCL, Single Sample - Between APR-2006 and JUN-2006, Contaminant: Nitrate. Follow-up actions: St BCA signed (DEC-01-2005), St Compliance achieved (2 times from OCT-01-2006 to DEC-29-2006)
MCL, Single Sample - Between JAN-2006 and MAR-2006, Contaminant: Nitrate. Follow-up actions: St BCA signed (DEC-01-2005), St Compliance achieved (2 times from OCT-01-2006 to DEC-29-2006)
3 other older health violations
Past monitoring violations:
Monitoring, Repeat Major (TCR) - In JUL-2005, Contaminant: Coliform (TCR)
Serves OR, Population served: 300, Groundwater):
Past monitoring violations:
4 routine major monitoring violations
Serves OR, Population served: 150, Groundwater):
Past monitoring violations:
5 routine major monitoring violations
Population served: 44, Groundwater):
Past monitoring violations:
One routine major monitoring violation
3 regular monitoring violations
Population served: 40, Surface water):
Past health violations:
Treatment Technique (SWTR and GWR) - In NOV-2006
Average household size: This city:
2.4 peopleWashington:
2.5 people
Percentage of family households: This city:
65.8%Whole state:
64.4%
Percentage of households with unmarried partners: This city:
6.0%Whole state:
7.7%
Likely homosexual households (counted as self-reported same-sex unmarried-partner households)
Lesbian couples: 0.4% of all households Gay men: 0.2% of all households
People in group quarters in Richland in 2010:
163 people in nursing facilities/skilled-nursing facilities
107 people in group homes intended for adults
8 people in other noninstitutional facilities
7 people in residential treatment centers for adults
People in group quarters in Richland in 2000:
62 people in nursing homes
48 people in other noninstitutional group quarters
12 people in training schools for juvenile delinquents
7 people in homes for the mentally ill
6 people in mental (psychiatric) hospitals or wards
Banks with most branches in Richland (2011 data):
JPMorgan Chase Bank, National Association: Meadow Springs Financial Center, Richland Branch, Queensgate And Duportail Branch. Info updated 2011/11/10: Bank assets: $1,811,678.0 mil, Deposits: $1,190,738.0 mil, headquarters in Columbus, OH, positive income , International Specialization, 5577 total offices , Holding Company: Jpmorgan Chase & Co.
Sterling Savings Bank: Richland Branch at 211 Torbett Street, branch established on 1985/06/30; Richland In-Store Branch at 2801 Duportail Street, branch established on 2004/01/02. Info updated 2012/03/21: Bank assets: $9,207.8 mil, Deposits: $6,454.1 mil, headquarters in Spokane, WA, positive income , Commercial Lending Specialization, 192 total offices , Holding Company: Sterling Financial Corporation
KeyBank National Association: Richland Branch at 1275 Lee Boulevard, branch established on 1920/01/01. Info updated 2008/03/03: Bank assets: $86,198.8 mil, Deposits: $64,214.8 mil, headquarters in Cleveland, OH, positive income , Commercial Lending Specialization, 1067 total offices , Holding Company: Keycorp
Bank of the West: Richland Branch at 1045 George Washington Way, branch established on 1994/01/31. Info updated 2009/11/16: Bank assets: $62,408.3 mil, Deposits: $43,995.2 mil, headquarters in San Francisco, CA, positive income , 647 total offices , Holding Company: Bnp Paribas
Community First Bank: Richland Branch at 1060 Jadwin Avenue, Suite 101, branch established on 2005/06/24. Info updated 2007/05/31: Bank assets: $199.8 mil, Deposits: $179.7 mil, headquarters in Kennewick, WA, positive income , Commercial Lending Specialization, 5 total offices , Holding Company: Community First Bancorporation, Inc.
U.S. Bank National Association: Richland Branch at 701 Jadwin Avenue, branch established on 1966/08/22. Info updated 2012/01/30: Bank assets: $330,470.8 mil, Deposits: $236,091.5 mil, headquarters in Cincinnati, OH, positive income , 3121 total offices , Holding Company: U.S. Bancorp
Banner Bank: Richland Branch at 1221 Jadwin Avenue, branch established on 1890/01/01. Info updated 2011/05/03: Bank assets: $4,048.2 mil, Deposits: $3,348.4 mil, headquarters in Walla Walla, WA, positive income , Commercial Lending Specialization, 87 total offices , Holding Company: Banner Corporation
Columbia State Bank: Meadow Springs Branch at 139 Gage Boulevard, branch established on 2006/01/09. Info updated 2011/08/09: Bank assets: $4,785.2 mil, Deposits: $3,892.8 mil, headquarters in Tacoma, WA, positive income , Commercial Lending Specialization, 104 total offices , Holding Company: Columbia Banking System, Inc.
AmericanWest Bank: Richland Financial Center Branch at 2590 Queensgate, branch established on 2008/05/04. Info updated 2011/12/12: Bank assets: $2,274.6 mil, Deposits: $1,889.1 mil, headquarters in Spokane, WA, positive income , Commercial Lending Specialization, 76 total offices , Holding Company: Skbhc Holdings Llc
2 other banks with 2 local branches
For population 15 years and over in Richland:
Never married: 34.9%Now married: 46.9%Separated: 1.2%Widowed: 5.7%Divorced: 11.3% For population 25 years and over in Richland:
High school or higher: 96.0%Bachelor's degree or higher: 45.7%Graduate or professional degree: 19.9%Unemployed: 4.3%Mean travel time to work (commute): 17.5 minutes
Education Gini index (Inequality in education) Here:
10.8Washington average:
11.6
Religion statistics for Richland, WA (based on Benton County data)
Religion Adherents Congregations Catholic 26,500 5 Evangelical Protestant 20,943 86 Other 16,145 43 Mainline Protestant 10,217 28 None 101,372 -
Source: Clifford Grammich, Kirk Hadaway, Richard Houseal, Dale E.Jones, Alexei Krindatch, Richie Stanley and Richard H.Taylor. 2012. 2010 U.S.Religion Census: Religious Congregations & Membership Study. Association of Statisticians of American Religious Bodies. Jones, Dale E., et al. 2002. Congregations and Membership in the United States 2000. Nashville, TN: Glenmary Research Center. Graphs represent county-level data
Food Environment Statistics: Number of grocery stores : 19Benton County :
1.20 / 10,000 pop.State :
2.06 / 10,000 pop.
Number of supercenters and club stores : 4Benton County :
0.25 / 10,000 pop.Washington :
0.19 / 10,000 pop.
Number of convenience stores (no gas) : 10Benton County :
0.63 / 10,000 pop.Washington :
1.18 / 10,000 pop.
Number of convenience stores (with gas) : 54This county :
3.40 / 10,000 pop.Washington :
2.67 / 10,000 pop.
Number of full-service restaurants : 97This county :
6.11 / 10,000 pop.State :
8.26 / 10,000 pop.
Adult obesity rate : Benton County :
27.5%State :
25.7%
Low-income preschool obesity rate : Here :
9.9%Washington :
13.9%
Health and Nutrition: Healthy diet rate : This city:
52.4%Washington:
49.9%
Average overall health of teeth and gums : Richland:
50.3%Washington:
47.2%
People feeling badly about themselves : This city:
20.1%Washington:
20.9%
People not drinking alcohol at all : Here:
10.1%Washington:
10.5%
Average hours sleeping at night : Overweight people : Richland:
34.1%Washington:
32.8%
General health condition : Average condition of hearing : Here:
79.1%Washington:
79.4%
More about Health and Nutrition of Richland, WA Residents
Local government employment and payroll (March 2022)
Function
Full-time employees
Monthly full-time payroll
Average yearly full-time wage
Part-time employees
Monthly part-time payroll
Other and Unallocable
84 $625,277 $89,325 6 $19,377 Firefighters
75 $810,767 $129,723 0 $0 Police Protection - Officers
58 $578,542 $119,698 0 $0 Electric Power
51 $496,288 $116,774 0 $0 Financial Administration
45 $333,285 $88,876 0 $0 Parks and Recreation
39 $232,161 $71,434 20 $36,770 Solid Waste Management
26 $157,310 $72,605 2 $6,490 Sewerage
23 $149,194 $77,840 0 $0 Water Supply
22 $145,195 $79,197 0 $0 Other Government Administration
19 $90,288 $57,024 0 $0 Police - Other
17 $85,991 $60,700 0 $0 Local Libraries
14 $74,280 $63,669 15 $23,562 Streets and Highways
9 $67,879 $90,505 0 $0 Housing and Community Development (Local)
6 $52,441 $104,882 0 $0 Judicial and Legal
4 $34,290 $102,870 0 $0 Fire - Other
3 $17,517 $70,068 0 $0
Totals for Government
495 $3,950,706 $95,775 43 $86,200
Richland government finances - Expenditure in 2021 (per resident):
Construction - Local Fire Protection: $2,643,000 ($42.07)
General - Other: $1,444,000 ($22.99)Current Operations - Electric Utilities: $61,463,000 ($978.38)
General - Other: $20,136,000 ($320.53)Police Protection: $13,810,000 ($219.83)Water Utilities: $11,939,000 ($190.05)Sewerage: $10,280,000 ($163.64)Solid Waste Management: $9,835,000 ($156.56)Local Fire Protection: $9,614,000 ($153.04)Parks and Recreation: $8,547,000 ($136.05)Financial Administration: $8,226,000 ($130.94)Health - Other: $5,069,000 ($80.69)Housing and Community Development: $4,426,000 ($70.45)Central Staff Services: $4,424,000 ($70.42)Regular Highways: $3,216,000 ($51.19)Libraries: $1,981,000 ($31.53)Correctional Institutions: $1,275,000 ($20.30)Protective Inspection and Regulation - Other: $279,000 ($4.44)Miscellaneous Commercial Activities - Other: $251,000 ($4.00)Electric Utilities - Interest on Debt: $3,055,000 ($48.63)
General - Interest on Debt: $2,443,000 ($38.89)
Other Capital Outlay - Electric Utilities: $10,886,000 ($173.29)
Water Utilities: $4,770,000 ($75.93)Sewerage: $1,290,000 ($20.53)General - Other: $1,056,000 ($16.81)Financial Administration: $322,000 ($5.13)Local Fire Protection: $245,000 ($3.90)Natural Resources - Other: $72,000 ($1.15)Health - Other: $25,000 ($0.40)Police Protection: $21,000 ($0.33)Total Salaries and Wages: $50,673,000 ($806.63)
Water Utilities - Interest on Debt: $722,000 ($11.49)
Richland government finances - Revenue in 2021 (per resident):
Charges - Other: $23,711,000 ($377.44)
Sewerage: $12,009,000 ($191.16)Solid Waste Management: $10,575,000 ($168.34)Parks and Recreation: $1,172,000 ($18.66)Housing and Community Development: $268,000 ($4.27)Regular Highways: $23,000 ($0.37)Federal Intergovernmental - Other: $1,326,000 ($21.11)
Housing and Community Development: $1,027,000 ($16.35)Local Intergovernmental - Other: $3,943,000 ($62.77)
Miscellaneous - Special Assessments: $2,529,000 ($40.26)
Rents: $2,045,000 ($32.55)Interest Earnings: $1,888,000 ($30.05)Sale of Property: $1,340,000 ($21.33)General Revenue - Other: $600,000 ($9.55)Fines and Forfeits: $392,000 ($6.24)Donations From Private Sources: $69,000 ($1.10)Revenue - Electric Utilities: $73,695,000 ($1173.09)
Water Utilities: $15,770,000 ($251.03)State Intergovernmental - Highways: $8,026,000 ($127.76)
Health and Hospitals: $4,106,000 ($65.36)Other: $3,041,000 ($48.41)General Local Government Support: $833,000 ($13.26)Tax - Property: $19,026,000 ($302.86)
General Sales and Gross Receipts: $17,100,000 ($272.20)Public Utilities Sales: $14,006,000 ($222.95)Documentary and Stock Transfer: $3,260,000 ($51.89)Other License: $2,660,000 ($42.34)Motor Vehicle License: $1,031,000 ($16.41)Other Selective Sales: $1,005,000 ($16.00)Occupation and Business License - Other: $683,000 ($10.87)Amusements Sales: $170,000 ($2.71)
Richland government finances - Debt in 2021 (per resident):
Long Term Debt - Beginning Outstanding - Unspecified Public Purpose: $208,709,000 ($3322.28)
Outstanding Unspecified Public Purpose: $193,465,000 ($3079.62)Retired Unspecified Public Purpose: $32,751,000 ($521.34)Issue, Unspecified Public Purpose: $17,507,000 ($278.68)
Richland government finances - Cash and Securities in 2021 (per resident):
Other Funds - Cash and Securities: $159,968,000 ($2546.41)
Businesses in Richland, WA
Name Count Name Count
7-Eleven 3 Kroger 2 AT&T 1 La-Z-Boy 1 Ace Hardware 2 Little Caesars Pizza 1 Albertsons 2 Long John Silver's 1 Applebee's 1 Macy's 1 Arby's 1 Marriott 1 Ashley Furniture 1 MasterBrand Cabinets 6 AutoZone 1 Maurices 1 BMW 1 McDonald's 3 Baskin-Robbins 2 Motel 6 1 Blockbuster 2 New Balance 1 Budget Car Rental 1 Nike 3 Burger King 2 Office Depot 1 Chuck E. Cheese's 1 Panda Express 1 Circle K 4 Papa John's Pizza 1 Clarion 1 Pizza Hut 1 Curves 1 Quiznos 1 Dairy Queen 2 RadioShack 1 Days Inn 1 Rite Aid 2 Dennys 1 Rue21 1 Discount Tire 1 Safeway 1 Domino's Pizza 1 Staples 1 Famous Footwear 1 Starbucks 7 FedEx 11 Subway 5 GNC 3 T-Mobile 2 GameStop 1 Taco Bell 2 H&R Block 2 Target 1 Haworth 1 U-Haul 2 Hilton 1 U.S. Cellular 1 Holiday Inn 1 UPS 11 Home Depot 1 Vons 1 Honda 1 Walgreens 3 Jack In The Box 2 Walmart 1 Jones New York 2 Wendy's 1 KFC 1 YMCA 1 Kohl's 1
Strongest AM radio stations in Richland:
KALE (960 AM; 5 kW; RICHLAND, WA; Owner: NEW NORTHWEST BROADCASTERS, LLC)
KFLD (870 AM; 10 kW; PASCO, WA; Owner: CAPSTAR TX LIMITED PARTNERSHIP)
KONA (610 AM; 5 kW; KENNEWICK-RICHLAND-P, WA; Owner: COMMONWEALTH LICENSE SUBSIDIARY, LLC)
KTCR (1340 AM; 1 kW; KENNEWICK, WA; Owner: NEW NORTHWEST BROADCASTERS, LLC)
KTBI (810 AM; daytime; 50 kW; EPHRATA, WA; Owner: TACOMA BROADCASTERS, INCORPORATED)
KZTS (1210 AM; 10 kW; SUNNYSIDE, WA; Owner: BUTTERFIELD BROADCASTING CORPORATION)
KZXR (1310 AM; 5 kW; PROSSER, WA; Owner: MOON BROADCASTING PROSSER LLC)
KOHU (1360 AM; 4 kW; HERMISTON, OR; Owner: WESTEND RADIO, LLC)
KLWJ (1090 AM; daytime; 2 kW; UMATILLA, OR; Owner: UMATILLA BROADCASTING, INC.)
KYAK (930 AM; 10 kW; YAKIMA, WA)
KPOJ (620 AM; 50 kW; PORTLAND, OR; Owner: CITICASTERS LICENSES, L.P.)
KIRO (710 AM; 50 kW; SEATTLE, WA; Owner: ENTERCOM SEATTLE LICENSE, LLC)
KXL (750 AM; 50 kW; PORTLAND, OR; Owner: ROSE CITY RADIO CORPORATION)
Strongest FM radio stations in Richland:
KXRX (97.1 FM; WALLA WALLA, WA; Owner: CAPSTAR TX LIMITED PARTNERSHIP)
KIOK (94.9 FM; RICHLAND, WA; Owner: NEW NORTHWEST BROADCASTERS, LLC)
KONA-FM (105.3 FM; KENNEWICK, WA; Owner: COMMONWEALTH LICENSE SUBSIDIARY, LLC)
KFAE-FM (89.1 FM; RICHLAND, WA; Owner: WASHINGTON STATE UNIVERSITY)
KEYW (98.3 FM; PASCO, WA; Owner: CAPSTAR TX LIMITED PARTNERSHIP)
KORD-FM (102.7 FM; RICHLAND, WA; Owner: CAPSTAR TX LIMITED PARTNERSHIP)
KEGX (106.5 FM; RICHLAND, WA; Owner: NEW NORTHWEST BROADCASTERS, LLC)
K261CG (100.1 FM; PASCO, WA; Owner: NORTHWEST CHICANO RADIO NETWORK)
KGDN (101.3 FM; PASCO, WA; Owner: WEST PASCO FINE ARTS RADIO)
KOLU (90.1 FM; PASCO, WA; Owner: RIVERVIEW BAPTIST CHRISTIAN SCHOOLS)
KBLD (91.7 FM; KENNEWICK, WA; Owner: CSN INTERNATIONAL)
KGSG (93.7 FM; PASCO, WA; Owner: GOSPEL MUSIC BROADCASTING CORP.)
K204CZ (88.7 FM; KENNEWICK, WA; Owner: CALVARY CHAPEL OF TWIN FALLS, INC.)
K204DH (88.7 FM; HANFORD, WA; Owner: CALVARY CHAPEL OF TWIN FALLS, INC.)
KMNA (101.7 FM; PROSSER, WA; Owner: MOON BROADCASTING PROSSER LLC)
KRCW (96.3 FM; ROYAL CITY, WA; Owner: FARMWORKER EDUCATIONAL RADIO NETWORK, INC.)
KLES (98.7 FM; MABTON, WA; Owner: ON-AIR FAMILY, LLC)
KARY-FM (100.9 FM; GRANDVIEW, WA; Owner: NEW NORTHWEST BROADCASTERS, LLC)
KUJ-FM (99.1 FM; WALLA WALLA, WA; Owner: ALEXANDRA COMMUNICATIONS)
KOLW (97.9 FM; MILTON-FREEWATER, OR; Owner: CAPSTAR TX LIMITED PARTNERSHIP)
TV broadcast stations around Richland:
KBWU-LP (Channel 66; RICHLAND, ET AL, WA; Owner: MOUNTAIN LICENSES, L.P.)
KRLB-LP (Channel 49; RICHLAND, ETC., WA; Owner: RADIANT LIGHT BROADCASTING)
KVVK-CA (Channel 60; KENNEWICK, ETC., WA; Owner: WATCHTV, INC.)
K54DU (Channel 54; RICHLAND, WA; Owner: THREE ANGELS BROADCASTING NETWORK)
KEPR-TV (Channel 19; PASCO, WA; Owner: FISHER BROADCASTING - WASHINGTON TV, L.L.C.)
K04OI (Channel 4; PASCO-KENNEWICK, WA; Owner: RON BEVINS)
KNDU (Channel 25; RICHLAND, WA; Owner: KHQ, INCORPORATED)
KVEW (Channel 42; KENNEWICK, WA; Owner: APPLE VALLEY BROADCASTING, INC.)
KTNW (Channel 31; RICHLAND, WA; Owner: WASHINGTON STATE UNIVERSITY)
National Bridge Inventory (NBI) Statistics 67 Number of bridges1,499ft / 457m Total length $299,466,000 Total costs1,325,085 Total average daily traffic101,490 Total average daily truck traffic
New bridges - historical statistics
1 1920-1929 4 1950-1959 5 1960-1969 3 1970-1979 45 1980-1989 2 1990-1999 5 2000-2009 1 2010-2019 1 2020-2022
See full National Bridge Inventory statistics for Richland, WA
Home Mortgage Disclosure Act Aggregated Statistics For Year 2009(Based on 6 full and 3 partial tracts) A) FHA, FSA/RHS & VA B) Conventional C) Refinancings D) Home Improvement Loans E) Loans on Dwellings For 5+ Families F) Non-occupant Loans on G) Loans On Manufactured Number Average Value Number Average Value Number Average Value Number Average Value Number Average Value Number Average Value Number Average Value
LOANS ORIGINATED 357 $159,715 395 $192,043 1,112 $172,579 81 $73,269 4 $739,250 78 $132,368 20 $96,993 APPLICATIONS APPROVED, NOT ACCEPTED 8 $156,125 22 $174,504 102 $164,441 7 $41,060 0 $0 9 $105,481 3 $58,560 APPLICATIONS DENIED 28 $154,525 40 $150,722 243 $162,244 32 $73,399 0 $0 26 $143,287 15 $54,061 APPLICATIONS WITHDRAWN 37 $144,700 42 $178,816 278 $166,435 22 $86,492 0 $0 19 $120,525 4 $68,318 FILES CLOSED FOR INCOMPLETENESS 5 $115,044 5 $116,576 67 $152,073 11 $53,862 0 $0 1 $880 2 $42,165
Aggregated Statistics For Year 2008(Based on 6 full and 3 partial tracts) A) FHA, FSA/RHS & VA B) Conventional C) Refinancings D) Home Improvement Loans E) Loans on Dwellings For 5+ Families F) Non-occupant Loans on G) Loans On Manufactured Number Average Value Number Average Value Number Average Value Number Average Value Number Average Value Number Average Value Number Average Value
LOANS ORIGINATED 202 $154,774 550 $195,453 541 $157,660 113 $56,918 1 $1,074,200 120 $155,274 29 $89,681 APPLICATIONS APPROVED, NOT ACCEPTED 13 $133,788 57 $185,814 74 $145,366 10 $89,238 0 $0 14 $109,375 6 $71,287 APPLICATIONS DENIED 18 $140,604 65 $167,414 334 $149,905 78 $76,392 1 $593,000 29 $124,609 25 $64,103 APPLICATIONS WITHDRAWN 17 $147,075 65 $184,918 169 $154,943 21 $85,751 0 $0 25 $134,646 3 $133,497 FILES CLOSED FOR INCOMPLETENESS 4 $87,770 9 $182,022 29 $144,014 17 $64,356 0 $0 1 $57,000 1 $38,000
Aggregated Statistics For Year 2007(Based on 6 full and 3 partial tracts) A) FHA, FSA/RHS & VA B) Conventional C) Refinancings D) Home Improvement Loans E) Loans on Dwellings For 5+ Families F) Non-occupant Loans on G) Loans On Manufactured Number Average Value Number Average Value Number Average Value Number Average Value Number Average Value Number Average Value Number Average Value
LOANS ORIGINATED 88 $145,072 964 $152,778 525 $127,045 146 $48,473 0 $0 153 $131,985 36 $87,630 APPLICATIONS APPROVED, NOT ACCEPTED 6 $138,625 87 $153,994 96 $127,888 27 $46,276 0 $0 14 $125,476 4 $102,678 APPLICATIONS DENIED 13 $121,638 106 $118,845 355 $137,053 105 $83,516 2 $81,945 36 $100,452 34 $65,819 APPLICATIONS WITHDRAWN 7 $143,704 84 $155,467 226 $135,158 34 $47,453 0 $0 34 $117,296 5 $64,328 FILES CLOSED FOR INCOMPLETENESS 1 $200,960 15 $126,249 35 $142,616 7 $54,073 0 $0 3 $96,667 0 $0
Aggregated Statistics For Year 2006(Based on 6 full and 3 partial tracts) A) FHA, FSA/RHS & VA B) Conventional C) Refinancings D) Home Improvement Loans E) Loans on Dwellings For 5+ Families F) Non-occupant Loans on G) Loans On Manufactured Number Average Value Number Average Value Number Average Value Number Average Value Number Average Value Number Average Value Number Average Value
LOANS ORIGINATED 105 $141,164 1,045 $132,000 530 $116,867 226 $43,425 7 $2,906,070 195 $121,245 22 $116,470 APPLICATIONS APPROVED, NOT ACCEPTED 4 $135,505 115 $117,773 116 $104,894 34 $49,142 0 $0 25 $105,954 6 $66,853 APPLICATIONS DENIED 8 $105,734 143 $107,617 450 $125,759 123 $62,800 0 $0 46 $105,582 27 $84,629 APPLICATIONS WITHDRAWN 14 $142,056 92 $121,873 312 $125,319 40 $71,321 1 $117,510 26 $128,317 6 $120,847 FILES CLOSED FOR INCOMPLETENESS 1 $113,250 14 $140,572 69 $141,436 5 $68,736 0 $0 8 $136,045 0 $0
Aggregated Statistics For Year 2005(Based on 6 full and 3 partial tracts) A) FHA, FSA/RHS & VA B) Conventional C) Refinancings D) Home Improvement Loans E) Loans on Dwellings For 5+ Families F) Non-occupant Loans on G) Loans On Manufactured Number Average Value Number Average Value Number Average Value Number Average Value Number Average Value Number Average Value Number Average Value
LOANS ORIGINATED 116 $133,396 1,139 $125,091 675 $122,170 187 $44,706 7 $3,309,029 178 $105,873 31 $84,445 APPLICATIONS APPROVED, NOT ACCEPTED 3 $156,897 98 $120,114 153 $132,159 24 $52,583 0 $0 18 $137,056 6 $75,015 APPLICATIONS DENIED 10 $161,454 124 $105,690 435 $113,177 86 $41,071 0 $0 42 $97,948 26 $84,052 APPLICATIONS WITHDRAWN 9 $131,589 117 $131,579 346 $126,455 34 $133,494 0 $0 31 $122,469 11 $103,785 FILES CLOSED FOR INCOMPLETENESS 1 $45,170 22 $115,324 72 $132,050 5 $18,958 0 $0 3 $92,807 1 $122,410
Aggregated Statistics For Year 2004(Based on 6 full and 3 partial tracts) A) FHA, FSA/RHS & VA B) Conventional C) Refinancings D) Home Improvement Loans E) Loans on Dwellings For 5+ Families F) Non-occupant Loans on G) Loans On Manufactured Number Average Value Number Average Value Number Average Value Number Average Value Number Average Value Number Average Value Number Average Value
LOANS ORIGINATED 117 $118,437 906 $129,739 786 $118,328 141 $44,243 6 $1,961,128 131 $98,957 25 $89,328 APPLICATIONS APPROVED, NOT ACCEPTED 4 $113,530 81 $126,851 157 $121,350 20 $52,654 1 $5,200,000 15 $103,692 6 $65,317 APPLICATIONS DENIED 12 $116,616 92 $99,530 362 $117,941 64 $49,349 1 $85,000 34 $93,026 24 $78,250 APPLICATIONS WITHDRAWN 13 $116,571 79 $124,857 315 $124,892 33 $46,380 1 $15,000 17 $103,558 9 $85,990 FILES CLOSED FOR INCOMPLETENESS 2 $130,085 8 $141,631 82 $136,330 8 $51,588 0 $0 5 $87,032 3 $89,500
Aggregated Statistics For Year 2003(Based on 6 full and 3 partial tracts) A) FHA, FSA/RHS & VA B) Conventional C) Refinancings D) Home Improvement Loans E) Loans on Dwellings For 5+ Families F) Non-occupant Loans on Number Average Value Number Average Value Number Average Value Number Average Value Number Average Value Number Average Value
LOANS ORIGINATED 150 $119,676 845 $135,670 2,303 $121,113 160 $35,978 8 $1,761,446 204 $101,712 APPLICATIONS APPROVED, NOT ACCEPTED 12 $97,500 66 $136,022 214 $117,640 5 $11,160 0 $0 14 $74,650 APPLICATIONS DENIED 14 $109,325 87 $113,971 389 $110,870 26 $29,095 0 $0 30 $102,305 APPLICATIONS WITHDRAWN 7 $121,637 58 $157,172 389 $131,608 5 $40,976 0 $0 16 $81,705 FILES CLOSED FOR INCOMPLETENESS 2 $90,185 11 $136,223 80 $122,753 5 $17,914 0 $0 2 $108,500
Aggregated Statistics For Year 2002(Based on 6 full and 1 partial tracts) A) FHA, FSA/RHS & VA B) Conventional C) Refinancings D) Home Improvement Loans E) Loans on Dwellings For 5+ Families F) Non-occupant Loans on Number Average Value Number Average Value Number Average Value Number Average Value Number Average Value Number Average Value
LOANS ORIGINATED 133 $100,838 511 $118,192 823 $101,716 115 $28,780 4 $3,645,230 101 $84,455 APPLICATIONS APPROVED, NOT ACCEPTED 3 $120,667 33 $110,028 94 $83,877 5 $10,800 0 $0 9 $95,333 APPLICATIONS DENIED 10 $100,786 44 $82,071 157 $88,514 16 $17,688 0 $0 7 $79,714 APPLICATIONS WITHDRAWN 4 $105,250 39 $99,055 164 $96,229 3 $24,000 0 $0 10 $97,033 FILES CLOSED FOR INCOMPLETENESS 1 $78,000 16 $81,250 23 $81,616 0 $0 0 $0 4 $61,750
Aggregated Statistics For Year 2001(Based on 6 full and 1 partial tracts) A) FHA, FSA/RHS & VA B) Conventional C) Refinancings D) Home Improvement Loans E) Loans on Dwellings For 5+ Families F) Non-occupant Loans on Number Average Value Number Average Value Number Average Value Number Average Value Number Average Value Number Average Value
LOANS ORIGINATED 130 $92,071 444 $105,427 456 $95,192 53 $38,534 2 $1,247,000 76 $75,141 APPLICATIONS APPROVED, NOT ACCEPTED 7 $97,571 35 $82,115 63 $88,517 10 $24,898 0 $0 17 $94,833 APPLICATIONS DENIED 5 $107,000 62 $83,552 150 $78,240 18 $19,413 3 $3,166,667 10 $74,474 APPLICATIONS WITHDRAWN 3 $102,000 28 $102,947 143 $90,261 6 $56,167 0 $0 3 $95,000 FILES CLOSED FOR INCOMPLETENESS 0 $0 3 $147,000 19 $87,272 4 $22,662 0 $0 2 $28,485
Aggregated Statistics For Year 2000(Based on 6 full and 1 partial tracts) A) FHA, FSA/RHS & VA B) Conventional C) Refinancings D) Home Improvement Loans E) Loans on Dwellings For 5+ Families F) Non-occupant Loans on Number Average Value Number Average Value Number Average Value Number Average Value Number Average Value Number Average Value
LOANS ORIGINATED 120 $88,674 382 $96,528 129 $76,580 56 $24,318 2 $2,025,070 59 $87,115 APPLICATIONS APPROVED, NOT ACCEPTED 6 $84,193 37 $70,523 31 $76,157 17 $16,606 0 $0 1 $12,720 APPLICATIONS DENIED 15 $76,277 115 $64,135 104 $61,842 28 $29,812 0 $0 10 $64,200 APPLICATIONS WITHDRAWN 10 $70,342 33 $99,293 56 $69,535 8 $56,300 1 $1,200,000 4 $64,500 FILES CLOSED FOR INCOMPLETENESS 1 $54,000 6 $99,833 28 $70,796 0 $0 0 $0 2 $62,500
Aggregated Statistics For Year 1999(Based on 5 full and 3 partial tracts) A) FHA, FSA/RHS & VA B) Conventional C) Refinancings D) Home Improvement Loans E) Loans on Dwellings For 5+ Families F) Non-occupant Loans on Number Average Value Number Average Value Number Average Value Number Average Value Number Average Value Number Average Value
LOANS ORIGINATED 196 $96,372 609 $114,385 441 $90,336 148 $23,654 3 $1,466,107 94 $90,629 APPLICATIONS APPROVED, NOT ACCEPTED 5 $103,288 82 $84,423 68 $84,100 19 $17,209 1 $987,430 9 $69,642 APPLICATIONS DENIED 12 $89,286 194 $80,379 168 $80,106 54 $21,814 0 $0 10 $57,724 APPLICATIONS WITHDRAWN 11 $87,569 73 $109,255 132 $69,668 17 $64,694 0 $0 11 $55,519 FILES CLOSED FOR INCOMPLETENESS 1 $120,110 10 $94,881 44 $83,431 6 $30,995 0 $0 1 $65,600
Detailed mortgage data for all 9 tracts in Richland, WA
Private Mortgage Insurance Companies Aggregated Statistics For Year 2009(Based on 6 full and 3 partial tracts) A) Conventional B) Refinancings C) Non-occupant Loans on Number Average Value Number Average Value Number Average Value
LOANS ORIGINATED 100 $206,215 70 $205,889 2 $184,000 APPLICATIONS APPROVED, NOT ACCEPTED 14 $226,269 15 $203,731 1 $144,000 APPLICATIONS DENIED 8 $200,390 12 $214,157 0 $0 APPLICATIONS WITHDRAWN 8 $167,930 6 $194,205 0 $0 FILES CLOSED FOR INCOMPLETENESS 0 $0 0 $0 0 $0
Aggregated Statistics For Year 2008(Based on 6 full and 3 partial tracts) A) Conventional B) Refinancings C) Non-occupant Loans on Number Average Value Number Average Value Number Average Value
LOANS ORIGINATED 207 $190,642 79 $208,597 23 $135,385 APPLICATIONS APPROVED, NOT ACCEPTED 42 $219,626 21 $195,113 5 $202,036 APPLICATIONS DENIED 6 $257,210 8 $227,651 4 $170,200 APPLICATIONS WITHDRAWN 38 $319,073 5 $308,806 1 $153,970 FILES CLOSED FOR INCOMPLETENESS 3 $124,667 1 $91,640 3 $124,667
Aggregated Statistics For Year 2007(Based on 6 full and 3 partial tracts) A) Conventional B) Refinancings C) Non-occupant Loans on D) Loans On Manufactured Number Average Value Number Average Value Number Average Value Number Average Value
LOANS ORIGINATED 267 $163,144 60 $166,223 20 $125,588 2 $65,785 APPLICATIONS APPROVED, NOT ACCEPTED 18 $220,141 18 $180,837 1 $126,000 0 $0 APPLICATIONS DENIED 2 $154,370 1 $208,510 0 $0 0 $0 APPLICATIONS WITHDRAWN 6 $222,755 4 $110,748 0 $0 0 $0 FILES CLOSED FOR INCOMPLETENESS 0 $0 1 $256,000 0 $0 0 $0
Aggregated Statistics For Year 2006(Based on 6 full and 3 partial tracts) A) Conventional B) Refinancings C) Non-occupant Loans on D) Loans On Manufactured Number Average Value Number Average Value Number Average Value Number Average Value
LOANS ORIGINATED 142 $150,944 28 $172,525 14 $127,744 2 $96,015 APPLICATIONS APPROVED, NOT ACCEPTED 14 $165,099 14 $207,355 0 $0 0 $0 APPLICATIONS DENIED 1 $71,000 2 $185,550 1 $49,090 0 $0 APPLICATIONS WITHDRAWN 3 $408,907 4 $140,045 0 $0 0 $0 FILES CLOSED FOR INCOMPLETENESS 0 $0 0 $0 0 $0 0 $0
Aggregated Statistics For Year 2005(Based on 6 full and 3 partial tracts) A) Conventional B) Refinancings C) Non-occupant Loans on Number Average Value Number Average Value Number Average Value
LOANS ORIGINATED 163 $146,740 61 $159,033 16 $106,586 APPLICATIONS APPROVED, NOT ACCEPTED 17 $252,644 18 $160,434 2 $98,520 APPLICATIONS DENIED 0 $0 0 $0 0 $0 APPLICATIONS WITHDRAWN 2 $147,045 1 $139,000 0 $0 FILES CLOSED FOR INCOMPLETENESS 0 $0 1 $141,390 0 $0
Aggregated Statistics For Year 2004(Based on 6 full and 3 partial tracts) A) Conventional B) Refinancings C) Non-occupant Loans on D) Loans On Manufactured Number Average Value Number Average Value Number Average Value Number Average Value
LOANS ORIGINATED 145 $149,338 74 $137,433 17 $95,942 3 $90,973 APPLICATIONS APPROVED, NOT ACCEPTED 30 $144,365 29 $140,306 5 $112,734 1 $142,700 APPLICATIONS DENIED 1 $56,140 2 $173,525 0 $0 0 $0 APPLICATIONS WITHDRAWN 9 $127,091 5 $165,588 0 $0 1 $106,000 FILES CLOSED FOR INCOMPLETENESS 1 $65,000 2 $86,420 0 $0 1 $62,840
Aggregated Statistics For Year 2003(Based on 6 full and 3 partial tracts) A) Conventional B) Refinancings C) Non-occupant Loans on Number Average Value Number Average Value Number Average Value
LOANS ORIGINATED 199 $147,863 227 $138,570 28 $102,175 APPLICATIONS APPROVED, NOT ACCEPTED 23 $170,403 28 $144,522 3 $70,233 APPLICATIONS DENIED 3 $147,503 4 $142,202 1 $45,820 APPLICATIONS WITHDRAWN 3 $137,333 6 $118,165 0 $0 FILES CLOSED FOR INCOMPLETENESS 0 $0 1 $130,000 0 $0
Aggregated Statistics For Year 2002(Based on 6 full and 1 partial tracts) A) Conventional B) Refinancings C) Non-occupant Loans on Number Average Value Number Average Value Number Average Value
LOANS ORIGINATED 131 $127,676 86 $116,098 14 $98,879 APPLICATIONS APPROVED, NOT ACCEPTED 17 $105,421 13 $108,487 2 $116,745 APPLICATIONS DENIED 4 $87,750 3 $138,000 0 $0 APPLICATIONS WITHDRAWN 4 $118,012 3 $127,000 0 $0 FILES CLOSED FOR INCOMPLETENESS 3 $130,667 0 $0 0 $0
Aggregated Statistics For Year 2001(Based on 6 full and 1 partial tracts) A) Conventional B) Refinancings C) Non-occupant Loans on Number Average Value Number Average Value Number Average Value
LOANS ORIGINATED 134 $115,150 65 $112,054 12 $62,568 APPLICATIONS APPROVED, NOT ACCEPTED 7 $140,949 6 $86,667 1 $59,000 APPLICATIONS DENIED 3 $64,043 4 $139,750 1 $86,000 APPLICATIONS WITHDRAWN 6 $103,000 1 $104,790 0 $0 FILES CLOSED FOR INCOMPLETENESS 0 $0 0 $0 0 $0
Aggregated Statistics For Year 2000(Based on 6 full and 1 partial tracts) A) Conventional B) Refinancings C) Non-occupant Loans on Number Average Value Number Average Value Number Average Value
LOANS ORIGINATED 118 $102,159 15 $103,087 13 $63,845 APPLICATIONS APPROVED, NOT ACCEPTED 13 $107,090 1 $168,000 1 $96,000 APPLICATIONS DENIED 0 $0 3 $106,333 0 $0 APPLICATIONS WITHDRAWN 3 $140,280 1 $136,000 0 $0 FILES CLOSED FOR INCOMPLETENESS 1 $105,000 0 $0 0 $0
Aggregated Statistics For Year 1999(Based on 5 full and 3 partial tracts) A) Conventional B) Refinancings C) Non-occupant Loans on Number Average Value Number Average Value Number Average Value
LOANS ORIGINATED 217 $127,511 65 $112,873 7 $81,961 APPLICATIONS APPROVED, NOT ACCEPTED 21 $140,541 21 $112,009 1 $74,940 APPLICATIONS DENIED 1 $120,900 3 $82,070 0 $0 APPLICATIONS WITHDRAWN 2 $128,510 2 $109,435 0 $0 FILES CLOSED FOR INCOMPLETENESS 3 $145,760 1 $161,900 0 $0
Fire-safe hotels and motels in Richland, Washington:
Red Lion Hotel Richland Hanford House, 802 George Washington Way, Richland, Washington 99352 Phone: (509) 946-7611, Fax: (509) 943-8564
Clarion Hotel And Conference Center Of Richland, 1515 George Washington Way, Richland, Washington 99352 Phone: (509) 946-4121, Fax: (509) 946-2222
Days Inn-richland, 615 Jadwin Ave, Richland, Washington 99352 Phone: (509) 943-4611, Fax: (509) 946-2271
Knights Inn, 1201 George Washington Way, Richland, Washington 99352 Phone: (509) 943-3101, Fax: (509) 946-4522
The Guest House At PNNL, 620 Battelle Blvd, Richland, Washington 99354 Phone: (509) 943-0400, Fax: (509) 375-1092
Towneplace Suites By Marriott Richland Wa, 591 Columbia Point Dr, Richland, Washington 99352 Phone: (509) 943-9800, Fax: (509) 943-9820
Homewood Suites Richland, 1060 George Washington Way, Richland, Washington 99352 Phone: (509) 371-1550, Fax: (509) 371-1551
Home2 Suites by Hilton Richland, 2861 Lincoln Lndg, Richland, Washington 99352 Phone: (509) 460-4040, Fax: (509) 491-4141
All 8 fire-safe hotels and motels in Richland, Washington
Most common first names in Richland, WA among deceased individuals Name Count Lived (average)
John 181 73.8 years Robert 149 71.8 years William 144 74.2 years Mary 144 80.7 years James 121 73.6 years George 106 76.9 years Charles 97 75.0 years Helen 80 80.9 years Dorothy 79 78.0 years Margaret 70 81.3 years
Most common last names in Richland, WA among deceased individuals Last name Count Lived (average)
Smith 78 74.9 years Johnson 56 79.3 years Jones 44 78.8 years Miller 41 76.9 years Brown 37 73.1 years Thompson 33 74.2 years Davis 32 72.6 years Peterson 30 79.5 years Williams 30 76.7 years Nelson 29 73.2 years
Richland compared to Washington state average:
Unemployed percentage significantly below state average. Median age above state average. Length of stay since moving in significantly above state average. Percentage of population with a bachelor's degree or higher above state average.
#4 on the list of "Top 101 cities with largest percentage of males in occupations: life, physical, and social science occupations (population 50,000+)"
#5 on the list of "Top 101 cities with the largest sunshine amount differences during a year (population 50,000+)"
#5 on the list of "Top 101 cities with largest percentage of females in industries: utilities (population 50,000+)"
#8 on the list of "Top 101 cities with largest percentage of females in occupations: architecture and engineering occupations (population 50,000+)"
#8 on the list of "Top 101 cities with largest percentage of males in industries: utilities (population 50,000+)"
#8 on the list of "Top 101 cities with the lowest number of murders per 100,000 residents (population 50,000+)"
#9 on the list of "Top 101 cities with largest percentage of females in industries: construction (population 50,000+)"
#9 on the list of "Top 101 cities with the highest ratio of rapes to murders between 2002 and 2012 (population 50,000+)"
#12 on the list of "Top 101 cities with the smallest precipitation differences during a year (population 50,000+)"
#19 on the list of "Top 101 cities with largest percentage of males in industries: professional, scientific, and technical services (population 50,000+)"
#21 on the list of "Top 101 cities with largest percentage of females in occupations: life, physical, and social science occupations (population 50,000+)"
#22 on the list of "Top 101 cities with the lowest average yearly precipitation (population 50,000+)"
#28 on the list of "Top 101 cities with largest percentage of males in occupations: architecture and engineering occupations (population 50,000+)"
#38 on the list of "Top 101 cities with the most users submitting photos to our site per 10,000 residents (population 50,000+)"
#40 on the list of "Top 101 cities with largest percentage of females in industries: professional, scientific, and technical services (population 50,000+)"
#41 on the list of "Top 101 cities with the lowest minimum monthly sunshine amount (population 50,000+)"
#50 on the list of "Top 101 cities with largest percentage of males in industries: real estate and rental and leasing (population 50,000+)"
#60 on the list of "Top 101 cities with largest percentage of females in industries: agriculture, forestry, fishing and hunting (population 50,000+)"
#60 on the list of "Top 101 cities with the lowest number of robberies per 100,000 residents (population 50,000+)"
#60 on the list of "Top 101 cities with the most people having Doctorate degrees (population 50,000+)"
#94 (98944) on the list of "Top 101 zip codes with the largest percentage of Dutch first ancestries (pop 5,000+)"
#19 on the list of "Top 101 counties with the largest number of people moving in compared to moving out (pop. 50,000+)"
#29 on the list of "Top 101 counties with the highest average weight of females"
#35 on the list of "Top 101 counties with the highest percentage of residents that keep firearms around their homes"
#56 on the list of "Top 101 counties with the largest increase in the number of births per 1000 residents 2000-2006 to 2007-2013 (pop 50,000+)"
#67 on the list of "Top 101 counties with the lowest percentage of residents that drank alcohol in the past 30 days"
Top Patent Applicants
Jun Liu (51)
Christopher Parkinson (38)
Richard D. Smith (28)
Jie Xiao (27)
Wu Xu (25)
Vincent L. Sprenkle (25)
James F. White (22)
Zhenguo Yang (22)
Liyu Li (21)
Yong Wang (21)
Total of 824 patent applications in 2008-2024.

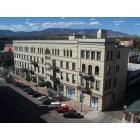
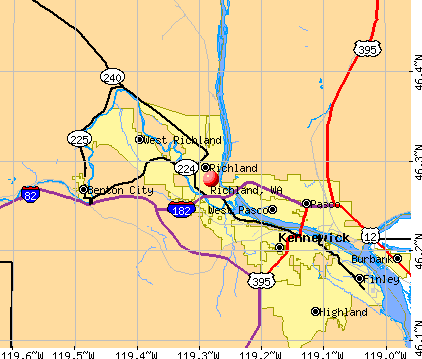


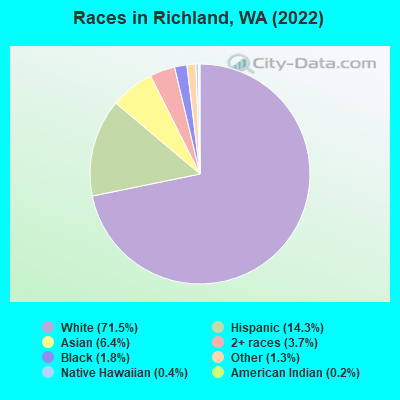
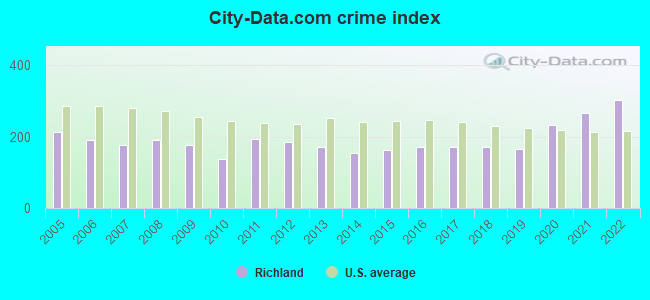
 Recent articles from our blog. Our writers, many of them Ph.D. graduates or candidates, create easy-to-read articles on a wide variety of topics.

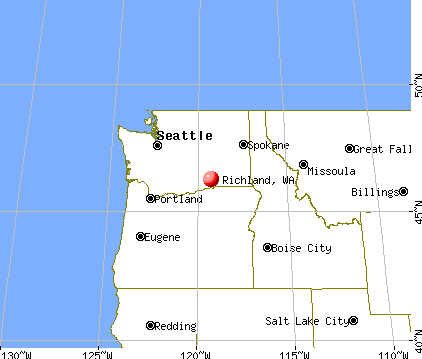
 (7.9 miles
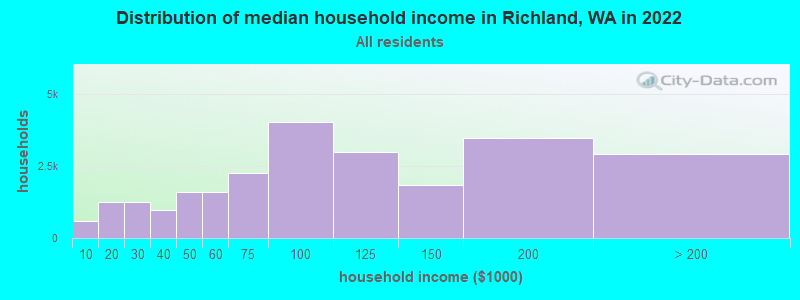
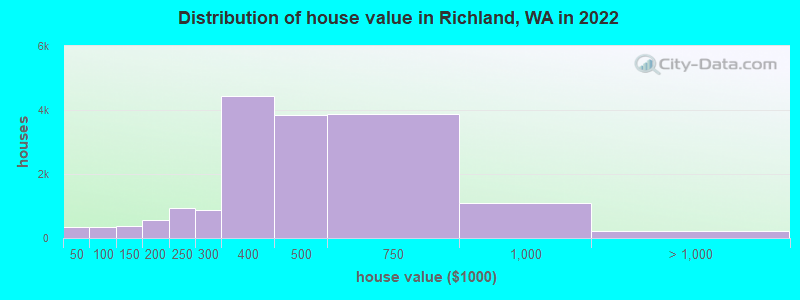
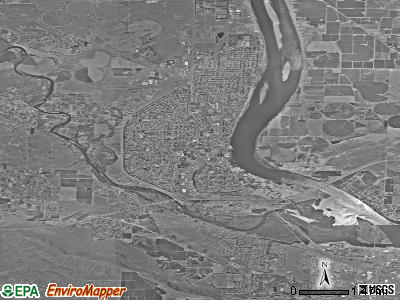
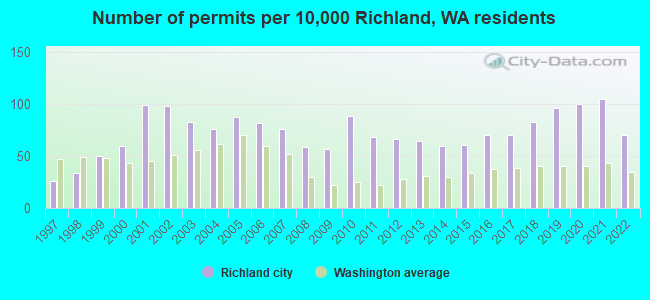
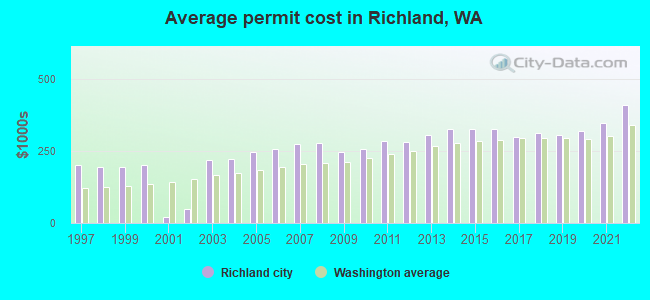
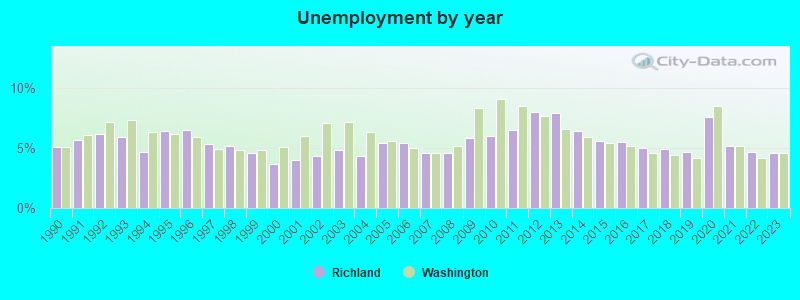
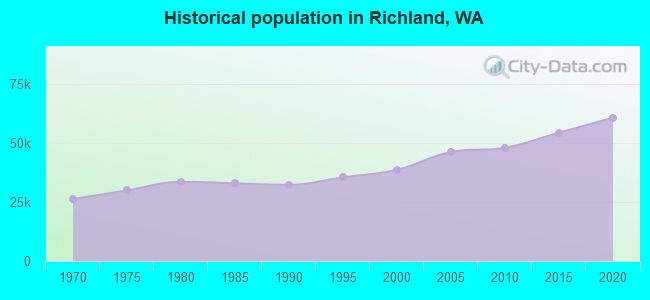
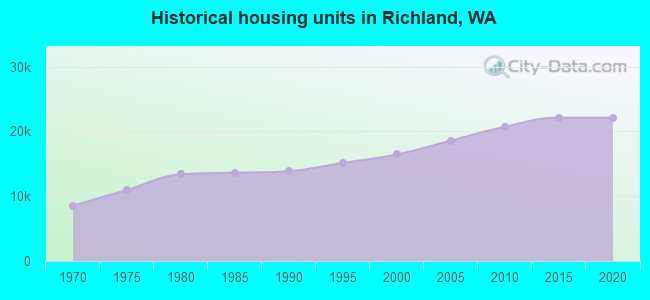
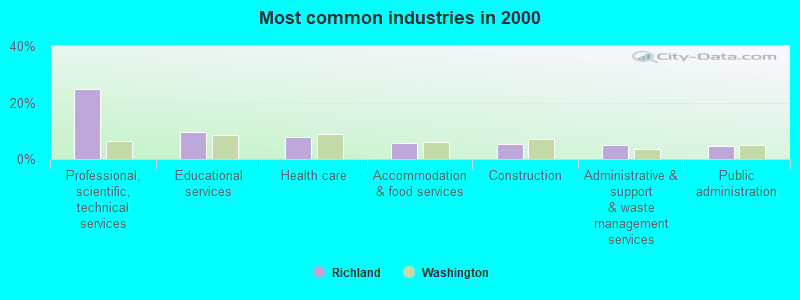
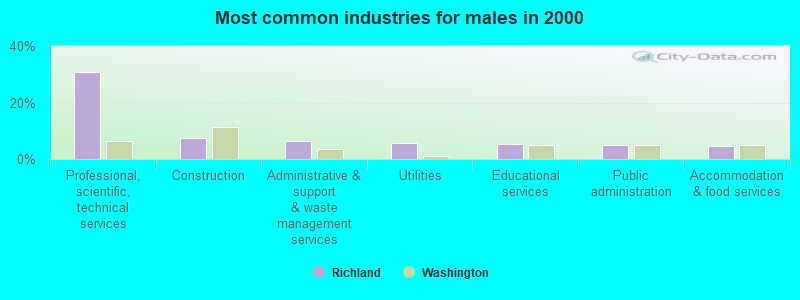
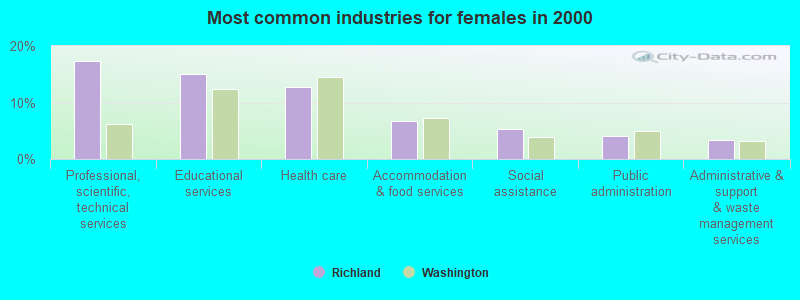
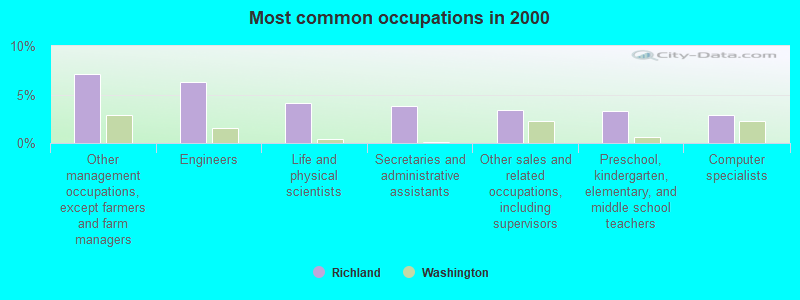
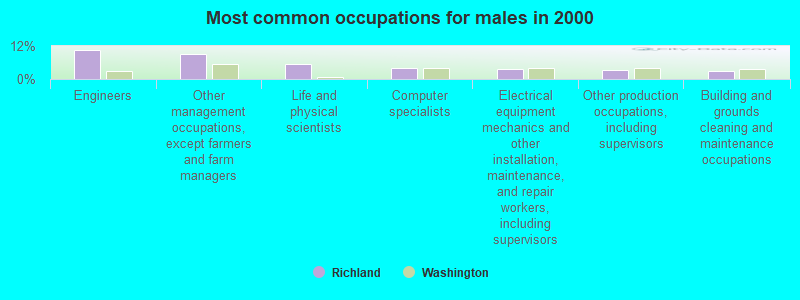
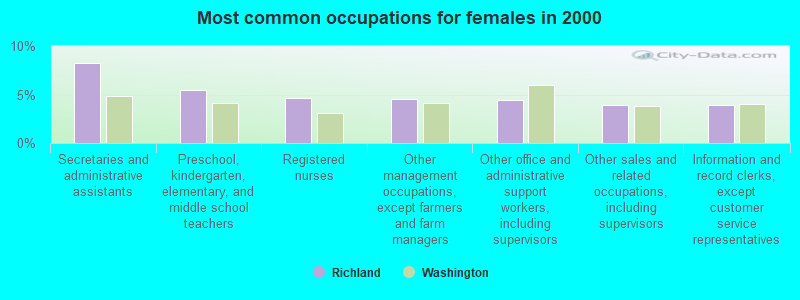

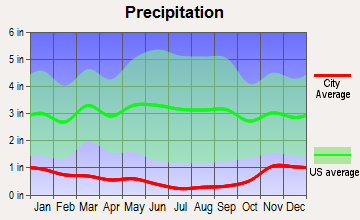
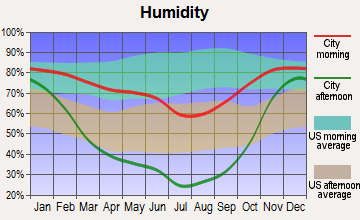
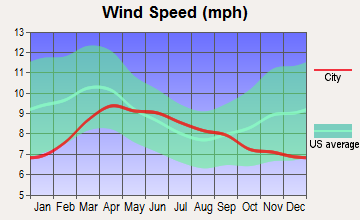
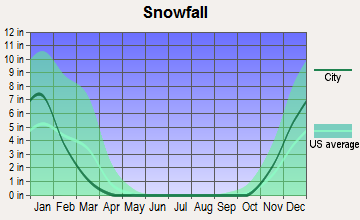
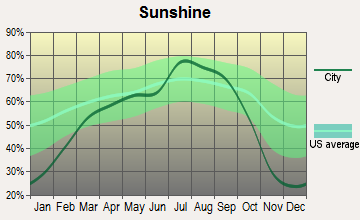
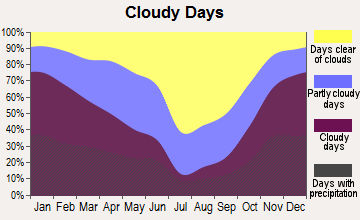
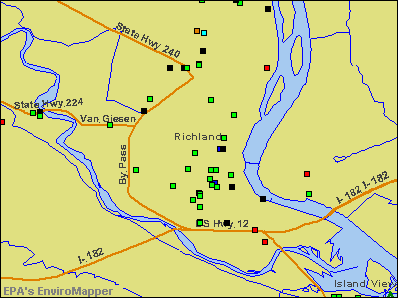

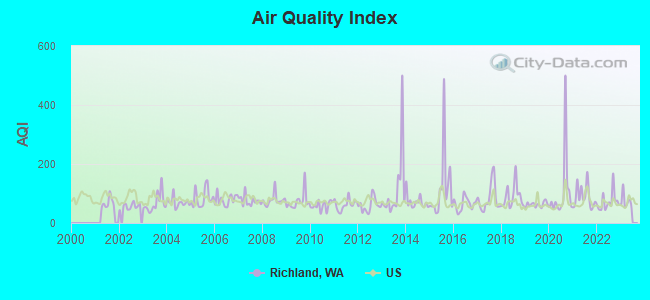
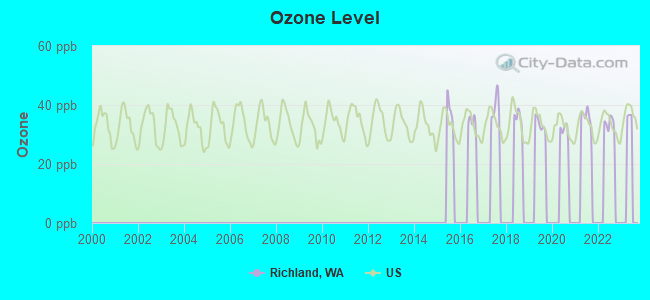
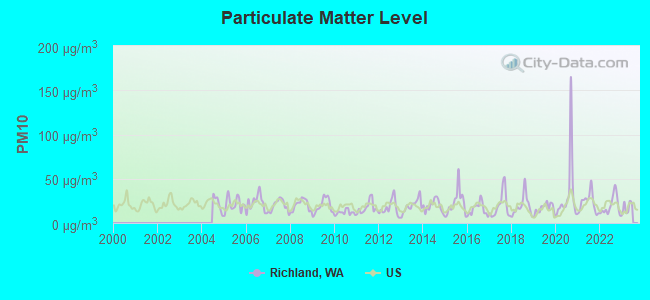
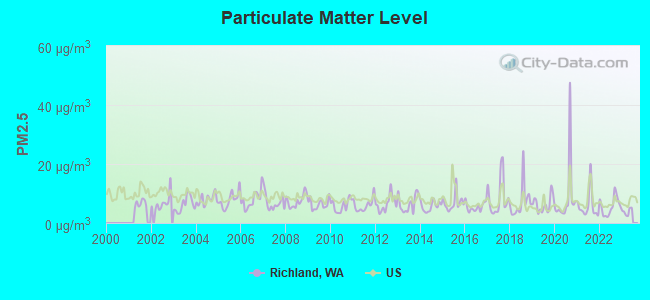
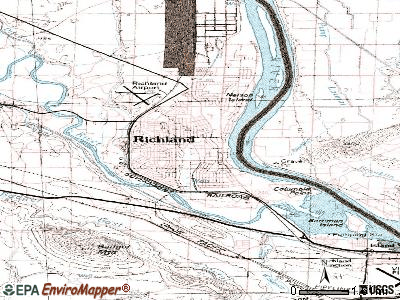
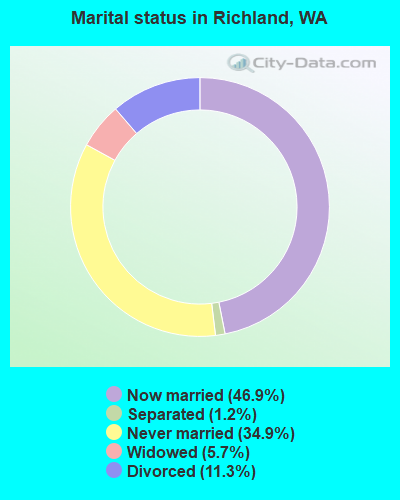
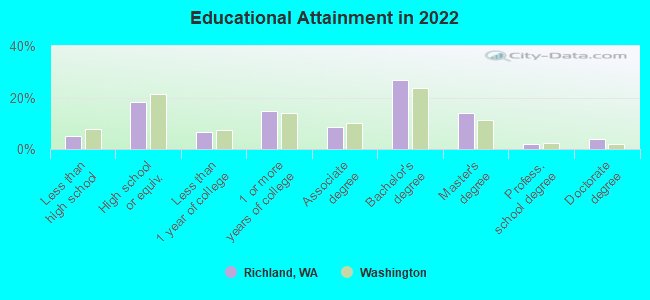
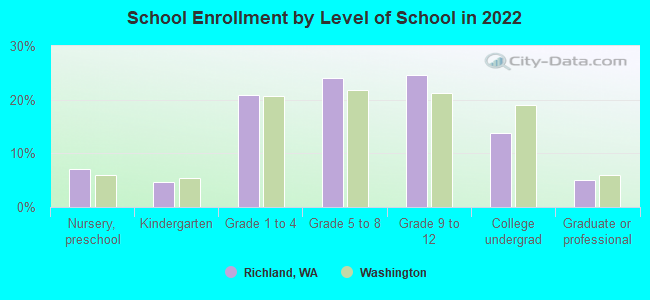
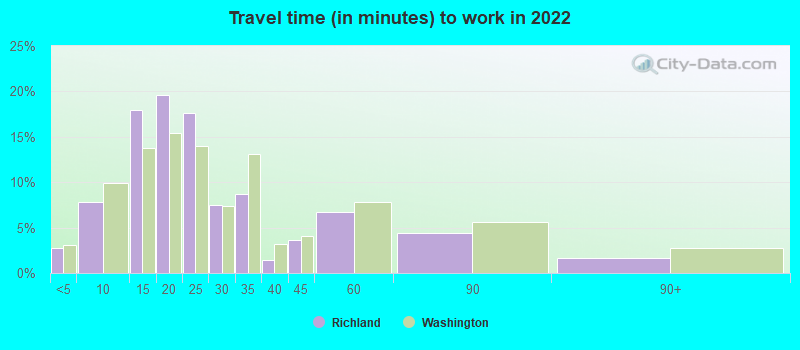
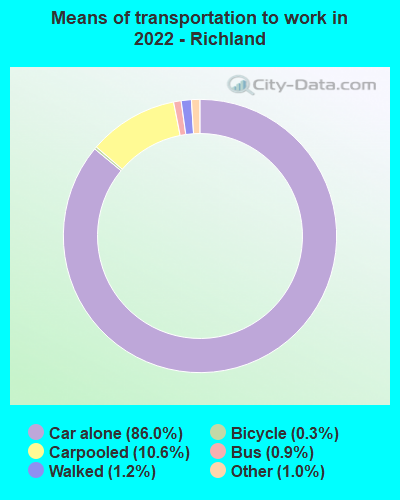
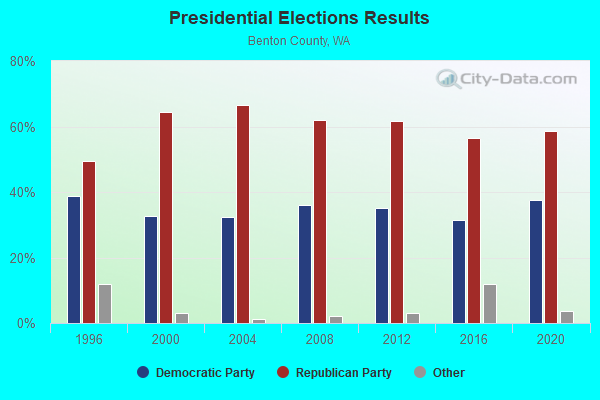
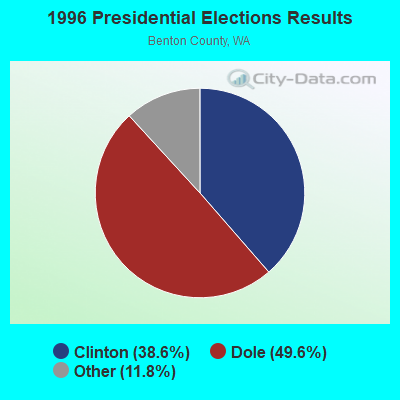
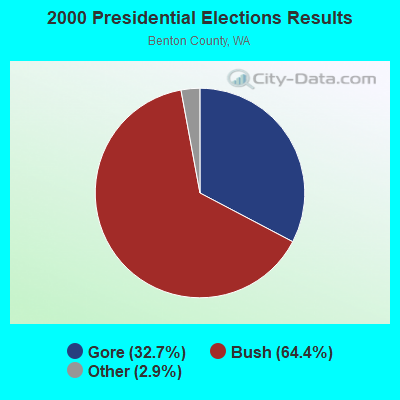
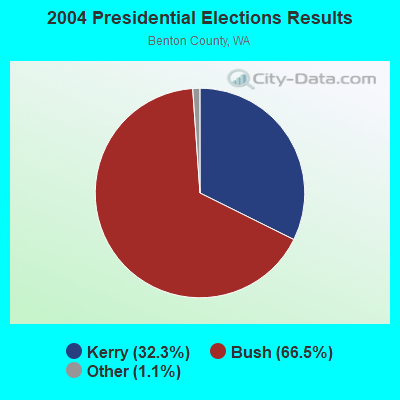

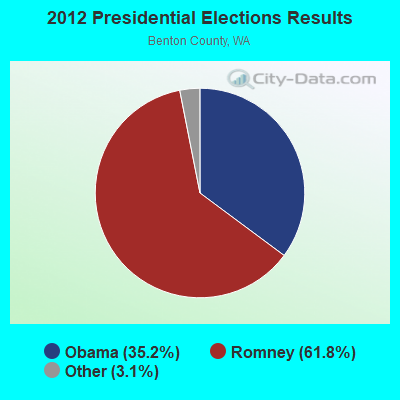
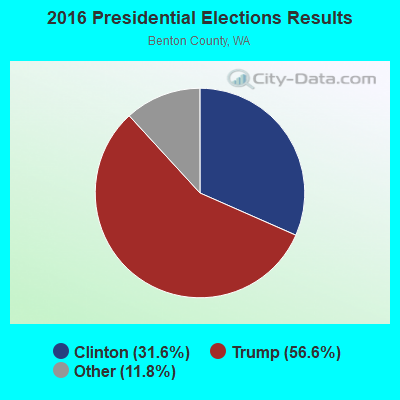
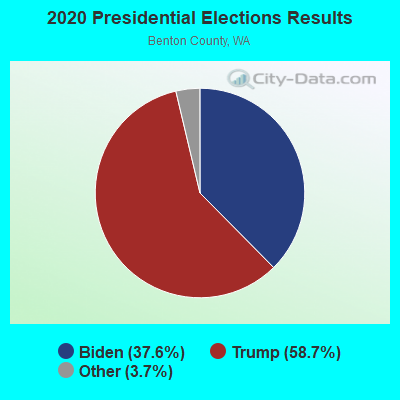
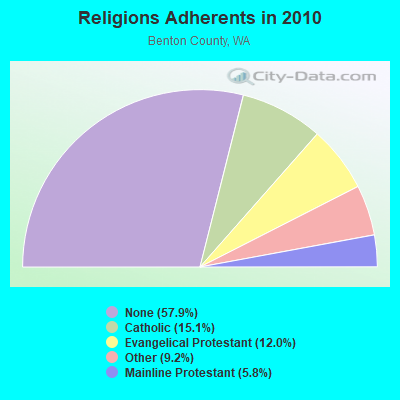
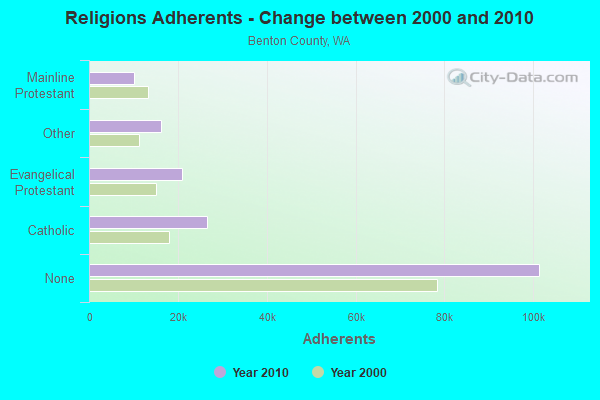
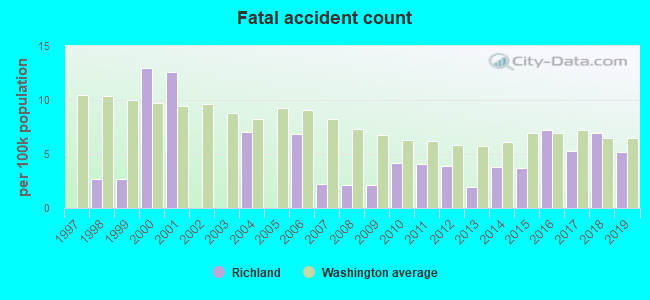
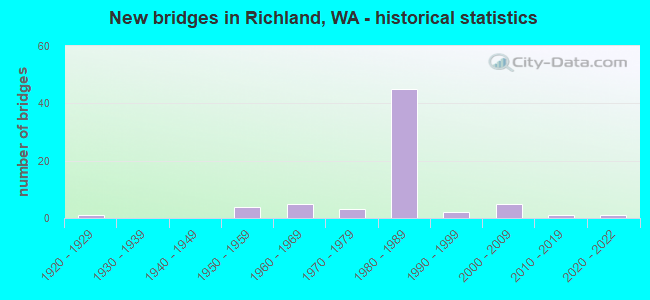
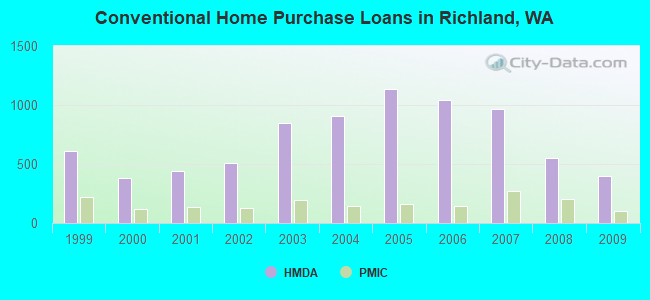
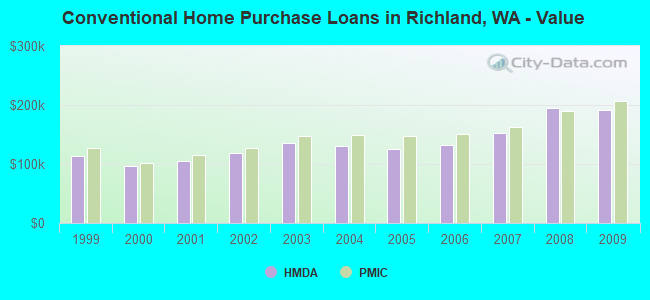
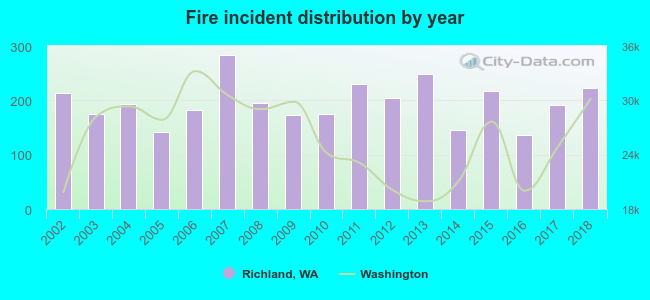 Based on the data from the years 2002 - 2018 the average number of fire incidents per year is 196. The highest number of fire incidents - 284 took place in 2007, and the least - 136 in 2016. The data has a rising trend.
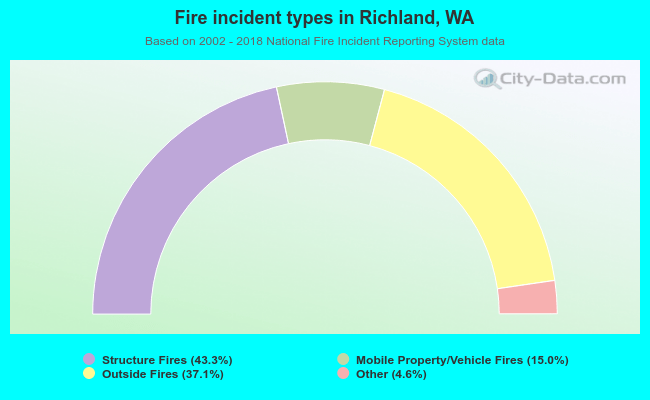 When looking into fire subcategories, the most reports belonged to: Structure Fires (43.3%), and Outside Fires (37.1%).