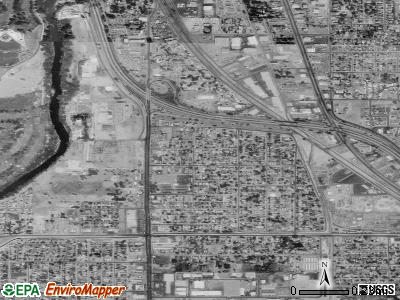
Shackelford, California
Submit your own pictures of this place and show them to the world
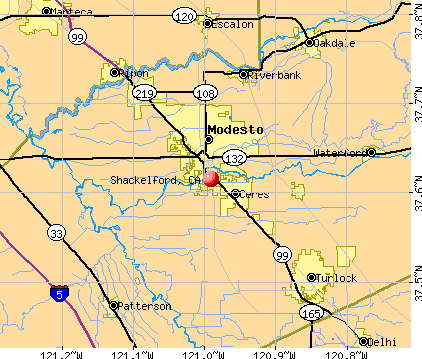
- OSM Map
- General Map
- Google Map
- MSN Map
Population change since 2000: -34.8%
| Males: 1,674 | |
| Females: 1,697 |
| Median resident age: | 32.1 years |
| California median age: | 37.9 years |
Zip codes: 95351.
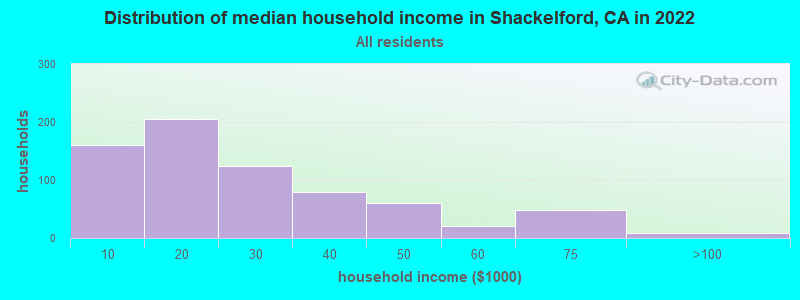
| Shackelford: | $44,071 |
| CA: | $91,551 |
Estimated per capita income in 2022: $13,785 (it was $7,250 in 2000)
Shackelford CDP income, earnings, and wages data
Estimated median house or condo value in 2022: $252,814 (it was $69,500 in 2000)
| Shackelford: | $252,814 |
| CA: | $715,900 |
Mean prices in 2022: all housing units: $478,509; detached houses: $501,424; townhouses or other attached units: $500,788; in 2-unit structures: $198,001; in 3-to-4-unit structures: $288,987; in 5-or-more-unit structures: $707,222; mobile homes: $105,610; occupied boats, rvs, vans, etc.: $87,411
Median gross rent in 2022: $1,152.
(62.5% for White Non-Hispanic residents, 100.0% for Black residents, 58.2% for Hispanic or Latino residents, 19.0% for American Indian residents, 54.3% for other race residents, 52.0% for two or more races residents)
Detailed information about poverty and poor residents in Shackelford, CA


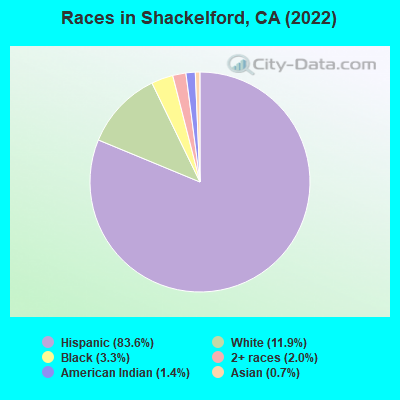
- 3,14783.6%Hispanic
- 44811.9%White alone
- 1263.3%Black alone
- 762.0%Two or more races
- 531.4%American Indian alone
- 270.7%Asian alone
 Recent articles from our blog. Our writers, many of them Ph.D. graduates or candidates, create easy-to-read articles on a wide variety of topics.

 | Nonwhite youth population growing in California and nation, report finds (30 replies) |
Latest news from Shackelford, CA collected exclusively by city-data.com from local newspapers, TV, and radio stations
Ancestries: American (6.4%), English (1.6%).
Current Local Time: PST time zone
Elevation: 82 feet
Land area: 0.85 square miles.
Population density: 3,982 people per square mile (average).
1,271 residents are foreign born (32.9% Latin America).
| This place: | 33.8% |
| California: | 100.0% |
Median real estate property taxes paid for housing units with mortgages in 2022: $1,585 (1.1%)
Median real estate property taxes paid for housing units with no mortgage in 2022: $1,054 (2.3%)
Nearest city with pop. 50,000+: Modesto, CA  (3.2 miles , pop. 188,856).
Nearest city with pop. 200,000+: Stockton, CA (30.1 miles , pop. 243,771).
Nearest city with pop. 1,000,000+: Los Angeles, CA (284.7 miles , pop. 3,694,820).
Nearest cities:
), ), ), ), ), ), )Latitude: 37.62 N, Longitude: 120.99 W
| Here: | 6.9% |
| California: | 5.1% |
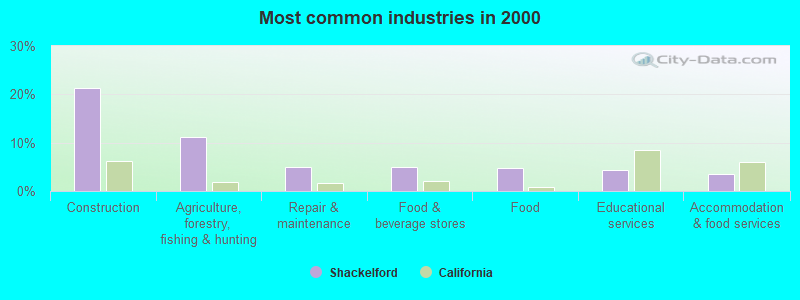
- Construction (21.3%)
- Agriculture, forestry, fishing & hunting (11.2%)
- Repair & maintenance (5.0%)
- Food & beverage stores (4.9%)
- Food (4.8%)
- Educational services (4.4%)
- Accommodation & food services (3.5%)
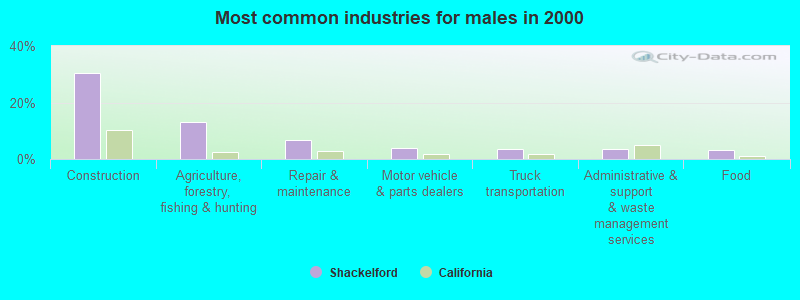
- Construction (30.4%)
- Agriculture, forestry, fishing & hunting (13.1%)
- Repair & maintenance (6.7%)
- Motor vehicle & parts dealers (3.8%)
- Truck transportation (3.7%)
- Administrative & support & waste management services (3.6%)
- Food (3.1%)
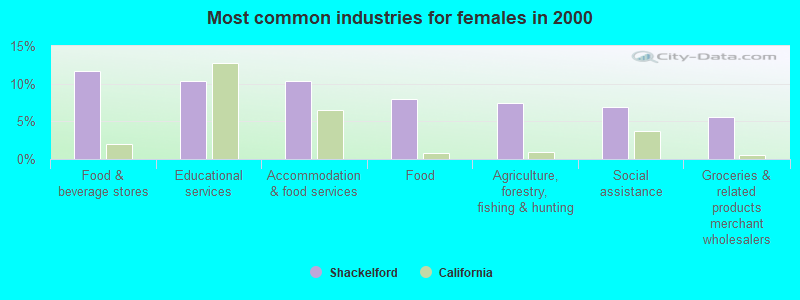
- Food & beverage stores (11.6%)
- Educational services (10.3%)
- Accommodation & food services (10.3%)
- Food (7.9%)
- Agriculture, forestry, fishing & hunting (7.4%)
- Social assistance (6.9%)
- Groceries & related products merchant wholesalers (5.6%)
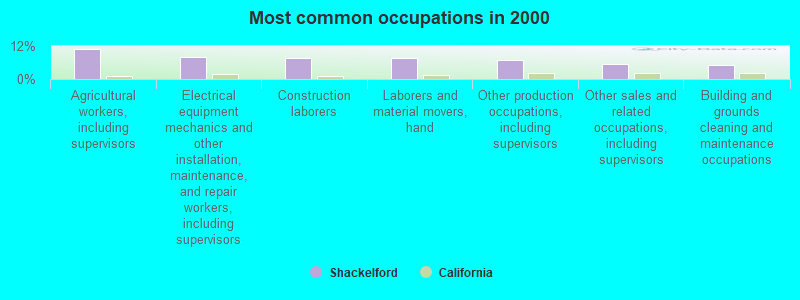
- Agricultural workers, including supervisors (10.8%)
- Electrical equipment mechanics and other installation, maintenance, and repair workers, including supervisors (8.1%)
- Construction laborers (7.7%)
- Laborers and material movers, hand (7.5%)
- Other production occupations, including supervisors (6.9%)
- Other sales and related occupations, including supervisors (5.4%)
- Building and grounds cleaning and maintenance occupations (5.2%)
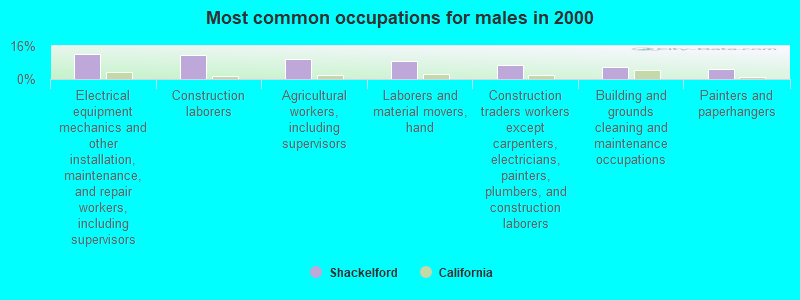
- Electrical equipment mechanics and other installation, maintenance, and repair workers, including supervisors (12.3%)
- Construction laborers (11.6%)
- Agricultural workers, including supervisors (9.7%)
- Laborers and material movers, hand (8.8%)
- Construction traders workers except carpenters, electricians, painters, plumbers, and construction laborers (6.6%)
- Building and grounds cleaning and maintenance occupations (6.0%)
- Painters and paperhangers (5.1%)
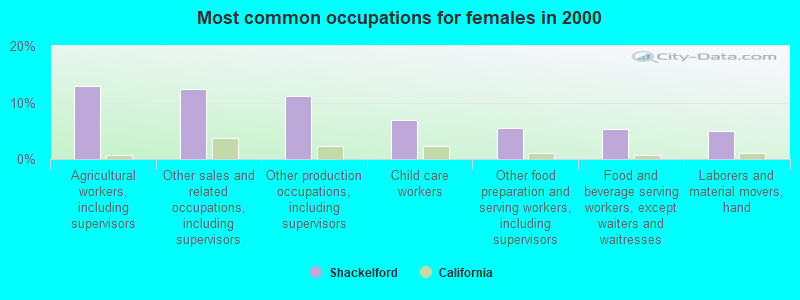
- Agricultural workers, including supervisors (13.0%)
- Other sales and related occupations, including supervisors (12.4%)
- Other production occupations, including supervisors (11.1%)
- Child care workers (6.9%)
- Other food preparation and serving workers, including supervisors (5.6%)
- Food and beverage serving workers, except waiters and waitresses (5.3%)
- Laborers and material movers, hand (5.0%)
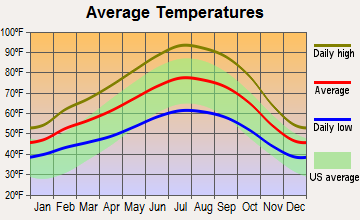
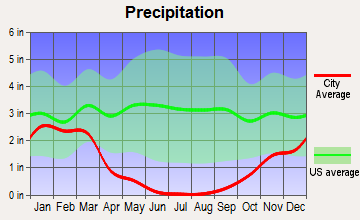
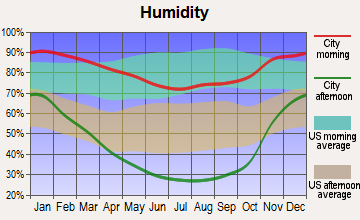
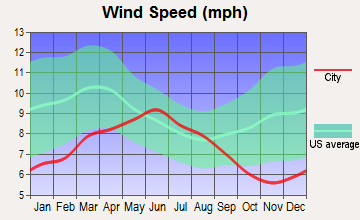
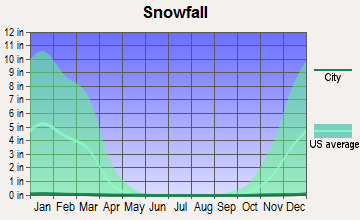
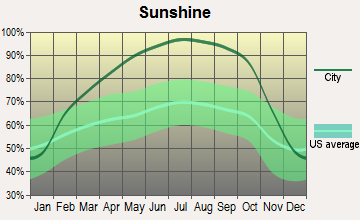
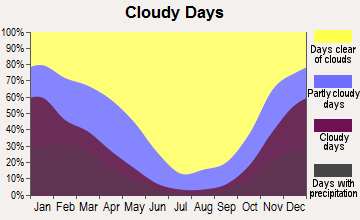
Average climate in Shackelford, California
Based on data reported by over 4,000 weather stations
(lower is better)
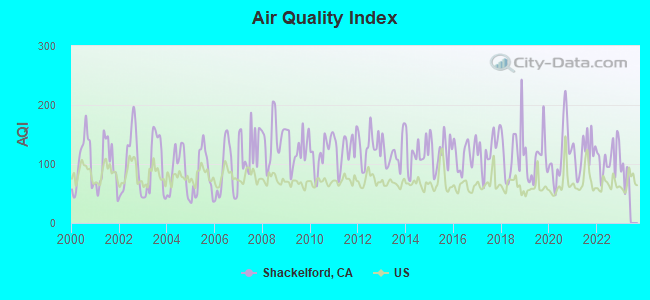
Air Quality Index (AQI) level in 2022 was 110. This is significantly worse than average.
| City: | 110 |
| U.S.: | 73 |
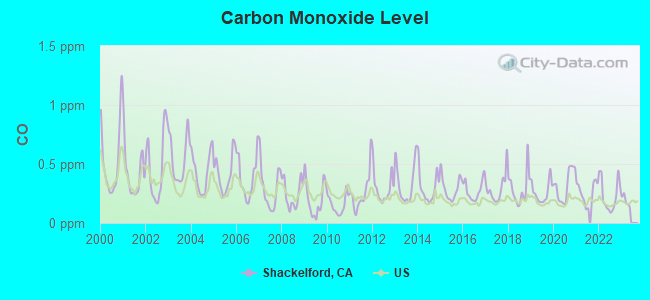
Carbon Monoxide (CO) [ppm] level in 2022 was 0.234. This is about average. Closest monitor was 1.8 miles away from the city center.
| City: | 0.234 |
| U.S.: | 0.251 |
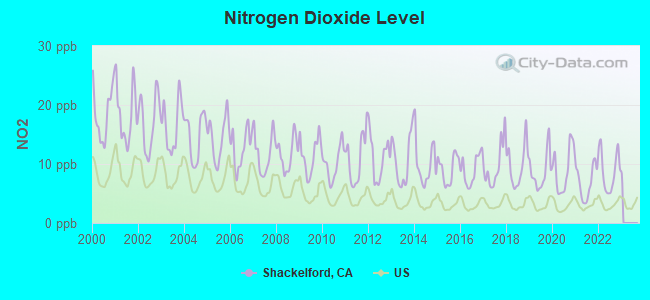
Nitrogen Dioxide (NO2) [ppb] level in 2022 was 8.79. This is significantly worse than average. Closest monitor was 1.8 miles away from the city center.
| City: | 8.79 |
| U.S.: | 5.11 |
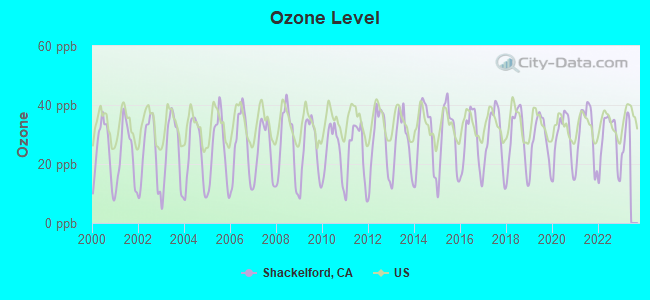
Ozone [ppb] level in 2022 was 28.0. This is about average. Closest monitor was 1.8 miles away from the city center.
| City: | 28.0 |
| U.S.: | 33.3 |
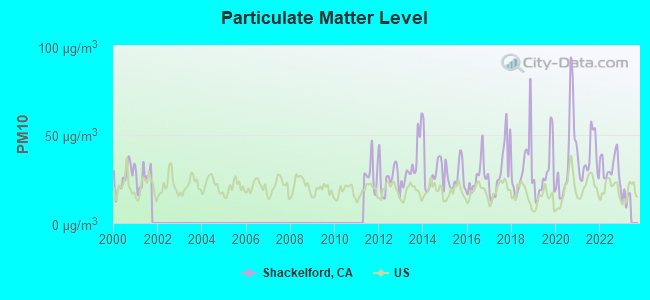
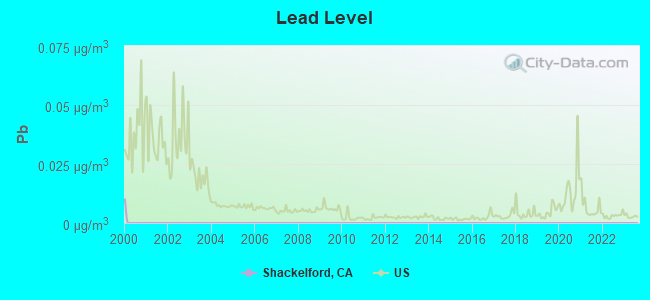
Particulate Matter (PM10) [µg/m3] level in 2022 was 31.5. This is significantly worse than average. Closest monitor was 1.8 miles away from the city center.
| City: | 31.5 |
| U.S.: | 19.2 |
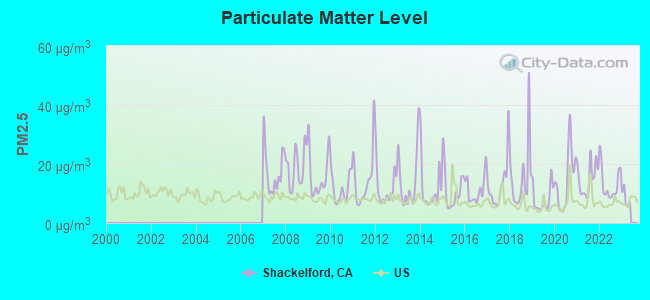
Particulate Matter (PM2.5) [µg/m3] level in 2022 was 13.4. This is significantly worse than average. Closest monitor was 1.9 miles away from the city center.
| City: | 13.4 |
| U.S.: | 8.1 |
Earthquake activity:
Shackelford-area historical earthquake activity is significantly above California state average. It is 8132% greater than the overall U.S. average.On 4/18/1906 at 13:12:21, a magnitude 7.9 (7.9 UK, Class: Major, Intensity: VIII - XII) earthquake occurred 113.0 miles away from Shackelford center, causing $524,000,000 total damage
On 10/18/1989 at 00:04:15, a magnitude 7.1 (6.5 MB, 7.1 MS, 6.9 MW, 7.0 ML) earthquake occurred 55.3 miles away from the city center, causing 62 deaths (62 shaking deaths) and 3757 injuries, causing $1,305,032,704 total damage
On 7/21/1952 at 11:52:14, a magnitude 7.7 (7.7 UK) earthquake occurred 212.2 miles away from Shackelford center, causing $50,000,000 total damage
On 11/4/1927 at 13:51:53, a magnitude 7.5 (7.5 UK) earthquake occurred 186.8 miles away from Shackelford center
On 12/21/1932 at 06:10:09, a magnitude 7.2 (7.2 UK) earthquake occurred 170.0 miles away from Shackelford center
On 10/3/1915 at 06:52:48, a magnitude 7.6 (7.6 UK) earthquake occurred 273.8 miles away from the city center
Magnitude types: body-wave magnitude (MB), local magnitude (ML), surface-wave magnitude (MS), moment magnitude (MW)
Natural disasters:
The number of natural disasters in Stanislaus County (13) is near the US average (15).Major Disasters (Presidential) Declared: 8
Emergencies Declared: 2
Causes of natural disasters: Floods: 8, Storms: 4, Winter Storms: 3, Landslides: 2, Mudslides: 2, Drought: 1, Fire: 1, Freeze: 1, Heavy Rain: 1, Hurricane: 1, Tornado: 1, Other: 1 (Note: some incidents may be assigned to more than one category).
Hospitals and medical centers near Shackelford:
- HA-LE ALOHA CONVALESCENT HOSPITAL (Nursing Home, about 2 miles away; CERES, CA)
- GLOBAL HEALTHCARE SERVICES, LLC (Home Health Center, about 3 miles away; MODESTO, CA)
- KINDRED HOSPITAL MODESTO (Hospital, about 3 miles away; MODESTO, CA)
- MODESTO REHABILITATION HOSPITAL (Nursing Home, about 3 miles away; MODESTO, CA)
- SATELLITE DIALYSIS - CENTRAL MODESTO (Dialysis Facility, about 3 miles away; MODESTO, CA)
- STANISLAUS MEDICAL CENTER (Hospital, about 3 miles away; MODESTO, CA)
- CERES DIALYSIS CENTER (Dialysis Facility, about 3 miles away; CERES, CA)
Amtrak stations near Shackelford:
- 6 miles: MODESTO (1700 HELD DRIVE) . Services: ticket office, fully wheelchair accessible, enclosed waiting area, public restrooms, public payphones, vending machines, free short-term parking, free long-term parking, call for car rental service, call for taxi service, public transit connection.
- 13 miles: TURLOCK-DENAIR (DENAIR, SANTA FE ST. AT ELM ST.) . Services: fully wheelchair accessible, public payphones, vending machines, free short-term parking, free long-term parking, call for taxi service.
Colleges/universities with over 2000 students nearest to Shackelford:
- Modesto Junior College (about 3 miles; Modesto, CA; Full-time enrollment: 10,635)
- California State University-Stanislaus (about 10 miles; Turlock, CA; FT enrollment: 7,054)
- University of the Pacific (about 31 miles; Stockton, CA; FT enrollment: 4,999)
- San Joaquin Delta College (about 32 miles; Stockton, CA; FT enrollment: 12,167)
- Merced College (about 35 miles; Merced, CA; FT enrollment: 6,973)
- University of California-Merced (about 36 miles; Merced, CA; FT enrollment: 5,981)
- Las Positas College (about 46 miles; Livermore, CA; FT enrollment: 5,112)
Points of interest:
| This place: | 3.8 people |
| California: | 2.9 people |
| This place: | 78.3% |
| Whole state: | 68.7% |
| This place: | 14.1% |
| Whole state: | 7.2% |
Likely homosexual households (counted as self-reported same-sex unmarried-partner households)
- Lesbian couples: 0.9% of all households
- Gay men: 0.0% of all households
For population 15 years and over in Shackelford:
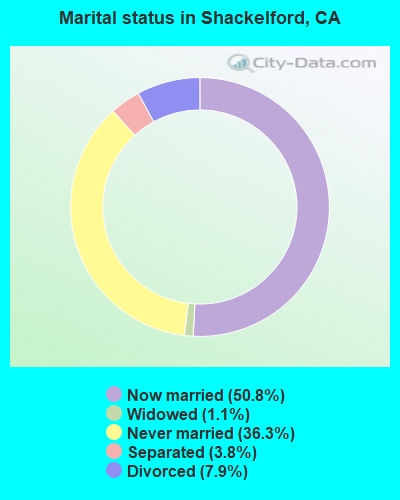
- Never married: 36.3%
- Now married: 50.8%
- Separated: 3.8%
- Widowed: 1.1%
- Divorced: 7.9%
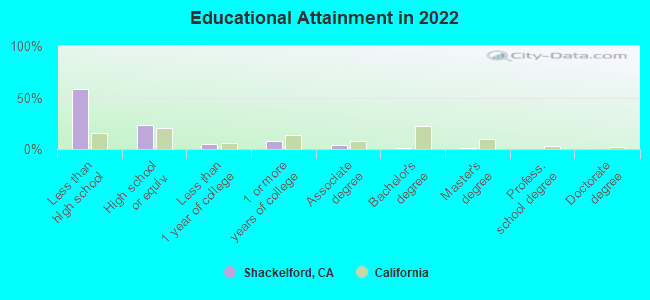
For population 25 years and over in Shackelford:
- High school or higher: 36.0%
- Bachelor's degree or higher: 1.6%
- Graduate or professional degree: 0.7%
- Unemployed: 34.2%
- Mean travel time to work (commute): 29.1 minutes
| Here: | 29.6 |
| California average: | 15.5 |
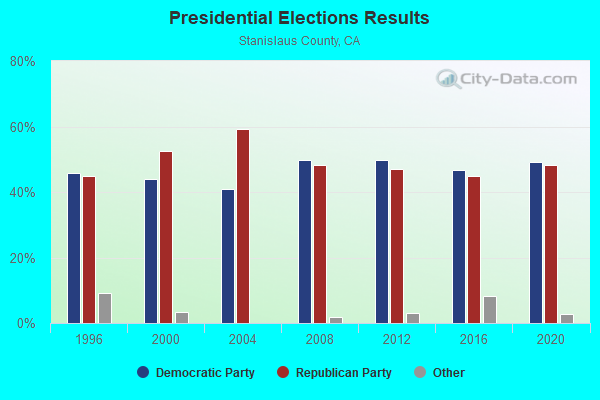
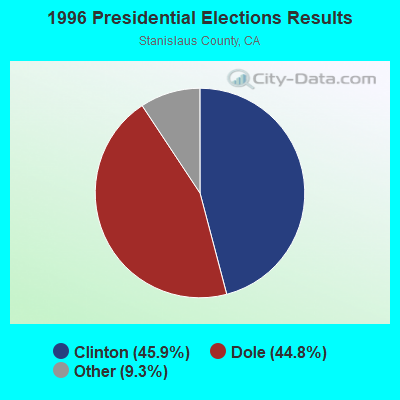
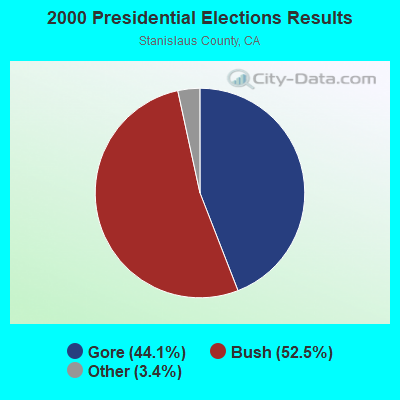
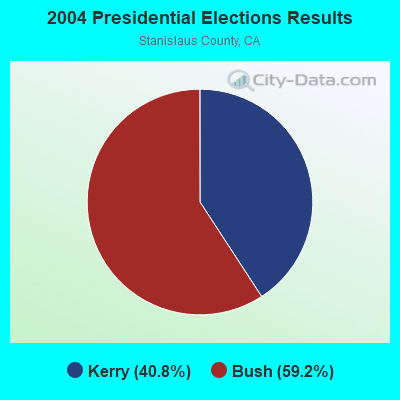
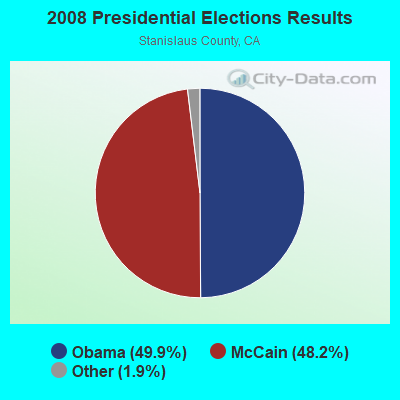
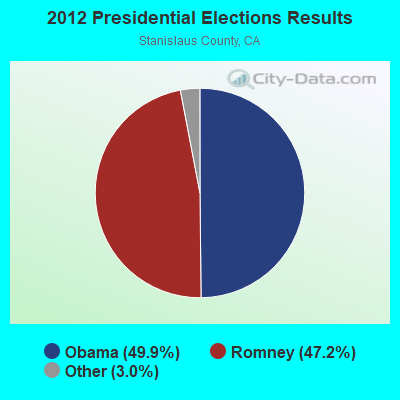

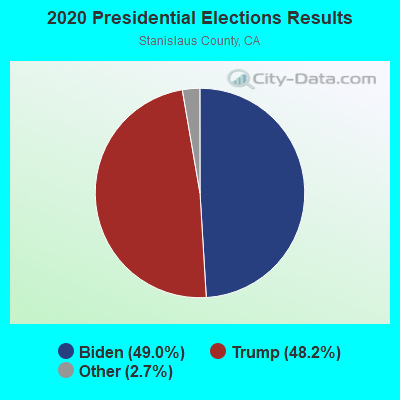
Graphs represent county-level data. Detailed 2008 Election Results
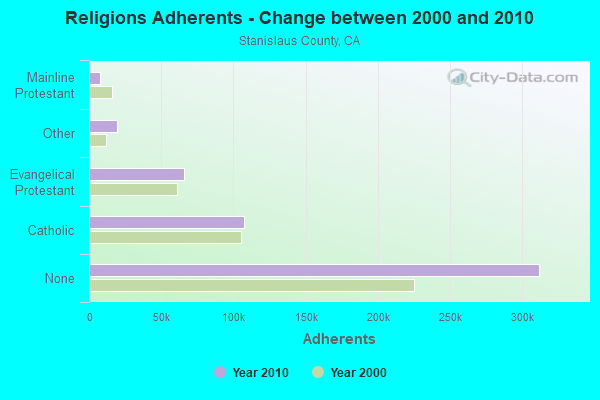
Religion statistics for Shackelford, CA (based on Stanislaus County data)
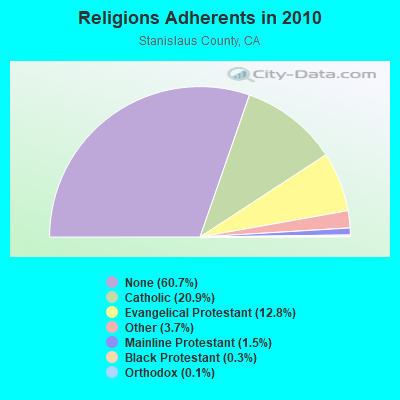
| Religion | Adherents | Congregations |
|---|---|---|
| Catholic | 107,529 | 18 |
| Evangelical Protestant | 65,976 | 268 |
| Other | 19,198 | 59 |
| Mainline Protestant | 7,730 | 34 |
| Black Protestant | 1,312 | 8 |
| Orthodox | 625 | 2 |
| None | 312,083 | - |
Food Environment Statistics:
| Stanislaus County: | 2.61 / 10,000 pop. |
| California: | 2.14 / 10,000 pop. |
| Here: | 0.04 / 10,000 pop. |
| California: | 0.04 / 10,000 pop. |
| Stanislaus County: | 0.65 / 10,000 pop. |
| California: | 0.62 / 10,000 pop. |
| Stanislaus County: | 2.22 / 10,000 pop. |
| California: | 1.49 / 10,000 pop. |
| This county: | 5.54 / 10,000 pop. |
| California: | 7.42 / 10,000 pop. |
| Stanislaus County: | 8.9% |
| California: | 7.3% |
| Stanislaus County: | 28.0% |
| California: | 21.3% |
| This county: | 17.1% |
| California: | 17.9% |
5.00% of this county's 2021 resident taxpayers lived in other counties in 2020 ($56,165 average adjusted gross income)
| Here: | 5.00% |
| California average: | 5.19% |
0.01% of residents moved from foreign countries ($94 average AGI)
Stanislaus County: 0.01% California average: 0.03%
Top counties from which taxpayers relocated into this county between 2020 and 2021:
| from San Joaquin County, CA | |
| from Alameda County, CA | |
| from Santa Clara County, CA |
5.39% of this county's 2020 resident taxpayers moved to other counties in 2021 ($61,321 average adjusted gross income)
| Here: | 5.39% |
| California average: | 6.14% |
0.01% of residents moved to foreign countries ($87 average AGI)
Stanislaus County: 0.01% California average: 0.02%
Top counties to which taxpayers relocated from this county between 2020 and 2021:
| to San Joaquin County, CA | |
| to Merced County, CA | |
| to Sacramento County, CA |
Strongest AM radio stations in Shackelford:
- KCBC (770 AM; 50 kW; RIVERBANK, CA; Owner: KIERTRON, INC.)
- KFIV (1360 AM; 4 kW; MODESTO, CA; Owner: CAPSTAR TX LIMITED PARTNERSHIP)
- KESP (970 AM; 1 kW; MODESTO, CA; Owner: CITADEL BROADCASTING COMPANY)
- KLOK (1170 AM; 50 kW; SAN JOSE, CA; Owner: ENTRAVISION HOLDINGS, LLC)
- KGO (810 AM; 50 kW; SAN FRANCISCO, CA; Owner: KGO-AM RADIO, INC.)
- KVIN (920 AM; 2 kW; CERES, CA; Owner: THRESHOLD COMMUNICATIONS)
- KNBR (680 AM; 50 kW; SAN FRANCISCO, CA; Owner: KNBR LICO, INC.)
- KHTK (1140 AM; 50 kW; SACRAMENTO, CA; Owner: INFINITY RADIO SUBSIDIARY OPERATIONS INC.)
- KLOC (1390 AM; 5 kW; TURLOCK, CA)
- KTCT (1050 AM; 50 kW; SAN MATEO, CA; Owner: SUSQUEHANNA RADIO CORP.)
- KFAX (1100 AM; 50 kW; SAN FRANCISCO, CA; Owner: GOLDEN GATE BROADCASTING CO, INC.)
- KTRB (860 AM; 50 kW; MODESTO, CA; Owner: PAPPAS RADIO OF CALIFORNIA, A CALIFORNIA LIMITED PARTNERSHIP)
- KSTE (650 AM; 25 kW; RANCHO CORDOVA, CA; Owner: AMFM RADIO LICENSES, L.L.C.)
Strongest FM radio stations in Shackelford:
- KEJC (93.9 FM; MODESTO, CA; Owner: MODESTO COMMUNICATIONS CORPORATION)
- K258AB (99.5 FM; MODESTO, CA; Owner: EDUCATIONAL MEDIA FOUNDATION)
- KADV (90.5 FM; MODESTO, CA; Owner: MODESTO ADVENTIST ACADEMY)
- KOSO (93.1 FM; PATTERSON, CA; Owner: CAPSTAR TX LIMITED PARTNERSHIP)
- K238AC (95.5 FM; SALIDA, CA; Owner: FAMILY STATIONS, INC.)
- KUOP (91.3 FM; STOCKTON, CA; Owner: UNIVERSITY OF THE PACIFIC)
- KJSN (102.3 FM; MODESTO, CA; Owner: CAPSTAR TX LIMITED PARTNERSHIP)
- KWNN (98.3 FM; TURLOCK, CA; Owner: SILVERADO BROADCASTING COMPANY)
- KHOP (95.1 FM; OAKDALE, CA; Owner: CITADEL BROADCASTING COMPANY)
- KJOY (99.3 FM; STOCKTON, CA; Owner: CITADEL BROADCASTING COMPANY)
- KKSF-FM1 (103.7 FM; PLEASANTON, ETC., CA; Owner: AMFM RADIO LICENSES, L.L.C.)
- KHTN (104.7 FM; LOS BANOS, CA; Owner: BUCKLEY COMMUNICATIONS, INC.)
- KFRC-FM3 (99.7 FM; WALNUT CREEK, CA; Owner: INFINITY KFRC-FM, INC.)
- KZBR-FM1 (95.7 FM; WALNUT CREEK, CA; Owner: BONNEVILLE HOLDING COMPANY)
- KBLX-FM2 (102.9 FM; PLEASANTON, CA; Owner: ICBC BROADCAST HOLDINGS -CA, INC.)
- KSOL-FM3 (98.9 FM; PLEASANTON, CA; Owner: TMS LICENSE CALIFORNIA, INC)
- KISQ-FM3 (98.1 FM; CONCORD, CA; Owner: AMFM RADIO LICENSES, L.L.C.)
- KMRQ (96.7 FM; MANTECA, CA; Owner: CAPSTAR TX LIMITED PARTNERSHIP)
- KMEL-FM1 (106.1 FM; CONCORD, CA; Owner: AMFM RADIO LICENSES, L.L.C.)
- KBAA (94.5 FM; GILROY, CA; Owner: INFINITY RADIO OPERATIONS INC.)
TV broadcast stations around Shackelford:
- KBSV (Channel 23; CERES, CA; Owner: BET-NAHRAIN, INC.)
- KACA-LP (Channel 61; MODESTO, CA; Owner: WORD OF GOD FELLOWSHIP, INC.)
- KOVR (Channel 13; STOCKTON, CA; Owner: SCI - SACRAMENTO LICENSEE, LLC)
- KXTV (Channel 10; SACRAMENTO, CA; Owner: KXTV, INC.)
- KUVS (Channel 19; MODESTO, CA; Owner: KUVS LICENSE PARTNERSHIP, G.P.)
- KCRA-TV (Channel 3; SACRAMENTO, CA; Owner: KCRA HEARST-ARGYLE TELEVISION, INC.)
- KSPX (Channel 29; SACRAMENTO, CA; Owner: PAXSON SACRAMENTO LICENSE, INC.)
- KQCA (Channel 58; STOCKTON, CA; Owner: KCRA HEARST-ARGYLE TELEVISION, INC.)
- KTXL (Channel 40; SACRAMENTO, CA; Owner: CHANNEL 40, INC.)
- KMAX-TV (Channel 31; SACRAMENTO, CA; Owner: UPN STATIONS GROUP INC.)
- KVIE (Channel 6; SACRAMENTO, CA; Owner: KVIE, INC.)
- National Bridge Inventory (NBI) Statistics
- 5Number of bridges
- 102ft / 31.2mTotal length
- $1,548,000Total costs
- 176,700Total average daily traffic
- 19,476Total average daily truck traffic
| Home Mortgage Disclosure Act Aggregated Statistics For Year 2009 (Based on 2 partial tracts) | ||||||||||
| A) FHA, FSA/RHS & VA Home Purchase Loans | B) Conventional Home Purchase Loans | C) Refinancings | D) Home Improvement Loans | F) Non-occupant Loans on < 5 Family Dwellings (A B C & D) | ||||||
|---|---|---|---|---|---|---|---|---|---|---|
| Number | Average Value | Number | Average Value | Number | Average Value | Number | Average Value | Number | Average Value | |
| LOANS ORIGINATED | 48 | $123,139 | 21 | $91,123 | 12 | $154,952 | 0 | $0 | 10 | $91,919 |
| APPLICATIONS APPROVED, NOT ACCEPTED | 2 | $130,495 | 3 | $116,597 | 2 | $123,285 | 0 | $0 | 0 | $0 |
| APPLICATIONS DENIED | 13 | $110,985 | 11 | $98,988 | 10 | $145,258 | 1 | $49,950 | 5 | $87,222 |
| APPLICATIONS WITHDRAWN | 9 | $118,887 | 1 | $102,640 | 7 | $144,104 | 0 | $0 | 1 | $98,330 |
| FILES CLOSED FOR INCOMPLETENESS | 1 | $201,110 | 0 | $0 | 2 | $199,735 | 0 | $0 | 1 | $50,940 |
Detailed HMDA statistics for the following Tracts: 0023.01 , 0025.01
| Private Mortgage Insurance Companies Aggregated Statistics For Year 2009 (Based on 2 partial tracts) | ||
| A) Conventional Home Purchase Loans | ||
|---|---|---|
| Number | Average Value | |
| LOANS ORIGINATED | 4 | $97,600 |
| APPLICATIONS APPROVED, NOT ACCEPTED | 1 | $185,870 |
| APPLICATIONS DENIED | 1 | $69,190 |
| APPLICATIONS WITHDRAWN | 0 | $0 |
| FILES CLOSED FOR INCOMPLETENESS | 0 | $0 |
Detailed PMIC statistics for the following Tracts: 0023.01 , 0025.01
- 51.8%Utility gas
- 16.1%No fuel used
- 15.5%Electricity
- 9.4%Other fuel
- 7.3%Wood
- 51.8%Utility gas
- 46.1%Electricity
- 2.0%Bottled, tank, or LP gas
Shackelford compared to California state average:
- Median household income below state average.
- Median house value significantly below state average.
- Unemployed percentage above state average.
- Black race population percentage below state average.
- Median age below state average.
- Length of stay since moving in significantly below state average.
- Number of rooms per house below state average.
- Number of college students significantly below state average.
- Percentage of population with a bachelor's degree or higher significantly below state average.