Ceres, California Submit your own pictures of this city and show them to the world
OSM Map
General Map
Google Map
MSN Map
OSM Map
General Map
Google Map
MSN Map
OSM Map
General Map
Google Map
MSN Map
OSM Map
General Map
Google Map
MSN Map
Please wait while loading the map...
Population in 2022: 48,988 (100% urban, 0% rural). Population change since 2000: +41.5%Males: 25,710 Females: 23,278
March 2022 cost of living index in Ceres: 99.4 (near average, U.S. average is 100) Percentage of residents living in poverty in 2022: 15.3%for White Non-Hispanic residents , 15.6% for Black residents , 15.2% for Hispanic or Latino residents , 1.7% for American Indian residents , 13.7% for Native Hawaiian and other Pacific Islander residents , 17.3% for other race residents , 17.1% for two or more races residents )
Profiles of local businesses
Business Search - 14 Million verified businesses
Data:
Median household income ($)
Median household income (% change since 2000)
Household income diversity
Ratio of average income to average house value (%)
Ratio of average income to average rent
Median household income ($) - White
Median household income ($) - Black or African American
Median household income ($) - Asian
Median household income ($) - Hispanic or Latino
Median household income ($) - American Indian and Alaska Native
Median household income ($) - Multirace
Median household income ($) - Other Race
Median household income for houses/condos with a mortgage ($)
Median household income for apartments without a mortgage ($)
Races - White alone (%)
Races - White alone (% change since 2000)
Races - Black alone (%)
Races - Black alone (% change since 2000)
Races - American Indian alone (%)
Races - American Indian alone (% change since 2000)
Races - Asian alone (%)
Races - Asian alone (% change since 2000)
Races - Hispanic (%)
Races - Hispanic (% change since 2000)
Races - Native Hawaiian and Other Pacific Islander alone (%)
Races - Native Hawaiian and Other Pacific Islander alone (% change since 2000)
Races - Two or more races (%)
Races - Two or more races (% change since 2000)
Races - Other race alone (%)
Races - Other race alone (% change since 2000)
Racial diversity
Unemployment (%)
Unemployment (% change since 2000)
Unemployment (%) - White
Unemployment (%) - Black or African American
Unemployment (%) - Asian
Unemployment (%) - Hispanic or Latino
Unemployment (%) - American Indian and Alaska Native
Unemployment (%) - Multirace
Unemployment (%) - Other Race
Population density (people per square mile)
Population - Males (%)
Population - Females (%)
Population - Males (%) - White
Population - Males (%) - Black or African American
Population - Males (%) - Asian
Population - Males (%) - Hispanic or Latino
Population - Males (%) - American Indian and Alaska Native
Population - Males (%) - Multirace
Population - Males (%) - Other Race
Population - Females (%) - White
Population - Females (%) - Black or African American
Population - Females (%) - Asian
Population - Females (%) - Hispanic or Latino
Population - Females (%) - American Indian and Alaska Native
Population - Females (%) - Multirace
Population - Females (%) - Other Race
Coronavirus confirmed cases (Apr 27, 2024)
Deaths caused by coronavirus (Apr 27, 2024)
Coronavirus confirmed cases (per 100k population) (Apr 27, 2024)
Deaths caused by coronavirus (per 100k population) (Apr 27, 2024)
Daily increase in number of cases (Apr 27, 2024)
Weekly increase in number of cases (Apr 27, 2024)
Cases doubled (in days) (Apr 27, 2024)
Hospitalized patients (Apr 18, 2022)
Negative test results (Apr 18, 2022)
Total test results (Apr 18, 2022)
COVID Vaccine doses distributed (per 100k population) (Sep 19, 2023)
COVID Vaccine doses administered (per 100k population) (Sep 19, 2023)
COVID Vaccine doses distributed (Sep 19, 2023)
COVID Vaccine doses administered (Sep 19, 2023)
Likely homosexual households (%)
Likely homosexual households (% change since 2000)
Likely homosexual households - Lesbian couples (%)
Likely homosexual households - Lesbian couples (% change since 2000)
Likely homosexual households - Gay men (%)
Likely homosexual households - Gay men (% change since 2000)
Cost of living index
Median gross rent ($)
Median contract rent ($)
Median monthly housing costs ($)
Median house or condo value ($)
Median house or condo value ($ change since 2000)
Mean house or condo value by units in structure - 1, detached ($)
Mean house or condo value by units in structure - 1, attached ($)
Mean house or condo value by units in structure - 2 ($)
Mean house or condo value by units in structure by units in structure - 3 or 4 ($)
Mean house or condo value by units in structure - 5 or more ($)
Mean house or condo value by units in structure - Boat, RV, van, etc. ($)
Mean house or condo value by units in structure - Mobile home ($)
Median house or condo value ($) - White
Median house or condo value ($) - Black or African American
Median house or condo value ($) - Asian
Median house or condo value ($) - Hispanic or Latino
Median house or condo value ($) - American Indian and Alaska Native
Median house or condo value ($) - Multirace
Median house or condo value ($) - Other Race
Median resident age
Resident age diversity
Median resident age - Males
Median resident age - Females
Median resident age - White
Median resident age - Black or African American
Median resident age - Asian
Median resident age - Hispanic or Latino
Median resident age - American Indian and Alaska Native
Median resident age - Multirace
Median resident age - Other Race
Median resident age - Males - White
Median resident age - Males - Black or African American
Median resident age - Males - Asian
Median resident age - Males - Hispanic or Latino
Median resident age - Males - American Indian and Alaska Native
Median resident age - Males - Multirace
Median resident age - Males - Other Race
Median resident age - Females - White
Median resident age - Females - Black or African American
Median resident age - Females - Asian
Median resident age - Females - Hispanic or Latino
Median resident age - Females - American Indian and Alaska Native
Median resident age - Females - Multirace
Median resident age - Females - Other Race
Commute - mean travel time to work (minutes)
Travel time to work - Less than 5 minutes (%)
Travel time to work - Less than 5 minutes (% change since 2000)
Travel time to work - 5 to 9 minutes (%)
Travel time to work - 5 to 9 minutes (% change since 2000)
Travel time to work - 10 to 19 minutes (%)
Travel time to work - 10 to 19 minutes (% change since 2000)
Travel time to work - 20 to 29 minutes (%)
Travel time to work - 20 to 29 minutes (% change since 2000)
Travel time to work - 30 to 39 minutes (%)
Travel time to work - 30 to 39 minutes (% change since 2000)
Travel time to work - 40 to 59 minutes (%)
Travel time to work - 40 to 59 minutes (% change since 2000)
Travel time to work - 60 to 89 minutes (%)
Travel time to work - 60 to 89 minutes (% change since 2000)
Travel time to work - 90 or more minutes (%)
Travel time to work - 90 or more minutes (% change since 2000)
Marital status - Never married (%)
Marital status - Now married (%)
Marital status - Separated (%)
Marital status - Widowed (%)
Marital status - Divorced (%)
Median family income ($)
Median family income (% change since 2000)
Median non-family income ($)
Median non-family income (% change since 2000)
Median per capita income ($)
Median per capita income (% change since 2000)
Median family income ($) - White
Median family income ($) - Black or African American
Median family income ($) - Asian
Median family income ($) - Hispanic or Latino
Median family income ($) - American Indian and Alaska Native
Median family income ($) - Multirace
Median family income ($) - Other Race
Median year house/condo built
Median year apartment built
Year house built - Built 2005 or later (%)
Year house built - Built 2000 to 2004 (%)
Year house built - Built 1990 to 1999 (%)
Year house built - Built 1980 to 1989 (%)
Year house built - Built 1970 to 1979 (%)
Year house built - Built 1960 to 1969 (%)
Year house built - Built 1950 to 1959 (%)
Year house built - Built 1940 to 1949 (%)
Year house built - Built 1939 or earlier (%)
Average household size
Household density (households per square mile)
Average household size - White
Average household size - Black or African American
Average household size - Asian
Average household size - Hispanic or Latino
Average household size - American Indian and Alaska Native
Average household size - Multirace
Average household size - Other Race
Occupied housing units (%)
Vacant housing units (%)
Owner occupied housing units (%)
Renter occupied housing units (%)
Vacancy status - For rent (%)
Vacancy status - For sale only (%)
Vacancy status - Rented or sold, not occupied (%)
Vacancy status - For seasonal, recreational, or occasional use (%)
Vacancy status - For migrant workers (%)
Vacancy status - Other vacant (%)
Residents with income below the poverty level (%)
Residents with income below 50% of the poverty level (%)
Children below poverty level (%)
Poor families by family type - Married-couple family (%)
Poor families by family type - Male, no wife present (%)
Poor families by family type - Female, no husband present (%)
Poverty status for native-born residents (%)
Poverty status for foreign-born residents (%)
Poverty among high school graduates not in families (%)
Poverty among people who did not graduate high school not in families (%)
Residents with income below the poverty level (%) - White
Residents with income below the poverty level (%) - Black or African American
Residents with income below the poverty level (%) - Asian
Residents with income below the poverty level (%) - Hispanic or Latino
Residents with income below the poverty level (%) - American Indian and Alaska Native
Residents with income below the poverty level (%) - Multirace
Residents with income below the poverty level (%) - Other Race
Air pollution - Air Quality Index (AQI)
Air pollution - CO
Air pollution - NO2
Air pollution - SO2
Air pollution - Ozone
Air pollution - PM10
Air pollution - PM25
Air pollution - Pb
Crime - Murders per 100,000 population
Crime - Rapes per 100,000 population
Crime - Robberies per 100,000 population
Crime - Assaults per 100,000 population
Crime - Burglaries per 100,000 population
Crime - Thefts per 100,000 population
Crime - Auto thefts per 100,000 population
Crime - Arson per 100,000 population
Crime - City-data.com crime index
Crime - Violent crime index
Crime - Property crime index
Crime - Murders per 100,000 population (5 year average)
Crime - Rapes per 100,000 population (5 year average)
Crime - Robberies per 100,000 population (5 year average)
Crime - Assaults per 100,000 population (5 year average)
Crime - Burglaries per 100,000 population (5 year average)
Crime - Thefts per 100,000 population (5 year average)
Crime - Auto thefts per 100,000 population (5 year average)
Crime - Arson per 100,000 population (5 year average)
Crime - City-data.com crime index (5 year average)
Crime - Violent crime index (5 year average)
Crime - Property crime index (5 year average)
1996 Presidential Elections Results (%) - Democratic Party (Clinton)
1996 Presidential Elections Results (%) - Republican Party (Dole)
1996 Presidential Elections Results (%) - Other
2000 Presidential Elections Results (%) - Democratic Party (Gore)
2000 Presidential Elections Results (%) - Republican Party (Bush)
2000 Presidential Elections Results (%) - Other
2004 Presidential Elections Results (%) - Democratic Party (Kerry)
2004 Presidential Elections Results (%) - Republican Party (Bush)
2004 Presidential Elections Results (%) - Other
2008 Presidential Elections Results (%) - Democratic Party (Obama)
2008 Presidential Elections Results (%) - Republican Party (McCain)
2008 Presidential Elections Results (%) - Other
2012 Presidential Elections Results (%) - Democratic Party (Obama)
2012 Presidential Elections Results (%) - Republican Party (Romney)
2012 Presidential Elections Results (%) - Other
2016 Presidential Elections Results (%) - Democratic Party (Clinton)
2016 Presidential Elections Results (%) - Republican Party (Trump)
2016 Presidential Elections Results (%) - Other
2020 Presidential Elections Results (%) - Democratic Party (Biden)
2020 Presidential Elections Results (%) - Republican Party (Trump)
2020 Presidential Elections Results (%) - Other
Ancestries Reported - Arab (%)
Ancestries Reported - Czech (%)
Ancestries Reported - Danish (%)
Ancestries Reported - Dutch (%)
Ancestries Reported - English (%)
Ancestries Reported - French (%)
Ancestries Reported - French Canadian (%)
Ancestries Reported - German (%)
Ancestries Reported - Greek (%)
Ancestries Reported - Hungarian (%)
Ancestries Reported - Irish (%)
Ancestries Reported - Italian (%)
Ancestries Reported - Lithuanian (%)
Ancestries Reported - Norwegian (%)
Ancestries Reported - Polish (%)
Ancestries Reported - Portuguese (%)
Ancestries Reported - Russian (%)
Ancestries Reported - Scotch-Irish (%)
Ancestries Reported - Scottish (%)
Ancestries Reported - Slovak (%)
Ancestries Reported - Subsaharan African (%)
Ancestries Reported - Swedish (%)
Ancestries Reported - Swiss (%)
Ancestries Reported - Ukrainian (%)
Ancestries Reported - United States (%)
Ancestries Reported - Welsh (%)
Ancestries Reported - West Indian (%)
Ancestries Reported - Other (%)
Educational Attainment - No schooling completed (%)
Educational Attainment - Less than high school (%)
Educational Attainment - High school or equivalent (%)
Educational Attainment - Less than 1 year of college (%)
Educational Attainment - 1 or more years of college (%)
Educational Attainment - Associate degree (%)
Educational Attainment - Bachelor's degree (%)
Educational Attainment - Master's degree (%)
Educational Attainment - Professional school degree (%)
Educational Attainment - Doctorate degree (%)
School Enrollment - Nursery, preschool (%)
School Enrollment - Kindergarten (%)
School Enrollment - Grade 1 to 4 (%)
School Enrollment - Grade 5 to 8 (%)
School Enrollment - Grade 9 to 12 (%)
School Enrollment - College undergrad (%)
School Enrollment - Graduate or professional (%)
School Enrollment - Not enrolled in school (%)
School enrollment - Public schools (%)
School enrollment - Private schools (%)
School enrollment - Not enrolled (%)
Median number of rooms in houses and condos
Median number of rooms in apartments
Housing units lacking complete plumbing facilities (%)
Housing units lacking complete kitchen facilities (%)
Density of houses
Urban houses (%)
Rural houses (%)
Households with people 60 years and over (%)
Households with people 65 years and over (%)
Households with people 75 years and over (%)
Households with one or more nonrelatives (%)
Households with no nonrelatives (%)
Population in households (%)
Family households (%)
Nonfamily households (%)
Population in families (%)
Family households with own children (%)
Median number of bedrooms in owner occupied houses
Mean number of bedrooms in owner occupied houses
Median number of bedrooms in renter occupied houses
Mean number of bedrooms in renter occupied houses
Median number of vehichles in owner occupied houses
Mean number of vehichles in owner occupied houses
Median number of vehichles in renter occupied houses
Mean number of vehichles in renter occupied houses
Mortgage status - with mortgage (%)
Mortgage status - with second mortgage (%)
Mortgage status - with home equity loan (%)
Mortgage status - with both second mortgage and home equity loan (%)
Mortgage status - without a mortgage (%)
Average family size
Average family size - White
Average family size - Black or African American
Average family size - Asian
Average family size - Hispanic or Latino
Average family size - American Indian and Alaska Native
Average family size - Multirace
Average family size - Other Race
Geographical mobility - Same house 1 year ago (%)
Geographical mobility - Moved within same county (%)
Geographical mobility - Moved from different county within same state (%)
Geographical mobility - Moved from different state (%)
Geographical mobility - Moved from abroad (%)
Place of birth - Born in state of residence (%)
Place of birth - Born in other state (%)
Place of birth - Native, outside of US (%)
Place of birth - Foreign born (%)
Housing units in structures - 1, detached (%)
Housing units in structures - 1, attached (%)
Housing units in structures - 2 (%)
Housing units in structures - 3 or 4 (%)
Housing units in structures - 5 to 9 (%)
Housing units in structures - 10 to 19 (%)
Housing units in structures - 20 to 49 (%)
Housing units in structures - 50 or more (%)
Housing units in structures - Mobile home (%)
Housing units in structures - Boat, RV, van, etc. (%)
House/condo owner moved in on average (years ago)
Renter moved in on average (years ago)
Year householder moved into unit - Moved in 1999 to March 2000 (%)
Year householder moved into unit - Moved in 1995 to 1998 (%)
Year householder moved into unit - Moved in 1990 to 1994 (%)
Year householder moved into unit - Moved in 1980 to 1989 (%)
Year householder moved into unit - Moved in 1970 to 1979 (%)
Year householder moved into unit - Moved in 1969 or earlier (%)
Means of transportation to work - Drove car alone (%)
Means of transportation to work - Carpooled (%)
Means of transportation to work - Public transportation (%)
Means of transportation to work - Bus or trolley bus (%)
Means of transportation to work - Streetcar or trolley car (%)
Means of transportation to work - Subway or elevated (%)
Means of transportation to work - Railroad (%)
Means of transportation to work - Ferryboat (%)
Means of transportation to work - Taxicab (%)
Means of transportation to work - Motorcycle (%)
Means of transportation to work - Bicycle (%)
Means of transportation to work - Walked (%)
Means of transportation to work - Other means (%)
Working at home (%)
Industry diversity
Most Common Industries - Agriculture, forestry, fishing and hunting, and mining (%)
Most Common Industries - Agriculture, forestry, fishing and hunting (%)
Most Common Industries - Mining, quarrying, and oil and gas extraction (%)
Most Common Industries - Construction (%)
Most Common Industries - Manufacturing (%)
Most Common Industries - Wholesale trade (%)
Most Common Industries - Retail trade (%)
Most Common Industries - Transportation and warehousing, and utilities (%)
Most Common Industries - Transportation and warehousing (%)
Most Common Industries - Utilities (%)
Most Common Industries - Information (%)
Most Common Industries - Finance and insurance, and real estate and rental and leasing (%)
Most Common Industries - Finance and insurance (%)
Most Common Industries - Real estate and rental and leasing (%)
Most Common Industries - Professional, scientific, and management, and administrative and waste management services (%)
Most Common Industries - Professional, scientific, and technical services (%)
Most Common Industries - Management of companies and enterprises (%)
Most Common Industries - Administrative and support and waste management services (%)
Most Common Industries - Educational services, and health care and social assistance (%)
Most Common Industries - Educational services (%)
Most Common Industries - Health care and social assistance (%)
Most Common Industries - Arts, entertainment, and recreation, and accommodation and food services (%)
Most Common Industries - Arts, entertainment, and recreation (%)
Most Common Industries - Accommodation and food services (%)
Most Common Industries - Other services, except public administration (%)
Most Common Industries - Public administration (%)
Occupation diversity
Most Common Occupations - Management, business, science, and arts occupations (%)
Most Common Occupations - Management, business, and financial occupations (%)
Most Common Occupations - Management occupations (%)
Most Common Occupations - Business and financial operations occupations (%)
Most Common Occupations - Computer, engineering, and science occupations (%)
Most Common Occupations - Computer and mathematical occupations (%)
Most Common Occupations - Architecture and engineering occupations (%)
Most Common Occupations - Life, physical, and social science occupations (%)
Most Common Occupations - Education, legal, community service, arts, and media occupations (%)
Most Common Occupations - Community and social service occupations (%)
Most Common Occupations - Legal occupations (%)
Most Common Occupations - Education, training, and library occupations (%)
Most Common Occupations - Arts, design, entertainment, sports, and media occupations (%)
Most Common Occupations - Healthcare practitioners and technical occupations (%)
Most Common Occupations - Health diagnosing and treating practitioners and other technical occupations (%)
Most Common Occupations - Health technologists and technicians (%)
Most Common Occupations - Service occupations (%)
Most Common Occupations - Healthcare support occupations (%)
Most Common Occupations - Protective service occupations (%)
Most Common Occupations - Fire fighting and prevention, and other protective service workers including supervisors (%)
Most Common Occupations - Law enforcement workers including supervisors (%)
Most Common Occupations - Food preparation and serving related occupations (%)
Most Common Occupations - Building and grounds cleaning and maintenance occupations (%)
Most Common Occupations - Personal care and service occupations (%)
Most Common Occupations - Sales and office occupations (%)
Most Common Occupations - Sales and related occupations (%)
Most Common Occupations - Office and administrative support occupations (%)
Most Common Occupations - Natural resources, construction, and maintenance occupations (%)
Most Common Occupations - Farming, fishing, and forestry occupations (%)
Most Common Occupations - Construction and extraction occupations (%)
Most Common Occupations - Installation, maintenance, and repair occupations (%)
Most Common Occupations - Production, transportation, and material moving occupations (%)
Most Common Occupations - Production occupations (%)
Most Common Occupations - Transportation occupations (%)
Most Common Occupations - Material moving occupations (%)
People in Group quarters - Institutionalized population (%)
People in Group quarters - Correctional institutions (%)
People in Group quarters - Federal prisons and detention centers (%)
People in Group quarters - Halfway houses (%)
People in Group quarters - Local jails and other confinement facilities (including police lockups) (%)
People in Group quarters - Military disciplinary barracks (%)
People in Group quarters - State prisons (%)
People in Group quarters - Other types of correctional institutions (%)
People in Group quarters - Nursing homes (%)
People in Group quarters - Hospitals/wards, hospices, and schools for the handicapped (%)
People in Group quarters - Hospitals/wards and hospices for chronically ill (%)
People in Group quarters - Hospices or homes for chronically ill (%)
People in Group quarters - Military hospitals or wards for chronically ill (%)
People in Group quarters - Other hospitals or wards for chronically ill (%)
People in Group quarters - Hospitals or wards for drug/alcohol abuse (%)
People in Group quarters - Mental (Psychiatric) hospitals or wards (%)
People in Group quarters - Schools, hospitals, or wards for the mentally retarded (%)
People in Group quarters - Schools, hospitals, or wards for the physically handicapped (%)
People in Group quarters - Institutions for the deaf (%)
People in Group quarters - Institutions for the blind (%)
People in Group quarters - Orthopedic wards and institutions for the physically handicapped (%)
People in Group quarters - Wards in general hospitals for patients who have no usual home elsewhere (%)
People in Group quarters - Wards in military hospitals for patients who have no usual home elsewhere (%)
People in Group quarters - Juvenile institutions (%)
People in Group quarters - Long-term care (%)
People in Group quarters - Homes for abused, dependent, and neglected children (%)
People in Group quarters - Residential treatment centers for emotionally disturbed children (%)
People in Group quarters - Training schools for juvenile delinquents (%)
People in Group quarters - Short-term care, detention or diagnostic centers for delinquent children (%)
People in Group quarters - Type of juvenile institution unknown (%)
People in Group quarters - Noninstitutionalized population (%)
People in Group quarters - College dormitories (includes college quarters off campus) (%)
People in Group quarters - Military quarters (%)
People in Group quarters - On base (%)
People in Group quarters - Barracks, unaccompanied personnel housing (UPH), (Enlisted/Officer), ;and similar group living quarters for military personnel (%)
People in Group quarters - Transient quarters for temporary residents (%)
People in Group quarters - Military ships (%)
People in Group quarters - Group homes (%)
People in Group quarters - Homes or halfway houses for drug/alcohol abuse (%)
People in Group quarters - Homes for the mentally ill (%)
People in Group quarters - Homes for the mentally retarded (%)
People in Group quarters - Homes for the physically handicapped (%)
People in Group quarters - Other group homes (%)
People in Group quarters - Religious group quarters (%)
People in Group quarters - Dormitories (%)
People in Group quarters - Agriculture workers' dormitories on farms (%)
People in Group quarters - Job Corps and vocational training facilities (%)
People in Group quarters - Other workers' dormitories (%)
People in Group quarters - Crews of maritime vessels (%)
People in Group quarters - Other nonhousehold living situations (%)
People in Group quarters - Other noninstitutional group quarters (%)
Residents speaking English at home (%)
Residents speaking English at home - Born in the United States (%)
Residents speaking English at home - Native, born elsewhere (%)
Residents speaking English at home - Foreign born (%)
Residents speaking Spanish at home (%)
Residents speaking Spanish at home - Born in the United States (%)
Residents speaking Spanish at home - Native, born elsewhere (%)
Residents speaking Spanish at home - Foreign born (%)
Residents speaking other language at home (%)
Residents speaking other language at home - Born in the United States (%)
Residents speaking other language at home - Native, born elsewhere (%)
Residents speaking other language at home - Foreign born (%)
Class of Workers - Employee of private company (%)
Class of Workers - Self-employed in own incorporated business (%)
Class of Workers - Private not-for-profit wage and salary workers (%)
Class of Workers - Local government workers (%)
Class of Workers - State government workers (%)
Class of Workers - Federal government workers (%)
Class of Workers - Self-employed workers in own not incorporated business and Unpaid family workers (%)
House heating fuel used in houses and condos - Utility gas (%)
House heating fuel used in houses and condos - Bottled, tank, or LP gas (%)
House heating fuel used in houses and condos - Electricity (%)
House heating fuel used in houses and condos - Fuel oil, kerosene, etc. (%)
House heating fuel used in houses and condos - Coal or coke (%)
House heating fuel used in houses and condos - Wood (%)
House heating fuel used in houses and condos - Solar energy (%)
House heating fuel used in houses and condos - Other fuel (%)
House heating fuel used in houses and condos - No fuel used (%)
House heating fuel used in apartments - Utility gas (%)
House heating fuel used in apartments - Bottled, tank, or LP gas (%)
House heating fuel used in apartments - Electricity (%)
House heating fuel used in apartments - Fuel oil, kerosene, etc. (%)
House heating fuel used in apartments - Coal or coke (%)
House heating fuel used in apartments - Wood (%)
House heating fuel used in apartments - Solar energy (%)
House heating fuel used in apartments - Other fuel (%)
House heating fuel used in apartments - No fuel used (%)
Armed forces status - In Armed Forces (%)
Armed forces status - Civilian (%)
Armed forces status - Civilian - Veteran (%)
Armed forces status - Civilian - Nonveteran (%)
Fatal accidents locations in years 2005-2021
Fatal accidents locations in 2005
Fatal accidents locations in 2006
Fatal accidents locations in 2007
Fatal accidents locations in 2008
Fatal accidents locations in 2009
Fatal accidents locations in 2010
Fatal accidents locations in 2011
Fatal accidents locations in 2012
Fatal accidents locations in 2013
Fatal accidents locations in 2014
Fatal accidents locations in 2015
Fatal accidents locations in 2016
Fatal accidents locations in 2017
Fatal accidents locations in 2018
Fatal accidents locations in 2019
Fatal accidents locations in 2020
Fatal accidents locations in 2021
Alcohol use - People drinking some alcohol every month (%)
Alcohol use - People not drinking at all (%)
Alcohol use - Average days/month drinking alcohol
Alcohol use - Average drinks/week
Alcohol use - Average days/year people drink much
Audiometry - Average condition of hearing (%)
Audiometry - People that can hear a whisper from across a quiet room (%)
Audiometry - People that can hear normal voice from across a quiet room (%)
Audiometry - Ears ringing, roaring, buzzing (%)
Audiometry - Had a job exposure to loud noise (%)
Audiometry - Had off-work exposure to loud noise (%)
Blood Pressure & Cholesterol - Has high blood pressure (%)
Blood Pressure & Cholesterol - Checking blood pressure at home (%)
Blood Pressure & Cholesterol - Frequently checking blood cholesterol (%)
Blood Pressure & Cholesterol - Has high cholesterol level (%)
Consumer Behavior - Money monthly spent on food at supermarket/grocery store
Consumer Behavior - Money monthly spent on food at other stores
Consumer Behavior - Money monthly spent on eating out
Consumer Behavior - Money monthly spent on carryout/delivered foods
Consumer Behavior - Income spent on food at supermarket/grocery store (%)
Consumer Behavior - Income spent on food at other stores (%)
Consumer Behavior - Income spent on eating out (%)
Consumer Behavior - Income spent on carryout/delivered foods (%)
Current Health Status - General health condition (%)
Current Health Status - Blood donors (%)
Current Health Status - Has blood ever tested for HIV virus (%)
Current Health Status - Left-handed people (%)
Dermatology - People using sunscreen (%)
Diabetes - Diabetics (%)
Diabetes - Had a blood test for high blood sugar (%)
Diabetes - People taking insulin (%)
Diet Behavior & Nutrition - Diet health (%)
Diet Behavior & Nutrition - Milk product consumption (# of products/month)
Diet Behavior & Nutrition - Meals not home prepared (#/week)
Diet Behavior & Nutrition - Meals from fast food or pizza place (#/week)
Diet Behavior & Nutrition - Ready-to-eat foods (#/month)
Diet Behavior & Nutrition - Frozen meals/pizza (#/month)
Drug Use - People that ever used marijuana or hashish (%)
Drug Use - Ever used hard drugs (%)
Drug Use - Ever used any form of cocaine (%)
Drug Use - Ever used heroin (%)
Drug Use - Ever used methamphetamine (%)
Health Insurance - People covered by health insurance (%)
Kidney Conditions-Urology - Avg. # of times urinating at night
Medical Conditions - People with asthma (%)
Medical Conditions - People with anemia (%)
Medical Conditions - People with psoriasis (%)
Medical Conditions - People with overweight (%)
Medical Conditions - Elderly people having difficulties in thinking or remembering (%)
Medical Conditions - People who ever received blood transfusion (%)
Medical Conditions - People having trouble seeing even with glass/contacts (%)
Medical Conditions - People with arthritis (%)
Medical Conditions - People with gout (%)
Medical Conditions - People with congestive heart failure (%)
Medical Conditions - People with coronary heart disease (%)
Medical Conditions - People with angina pectoris (%)
Medical Conditions - People who ever had heart attack (%)
Medical Conditions - People who ever had stroke (%)
Medical Conditions - People with emphysema (%)
Medical Conditions - People with thyroid problem (%)
Medical Conditions - People with chronic bronchitis (%)
Medical Conditions - People with any liver condition (%)
Medical Conditions - People who ever had cancer or malignancy (%)
Mental Health - People who have little interest in doing things (%)
Mental Health - People feeling down, depressed, or hopeless (%)
Mental Health - People who have trouble sleeping or sleeping too much (%)
Mental Health - People feeling tired or having little energy (%)
Mental Health - People with poor appetite or overeating (%)
Mental Health - People feeling bad about themself (%)
Mental Health - People who have trouble concentrating on things (%)
Mental Health - People moving or speaking slowly or too fast (%)
Mental Health - People having thoughts they would be better off dead (%)
Oral Health - Average years since last visit a dentist
Oral Health - People embarrassed because of mouth (%)
Oral Health - People with gum disease (%)
Oral Health - General health of teeth and gums (%)
Oral Health - Average days a week using dental floss/device
Oral Health - Average days a week using mouthwash for dental problem
Oral Health - Average number of teeth
Pesticide Use - Households using pesticides to control insects (%)
Pesticide Use - Households using pesticides to kill weeds (%)
Physical Activity - People doing vigorous-intensity work activities (%)
Physical Activity - People doing moderate-intensity work activities (%)
Physical Activity - People walking or bicycling (%)
Physical Activity - People doing vigorous-intensity recreational activities (%)
Physical Activity - People doing moderate-intensity recreational activities (%)
Physical Activity - Average hours a day doing sedentary activities
Physical Activity - Average hours a day watching TV or videos
Physical Activity - Average hours a day using computer
Physical Functioning - People having limitations keeping them from working (%)
Physical Functioning - People limited in amount of work they can do (%)
Physical Functioning - People that need special equipment to walk (%)
Physical Functioning - People experiencing confusion/memory problems (%)
Physical Functioning - People requiring special healthcare equipment (%)
Prescription Medications - Average number of prescription medicines taking
Preventive Aspirin Use - Adults 40+ taking low-dose aspirin (%)
Reproductive Health - Vaginal deliveries (%)
Reproductive Health - Cesarean deliveries (%)
Reproductive Health - Deliveries resulted in a live birth (%)
Reproductive Health - Pregnancies resulted in a delivery (%)
Reproductive Health - Women breastfeeding newborns (%)
Reproductive Health - Women that had a hysterectomy (%)
Reproductive Health - Women that had both ovaries removed (%)
Reproductive Health - Women that have ever taken birth control pills (%)
Reproductive Health - Women taking birth control pills (%)
Reproductive Health - Women that have ever used Depo-Provera or injectables (%)
Reproductive Health - Women that have ever used female hormones (%)
Sexual Behavior - People 18+ that ever had sex (vaginal, anal, or oral) (%)
Sexual Behavior - Males 18+ that ever had vaginal sex with a woman (%)
Sexual Behavior - Males 18+ that ever performed oral sex on a woman (%)
Sexual Behavior - Males 18+ that ever had anal sex with a woman (%)
Sexual Behavior - Males 18+ that ever had any sex with a man (%)
Sexual Behavior - Females 18+ that ever had vaginal sex with a man (%)
Sexual Behavior - Females 18+ that ever performed oral sex on a man (%)
Sexual Behavior - Females 18+ that ever had anal sex with a man (%)
Sexual Behavior - Females 18+ that ever had any kind of sex with a woman (%)
Sexual Behavior - Average age people first had sex
Sexual Behavior - Average number of female sex partners in lifetime (males 18+)
Sexual Behavior - Average number of female vaginal sex partners in lifetime (males 18+)
Sexual Behavior - Average age people first performed oral sex on a woman (18+)
Sexual Behavior - Average number of woman performed oral sex on in lifetime (18+)
Sexual Behavior - Average number of male sex partners in lifetime (males 18+)
Sexual Behavior - Average number of male anal sex partners in lifetime (males 18+)
Sexual Behavior - Average age people first performed oral sex on a man (18+)
Sexual Behavior - Average number of male oral sex partners in lifetime (18+)
Sexual Behavior - People using protection when performing oral sex (%)
Sexual Behavior - Average number of times people have vaginal or anal sex a year
Sexual Behavior - People having sex without condom (%)
Sexual Behavior - Average number of male sex partners in lifetime (females 18+)
Sexual Behavior - Average number of male vaginal sex partners in lifetime (females 18+)
Sexual Behavior - Average number of female sex partners in lifetime (females 18+)
Sexual Behavior - Circumcised males 18+ (%)
Sleep Disorders - Average hours sleeping at night
Sleep Disorders - People that has trouble sleeping (%)
Smoking-Cigarette Use - People smoking cigarettes (%)
Taste & Smell - People 40+ having problems with smell (%)
Taste & Smell - People 40+ having problems with taste (%)
Taste & Smell - People 40+ that ever had wisdom teeth removed (%)
Taste & Smell - People 40+ that ever had tonsils teeth removed (%)
Taste & Smell - People 40+ that ever had a loss of consciousness because of a head injury (%)
Taste & Smell - People 40+ that ever had a broken nose or other serious injury to face or skull (%)
Taste & Smell - People 40+ that ever had two or more sinus infections (%)
Weight - Average height (inches)
Weight - Average weight (pounds)
Weight - Average BMI
Weight - People that are obese (%)
Weight - People that ever were obese (%)
Weight - People trying to lose weight (%)
32,972 67.1% Hispanic 10,119 20.6% White alone 4,117 8.4% Asian alone 1,198 2.4% Two or more races 698 1.4% Black alone 223 0.5% Other race alone 196 0.4% American Indian alone 174 0.4% Native Hawaiian and Other
According to our research of California and other state lists, there were 64 registered sex offenders living in Ceres, California as of April 27, 2024 . The ratio of all residents to sex offenders in Ceres is 753 to 1.The ratio of registered sex offenders to all residents in this city is near the state average.
Officers per 1,000 residents here:
1.00California average:
2.30
Latest news from Ceres, CA collected exclusively by city-data.com from local newspapers, TV, and radio stations
Ancestries: American (2.0%), English (1.6%), Portuguese (1.4%), German (1.2%).
Current Local Time:
Land area: 6.94 square miles.
Population density: 7,061 people per square mile (high).
13,395 residents are foreign born (20.5% Latin America , 5.7% Asia ).
This city:
27.3%California:
26.5%
Median real estate property taxes paid for housing units with mortgages in 2022: $2,839 (0.7%)Median real estate property taxes paid for housing units with no mortgage in 2022: $1,915 (0.5%)
Nearest city with pop. 50,000+: Modesto, CA
Nearest city with pop. 200,000+: Stockton, CA
Nearest city with pop. 1,000,000+: Los Angeles, CA
Nearest cities:
Latitude: 37.60 N, Longitude: 120.96 W
Daytime population change due to commuting: -5,166 (-10.5%)Workers who live and work in this city: 3,095 (16.2%)
Single-family new house construction building permits:
2022: 19 buildings , average cost: $82,1002021: 17 buildings , average cost: $304,2002020: 5 buildings , average cost: $200,0002019: 61 buildings , average cost: $213,1002018: 37 buildings , average cost: $214,1002017: 17 buildings , average cost: $236,6002016: 21 buildings , average cost: $200,0002015: 35 buildings , average cost: $184,1002014: 52 buildings , average cost: $211,9002013: 25 buildings , average cost: $209,6002011: 1 building , cost: $94,2002010: 2 buildings , average cost: $154,6002009: 10 buildings , average cost: $173,1002008: 47 buildings , average cost: $159,4002007: 119 buildings , average cost: $187,9002006: 313 buildings , average cost: $182,9002005: 676 buildings , average cost: $184,8002004: 634 buildings , average cost: $161,5002003: 351 buildings , average cost: $139,4002002: 268 buildings , average cost: $131,1002001: 145 buildings , average cost: $117,1002000: 99 buildings , average cost: $112,0001999: 118 buildings , average cost: $119,7001998: 95 buildings , average cost: $102,6001997: 89 buildings , average cost: $128,300Unemployment in December 2023:
Population change in the 1990s: +7,422 (+27.3%).
Most common occupations in Ceres, CA (%)
Both Males Females
Other production occupations, including supervisors (8.2%)
Driver/sales workers and truck drivers (4.7%)
Building and grounds cleaning and maintenance occupations (4.4%)
Retail sales workers, except cashiers (3.8%)
Other sales and related occupations, including supervisors (3.8%)
Electrical equipment mechanics and other installation, maintenance, and repair workers, including supervisors (3.2%)
Material recording, scheduling, dispatching, and distributing workers (3.0%)
Other production occupations, including supervisors (10.3%)
Driver/sales workers and truck drivers (8.1%)
Electrical equipment mechanics and other installation, maintenance, and repair workers, including supervisors (5.5%)
Building and grounds cleaning and maintenance occupations (5.5%)
Construction traders workers except carpenters, electricians, painters, plumbers, and construction laborers (4.0%)
Vehicle and mobile equipment mechanics, installers, and repairers (3.7%)
Material recording, scheduling, dispatching, and distributing workers (3.5%)
Other production occupations, including supervisors (5.6%)
Secretaries and administrative assistants (5.4%)
Retail sales workers, except cashiers (4.5%)
Other office and administrative support workers, including supervisors (4.3%)
Cashiers (4.3%)
Other sales and related occupations, including supervisors (4.1%)
Information and record clerks, except customer service representatives (3.8%)
Earthquake activity:
Ceres-area historical earthquake activity is significantly above California state average. It is 8145% greater than the overall U.S. average. On 4/18/1906 at 13:12:21, a magnitude 7.9 (7.9 UK, Class: Major, Intensity: VIII - XII) earthquake occurred 115.0 miles away from Ceres center, causing $524,000,000 total damage On 10/18/1989 at 00:04:15, a magnitude 7.1 (6.5 MB, 7.1 MS, 6.9 MW, 7.0 ML) earthquake occurred 56.1 miles away from the city center, causing 62 deaths ( 62 shaking deaths) and 3757 injuries, causing $1,305,032,704 total damage On 7/21/1952 at 11:52:14, a magnitude 7.7 (7.7 UK) earthquake occurred 210.4 miles away from Ceres center, causing $50,000,000 total damage On 11/4/1927 at 13:51:53, a magnitude 7.5 (7.5 UK) earthquake occurred 185.9 miles away from the city center On 12/21/1932 at 06:10:09, a magnitude 7.2 (7.2 UK) earthquake occurred 168.6 miles away from Ceres center On 10/3/1915 at 06:52:48, a magnitude 7.6 (7.6 UK) earthquake occurred 273.2 miles away from the city center Magnitude types: body-wave magnitude (MB), local magnitude (ML), surface-wave magnitude (MS), moment magnitude (MW) Natural disasters: The number of natural disasters in Stanislaus County (13) is near the US average (15).Major Disasters (Presidential) Declared: 8Emergencies Declared: 2Floods: 8, Storms: 4, Winter Storms: 3, Landslides: 2, Mudslides: 2, Drought: 1, Fire: 1, Freeze: 1, Heavy Rain: 1, Hurricane: 1, Tornado: 1, Other: 1 (Note: some incidents may be assigned to more than one category). Hospitals and medical centers in Ceres: HA-LE ALOHA CONVALESCENT HOSPITAL (1711 RICHLAND AVENUE)
CERES DIALYSIS CENTER (1768 MITCHELL ROAD SUITE 308)
Other hospitals and medical centers near Ceres: KINDRED HOSPITAL MODESTO (Hospital, about 4 miles away; MODESTO, CA)
MODESTO REHABILITATION HOSPITAL (Nursing Home, about 4 miles away; MODESTO, CA)
ACACIA PARK NURSING AND REHAB CENTER (Nursing Home, about 4 miles away; MODESTO, CA)
STANISLAUS MEDICAL CENTER (Hospital, about 4 miles away; MODESTO, CA)
GLOBAL HEALTHCARE SERVICES, LLC (Home Health Center, about 4 miles away; MODESTO, CA)
SATELLITE DIALYSIS - CENTRAL MODESTO (Dialysis Facility, about 5 miles away; MODESTO, CA)
STANISLAUS SURGICAL HOSPITAL (about 5 miles away; MODESTO, CA)
Amtrak stations near Ceres: 6 miles: MODESTO (1700 HELD DRIVE) Services: ticket office, fully wheelchair accessible, enclosed waiting area, public restrooms, public payphones, vending machines, free short-term parking, free long-term parking, call for car rental service, call for taxi service, public transit connection.
10 miles: TURLOCK-DENAIR (DENAIR, SANTA FE ST. AT ELM ST.) Services: fully wheelchair accessible, public payphones, vending machines, free short-term parking, free long-term parking, call for taxi service.
Colleges/universities with over 2000 students nearest to Ceres:
Modesto Junior College (about 5 miles; Modesto, CA ; Full-time enrollment: 10,635)
California State University-Stanislaus (about 8 miles; Turlock, CA ; FT enrollment: 7,054)
Merced College (about 33 miles; Merced, CA ; FT enrollment: 6,973)
University of the Pacific (about 33 miles; Stockton, CA ; FT enrollment: 4,999)
University of California-Merced (about 34 miles; Merced, CA ; FT enrollment: 5,981)
San Joaquin Delta College (about 34 miles; Stockton, CA ; FT enrollment: 12,167)
Las Positas College (about 48 miles; Livermore, CA ; FT enrollment: 5,112)
Public high schools in Ceres: CENTRAL VALLEY HIGH Students: 1,117, Location: 4033 CENTRAL AVE., Grades: 9-12)CERES HIGH Students: 984, Location: 2320 CENTRAL AVE., Grades: 9-12)WHITMORE CHARTER HIGH Students: 116, Location: 3435 DON PEDRO RD., Grades: 9-12, Charter school )ARGUS HIGH (CONTINUATION) Students: 108, Location: 2555 LAWRENCE ST., Grades: 9-12)ENDEAVOR ALTERNATIVE Students: 22, Location: 2555 LAWRENCE ST., Grades: KG-12)WHITMORE CHARTER SCHOOL OF PERSONALIZED LEARNING Students: 11, Location: 3435 DON PEDRO RD., Grades: KG-12, Charter school )STANISLAUS COUNTY INSTITUTE OF LEARNING Location: 3113 MITCHELL RD., Grades: 6-12)
Private high school in Ceres: CENTRAL VALLEY CHRISTIAN ACADEMY Students: 201, Location: 2020 ACADEMY PL, Grades: KG-12)
Biggest public elementary/middle schools in Ceres: MAE HENSLEY JUNIOR HIGH Students: 840, Location: 1806 MOFFET RD., Grades: 7-8)BLAKER-KINSER JUNIOR HIGH Students: 794, Location: 1601 KINSER RD., Grades: 7-8)SINCLEAR ELEMENTARY Students: 438, Location: 1211 HACKETT RD., Grades: KG-6)SAMUEL VAUGHN ELEMENTARY Students: 433, Location: 3618 HELEN PERRY RD., Grades: KG-6)CARROLL FOWLER ELEMENTARY Students: 420, Location: 2611 GARRISON ST., Grades: KG-6)CASWELL ELEMENTARY Students: 343, Location: 1800 N. CENTRAL AVE., Grades: KG-6)DON PEDRO ELEMENTARY Students: 334, Location: 2300 DON PEDRO RD., Grades: KG-6)JOEL J. HIDAHL ELEMENTARY Students: 317, Location: 2351 E. REDWOOD RD., Grades: KG-6)WALTER WHITE ELEMENTARY Students: 311, Location: 2904 SIXTH ST., Grades: KG-6)WHITMORE CHARTER SCHOOL OF ART & TECHNOLOGY Students: 279, Location: 3435 DON PEDRO RD., Grades: KG-8, Charter school )See full list of schools located in Ceres User-submitted facts and corrections:
The average temperatures listed for Ceres are off during the summer months. For example, the averages for June, July, and August are in the mid- to high-seventies, when, in fact, our average temperatures during those months are usually in the mid- to high-nineties.
added by Shylah
Add FM radio Station 105.5 Smooth Jazz. Check it out at www.KRVR.com Strong signal in Ceres Thanks added by mc
Notable locations in Ceres: (A) , Ceres City Hall (B) , Ceres Branch Stanislaus County Free Library (C) , Ceres Emergency Services Station 3 (D) , Ceres Emergency Services Station 4 (E) , Ceres Emergency Services Station 1 (F) . Display/hide their locations on the map
Shopping Centers: (1) , Plaza del Rio Shopping Center (2) , Ceres Shopping Center (3) , Ceres Plaza Shopping Center (4) . Display/hide their locations on the map
Parks in Ceres include: (1) , Berry Grove Park (2) , Independence Park (3) , Persehone Park (4) , Redwood Park (5) , Roeding Heights Park (6) , Smyrna Park (7) . Display/hide their locations on the map
Tourist attraction:
Birthplace of: Dick Davey - Baseball player, Bill Berryhill - Politician, Cliff Barrows - Male singer, Edgar Dearing - Film actor, John Wilson (golfer) - Professional golfer, Tom Berryhill - Politician, John Rade - Football player.
Stanislaus County has a predicted average indoor radon screening level less than 2 pCi/L (pico curies per liter) - Low Potential Drinking water stations with addresses in Ceres and their reported violations in the past:
CERES, CITY OF (Population served: 42,666, Groundwater):
Past health violations:
MCL, Monthly (TCR) - In APR-2010, Contaminant: Coliform. Follow-up actions: St AO (w/o penalty) issued (JUN-08-2010), St Compliance achieved (JUN-08-2010)
MCL, Monthly (TCR) - In JUN-2009, Contaminant: Coliform. Follow-up actions: St AO (w/o penalty) issued (JUL-15-2009), St Compliance achieved (JUL-15-2009)
MCL, Single Sample - In JUL-2007, Contaminant: Combined Uranium. Follow-up actions: St AO (w/o penalty) issued (JUL-31-2007), St Compliance achieved (JUL-31-2007)
MCL, Average - Between APR-2007 and JUN-2007, Contaminant: Nitrate. Follow-up actions: St AO (w/o penalty) issued (JUN-07-2007), St Compliance achieved (JUN-07-2007)
Population served: 161, Groundwater):
Past health violations:
MCL, Average - Between JAN-2014 and MAR-2014, Contaminant: Arsenic. Follow-up actions: St AO (w/o penalty) issued (MAR-06-2013)
MCL, Average - Between OCT-2013 and DEC-2013, Contaminant: Arsenic. Follow-up actions: St AO (w/o penalty) issued (MAR-06-2013)
MCL, Average - Between JUL-2013 and SEP-2013, Contaminant: Arsenic. Follow-up actions: St AO (w/o penalty) issued (MAR-06-2013)
MCL, Average - Between APR-2013 and JUN-2013, Contaminant: Arsenic. Follow-up actions: St AO (w/o penalty) issued (MAR-06-2013)
MCL, Average - Between JAN-2013 and MAR-2013, Contaminant: Arsenic. Follow-up actions: St AO (w/o penalty) issued (MAR-06-2013)
MCL, Average - Between OCT-2012 and DEC-2012, Contaminant: Arsenic. Follow-up actions: St AO (w/o penalty) issued (MAR-06-2013)
20 other older health violations
Population served: 160, Groundwater):
Past monitoring violations:
2 routine major monitoring violations
Population served: 50, Groundwater):
Past health violations:
MCL, Average - Between OCT-2011 and DEC-2011, Contaminant: TTHM. Follow-up actions: St AO (w/o penalty) issued (OCT-30-2008)
MCL, Average - Between JUL-2011 and SEP-2011, Contaminant: TTHM. Follow-up actions: St AO (w/o penalty) issued (OCT-30-2008)
Treatment Technique (SWTR and GWR) - In JUN-2011. Follow-up actions: St AO (w/o penalty) issued (NOV-23-2009), St Violation/Reminder Notice (AUG-05-2011)
Treatment Technique (SWTR and GWR) - In MAY-2011. Follow-up actions: St AO (w/o penalty) issued (NOV-23-2009), St Violation/Reminder Notice (JUN-13-2011)
Treatment Technique (SWTR and GWR) - In APR-2011. Follow-up actions: St AO (w/o penalty) issued (NOV-23-2009), St Violation/Reminder Notice (MAY-16-2011)
MCL, Average - Between APR-2011 and JUN-2011, Contaminant: TTHM. Follow-up actions: St AO (w/o penalty) issued (OCT-30-2008)
27 other older health violations
Past monitoring violations:
Monitoring of Treatment (SWTR-Filter) - In JUL-2009. Follow-up actions: St AO (w/o penalty) issued (2 times from AUG-13-2009 to NOV-23-2009)
Average household size: This city:
3.5 peopleCalifornia:
2.9 people
Percentage of family households: This city:
83.3%Whole state:
68.7%
Percentage of households with unmarried partners: This city:
8.3%Whole state:
7.2%
Likely homosexual households (counted as self-reported same-sex unmarried-partner households)
Lesbian couples: 0.4% of all households Gay men: 0.2% of all households
People in group quarters in Ceres in 2010:
160 people in group homes intended for adults
125 people in other noninstitutional facilities
38 people in nursing facilities/skilled-nursing facilities
12 people in group homes for juveniles (non-correctional)
10 people in residential treatment centers for juveniles (non-correctional)
8 people in residential treatment centers for adults
People in group quarters in Ceres in 2000:
52 people in nursing homes
13 people in agriculture workers' dormitories on farms
12 people in other noninstitutional group quarters
11 people in religious group quarters
6 people in homes for the mentally ill
5 people in homes for abused, dependent, and neglected children
Banks with branches in Ceres (2011 data):
Bank of America, National Association: Ceres Branch at 2617 Mitchell Road, branch established on 1986/06/09. Info updated 2009/11/18: Bank assets: $1,451,969.3 mil, Deposits: $1,077,176.8 mil, headquarters in Charlotte, NC, positive income , 5782 total offices , Holding Company: Bank Of America Corporation
Wells Fargo Bank, National Association: Ceres Branch at 2905 4th St, branch established on 1962/11/01. Info updated 2011/04/05: Bank assets: $1,161,490.0 mil, Deposits: $905,653.0 mil, headquarters in Sioux Falls, SD, positive income , 6395 total offices , Holding Company: Wells Fargo & Company
Westamerica Bank: Ceres Branch at 1788 Mitchell Road Suite 104, branch established on 1994/10/17. Info updated 2011/06/21: Bank assets: $4,998.1 mil, Deposits: $4,253.2 mil, headquarters in San Rafael, CA, positive income , Commercial Lending Specialization, 98 total offices , Holding Company: Westamerica Bancorporation
Citibank, National Association: East Whitmore Avenue Branch at 2519 East Whitmore Avenue, branch established on 1919/01/01. Info updated 2012/01/10: Bank assets: $1,288,658.0 mil, Deposits: $882,541.0 mil, headquarters in Sioux Falls, SD, positive income , International Specialization, 1048 total offices , Holding Company: Citigroup Inc.
Bank of the West: Ceres Branch at 2501 East Whitmore Avenue, branch established on 1977/03/09. Info updated 2009/11/16: Bank assets: $62,408.3 mil, Deposits: $43,995.2 mil, headquarters in San Francisco, CA, positive income , 647 total offices , Holding Company: Bnp Paribas
For population 15 years and over in Ceres:
Never married: 39.3%Now married: 46.4%Separated: 1.6%Widowed: 4.3%Divorced: 8.5% For population 25 years and over in Ceres:
High school or higher: 74.7%Bachelor's degree or higher: 10.4%Graduate or professional degree: 2.7%Unemployed: 13.9%Mean travel time to work (commute): 31.7 minutes
Education Gini index (Inequality in education) Here:
18.0California average:
15.5
Religion statistics for Ceres, CA (based on Stanislaus County data)
Religion Adherents Congregations Catholic 107,529 18 Evangelical Protestant 65,976 268 Other 19,198 59 Mainline Protestant 7,730 34 Black Protestant 1,312 8 Orthodox 625 2 None 312,083 -
Source: Clifford Grammich, Kirk Hadaway, Richard Houseal, Dale E.Jones, Alexei Krindatch, Richie Stanley and Richard H.Taylor. 2012. 2010 U.S.Religion Census: Religious Congregations & Membership Study. Association of Statisticians of American Religious Bodies. Jones, Dale E., et al. 2002. Congregations and Membership in the United States 2000. Nashville, TN: Glenmary Research Center. Graphs represent county-level data
Food Environment Statistics: Number of grocery stores : 133This county :
2.61 / 10,000 pop.State :
2.14 / 10,000 pop.
Number of supercenters and club stores : 2Stanislaus County :
0.04 / 10,000 pop.California :
0.04 / 10,000 pop.
Number of convenience stores (no gas) : 33Stanislaus County :
0.65 / 10,000 pop.California :
0.62 / 10,000 pop.
Number of convenience stores (with gas) : 113Stanislaus County :
2.22 / 10,000 pop.California :
1.49 / 10,000 pop.
Number of full-service restaurants : 282Here :
5.54 / 10,000 pop.California :
7.42 / 10,000 pop.
Adult diabetes rate : Stanislaus County :
8.9%California :
7.3%
Low-income preschool obesity rate : Stanislaus County :
17.1%California :
17.9%
Health and Nutrition: Healthy diet rate : Ceres:
46.9%California:
49.4%
Average overall health of teeth and gums : Ceres:
44.8%California:
48.0%
Average BMI : Ceres:
28.7California:
28.1
People feeling badly about themselves : People not drinking alcohol at all : This city:
11.3%State:
11.2%
Average hours sleeping at night : Overweight people : Here:
32.6%California:
31.5%
General health condition : Average condition of hearing : Ceres:
80.3%California:
80.9%
More about Health and Nutrition of Ceres, CA Residents
Local government employment and payroll (March 2022)
Function
Full-time employees
Monthly full-time payroll
Average yearly full-time wage
Part-time employees
Monthly part-time payroll
Police Protection - Officers
47 $491,032 $125,370 4 $13,065 Police - Other
18 $93,418 $62,279 4 $6,131 Financial Administration
17 $104,233 $73,576 0 $0 Water Supply
14 $69,101 $59,229 0 $0 Streets and Highways
14 $65,461 $56,109 0 $0 Other Government Administration
13 $85,772 $79,174 2 $2,428 Other and Unallocable
12 $119,610 $119,610 0 $0 Parks and Recreation
12 $54,296 $54,296 7 $354 Sewerage
7 $35,464 $60,795 0 $0 Firefighters
1 $8,405 $100,860 0 $0 Housing and Community Development (Local)
1 $8,906 $106,872 0 $0
Totals for Government
156 $1,135,698 $87,361 17 $21,978
Ceres government finances - Expenditure in 2021 (per resident):
Construction - Regular Highways: $4,549,000 ($92.86)
General - Other: $4,436,000 ($90.55)Police Protection: $383,000 ($7.82)Parks and Recreation: $310,000 ($6.33)Current Operations - Water Utilities: $21,303,000 ($434.86)
General - Other: $17,558,000 ($358.41)Police Protection: $12,104,000 ($247.08)Sewerage: $8,351,000 ($170.47)Local Fire Protection: $6,782,000 ($138.44)Parks and Recreation: $3,411,000 ($69.63)Health - Other: $2,747,000 ($56.07)Regular Highways: $2,074,000 ($42.34)Central Staff Services: $1,903,000 ($38.85)Protective Inspection and Regulation - Other: $341,000 ($6.96)Housing and Community Development: $121,000 ($2.47)Transit Utilities: $29,000 ($0.59)General - Interest on Debt: $764,000 ($15.60)
Ceres government finances - Revenue in 2021 (per resident):
Charges - Other: $39,561,000 ($807.57)
Sewerage: $10,370,000 ($211.68)Parks and Recreation: $92,000 ($1.88)Federal Intergovernmental - Other: $3,096,000 ($63.20)
Housing and Community Development: $242,000 ($4.94)Local Intergovernmental - Transit Utilities: $3,000 ($0.06)
Miscellaneous - General Revenue - Other: $5,489,000 ($112.05)
Fines and Forfeits: $863,000 ($17.62)Interest Earnings: $847,000 ($17.29)Special Assessments: $426,000 ($8.70)Rents: $129,000 ($2.63)Donations From Private Sources: $1,000 ($0.02)Revenue - Water Utilities: $16,357,000 ($333.90)
State Intergovernmental - Other: $4,937,000 ($100.78)
Highways: $1,948,000 ($39.76)General Local Government Support: $22,000 ($0.45)Tax - General Sales and Gross Receipts: $9,608,000 ($196.13)
Property: $7,706,000 ($157.30)Public Utilities Sales: $2,159,000 ($44.07)Occupation and Business License - Other: $1,388,000 ($28.33)Other License: $392,000 ($8.00)Other Selective Sales: $338,000 ($6.90)Documentary and Stock Transfer: $114,000 ($2.33)
Ceres government finances - Debt in 2021 (per resident):
Long Term Debt - Outstanding Unspecified Public Purpose: $38,559,000 ($787.11)
Issue, Unspecified Public Purpose: $20,280,000 ($413.98)Beginning Outstanding - Unspecified Public Purpose: $19,077,000 ($389.42)Retired Unspecified Public Purpose: $798,000 ($16.29)
Ceres government finances - Cash and Securities in 2021 (per resident):
Bond Funds - Cash and Securities: $27,976,000 ($571.08)
Other Funds - Cash and Securities: $34,817,000 ($710.73)
Sinking Funds - Cash and Securities: $7,754,000 ($158.28)
5.00% of this county's 2021 resident taxpayers lived in other counties in 2020 ($56,165 average adjusted gross income )
Here:
5.00%California average:
5.19%
0.01% of residents moved from foreign countries ($94 average AGI )Stanislaus County:
0.01%California average:
0.03%
Top counties from which taxpayers relocated into this county between 2020 and 2021:
5.39% of this county's 2020 resident taxpayers moved to other counties in 2021 ($61,321 average adjusted gross income )
Here:
5.39%California average:
6.14%
0.01% of residents moved to foreign countries ($87 average AGI )Stanislaus County:
0.01%California average:
0.02%
Top counties to which taxpayers relocated from this county between 2020 and 2021:
Businesses in Ceres, CA
Name Count Name Count
7-Eleven 1 Little Caesars Pizza 1 AT&T 1 McDonald's 2 Ace Hardware 2 Panda Express 1 AutoZone 1 Payless 1 Burger King 2 Penske 1 Carl\s Jr. 1 Pizza Hut 1 Cricket Wireless 1 Quiznos 2 Curves 1 Rite Aid 1 DHL 1 Sprint Nextel 1 Dennys 1 Starbucks 2 FedEx 1 Subway 1 Ford 1 T-Mobile 1 GNC 1 Taco Bell 1 H&R Block 2 U-Haul 1 Jones New York 1 UPS 3 KFC 1 Walmart 1 Kroger 1
Strongest AM radio stations in Ceres:
KCBC (770 AM; 50 kW; RIVERBANK, CA; Owner: KIERTRON, INC.)
KFIV (1360 AM; 4 kW; MODESTO, CA; Owner: CAPSTAR TX LIMITED PARTNERSHIP)
KESP (970 AM; 1 kW; MODESTO, CA; Owner: CITADEL BROADCASTING COMPANY)
KVIN (920 AM; 2 kW; CERES, CA; Owner: THRESHOLD COMMUNICATIONS)
KLOK (1170 AM; 50 kW; SAN JOSE, CA; Owner: ENTRAVISION HOLDINGS, LLC)
KLOC (1390 AM; 5 kW; TURLOCK, CA)
KGO (810 AM; 50 kW; SAN FRANCISCO, CA; Owner: KGO-AM RADIO, INC.)
KNBR (680 AM; 50 kW; SAN FRANCISCO, CA; Owner: KNBR LICO, INC.)
KHTK (1140 AM; 50 kW; SACRAMENTO, CA; Owner: INFINITY RADIO SUBSIDIARY OPERATIONS INC.)
KTCT (1050 AM; 50 kW; SAN MATEO, CA; Owner: SUSQUEHANNA RADIO CORP.)
KFAX (1100 AM; 50 kW; SAN FRANCISCO, CA; Owner: GOLDEN GATE BROADCASTING CO, INC.)
KTRB (860 AM; 50 kW; MODESTO, CA; Owner: PAPPAS RADIO OF CALIFORNIA, A CALIFORNIA LIMITED PARTNERSHIP)
KSTE (650 AM; 25 kW; RANCHO CORDOVA, CA; Owner: AMFM RADIO LICENSES, L.L.C.)
Strongest FM radio stations in Ceres:
KADV (90.5 FM; MODESTO, CA; Owner: MODESTO ADVENTIST ACADEMY)
KEJC (93.9 FM; MODESTO, CA; Owner: MODESTO COMMUNICATIONS CORPORATION)
KOSO (93.1 FM; PATTERSON, CA; Owner: CAPSTAR TX LIMITED PARTNERSHIP)
KBES (89.5 FM; CERES, CA; Owner: BET NAHRAIN, INC.)
K238AC (95.5 FM; SALIDA, CA; Owner: FAMILY STATIONS, INC.)
KWNN (98.3 FM; TURLOCK, CA; Owner: SILVERADO BROADCASTING COMPANY)
KJSN (102.3 FM; MODESTO, CA; Owner: CAPSTAR TX LIMITED PARTNERSHIP)
K258AB (99.5 FM; MODESTO, CA; Owner: EDUCATIONAL MEDIA FOUNDATION)
KUOP (91.3 FM; STOCKTON, CA; Owner: UNIVERSITY OF THE PACIFIC)
KHOP (95.1 FM; OAKDALE, CA; Owner: CITADEL BROADCASTING COMPANY)
KHTN (104.7 FM; LOS BANOS, CA; Owner: BUCKLEY COMMUNICATIONS, INC.)
KJOY (99.3 FM; STOCKTON, CA; Owner: CITADEL BROADCASTING COMPANY)
KKSF-FM1 (103.7 FM; PLEASANTON, ETC., CA; Owner: AMFM RADIO LICENSES, L.L.C.)
KFRC-FM3 (99.7 FM; WALNUT CREEK, CA; Owner: INFINITY KFRC-FM, INC.)
KZBR-FM1 (95.7 FM; WALNUT CREEK, CA; Owner: BONNEVILLE HOLDING COMPANY)
KBLX-FM2 (102.9 FM; PLEASANTON, CA; Owner: ICBC BROADCAST HOLDINGS -CA, INC.)
KSOL-FM3 (98.9 FM; PLEASANTON, CA; Owner: TMS LICENSE CALIFORNIA, INC)
KISQ-FM3 (98.1 FM; CONCORD, CA; Owner: AMFM RADIO LICENSES, L.L.C.)
KMEL-FM1 (106.1 FM; CONCORD, CA; Owner: AMFM RADIO LICENSES, L.L.C.)
KBAA (94.5 FM; GILROY, CA; Owner: INFINITY RADIO OPERATIONS INC.)
TV broadcast stations around Ceres:
KBSV (Channel 23; CERES, CA; Owner: BET-NAHRAIN, INC.)
KACA-LP (Channel 61; MODESTO, CA; Owner: WORD OF GOD FELLOWSHIP, INC.)
KOVR (Channel 13; STOCKTON, CA; Owner: SCI - SACRAMENTO LICENSEE, LLC)
KXTV (Channel 10; SACRAMENTO, CA; Owner: KXTV, INC.)
KUVS (Channel 19; MODESTO, CA; Owner: KUVS LICENSE PARTNERSHIP, G.P.)
KCRA-TV (Channel 3; SACRAMENTO, CA; Owner: KCRA HEARST-ARGYLE TELEVISION, INC.)
KSPX (Channel 29; SACRAMENTO, CA; Owner: PAXSON SACRAMENTO LICENSE, INC.)
KQCA (Channel 58; STOCKTON, CA; Owner: KCRA HEARST-ARGYLE TELEVISION, INC.)
KTXL (Channel 40; SACRAMENTO, CA; Owner: CHANNEL 40, INC.)
KMAX-TV (Channel 31; SACRAMENTO, CA; Owner: UPN STATIONS GROUP INC.)
KVIE (Channel 6; SACRAMENTO, CA; Owner: KVIE, INC.)
National Bridge Inventory (NBI) Statistics 35 Number of bridges413ft / 126m Total length $3,028,000 Total costs888,897 Total average daily traffic111,593 Total average daily truck traffic
New bridges - historical statistics
1 1900-1909 2 1910-1919 3 1920-1929 3 1930-1939 1 1940-1949 1 1950-1959 14 1960-1969 3 1980-1989 2 1990-1999 1 2000-2009 3 2010-2019 1 2020-2022
See full National Bridge Inventory statistics for Ceres, CA
Home Mortgage Disclosure Act Aggregated Statistics For Year 2009(Based on 3 full and 5 partial tracts) A) FHA, FSA/RHS & VA B) Conventional C) Refinancings D) Home Improvement Loans E) Loans on Dwellings For 5+ Families F) Non-occupant Loans on G) Loans On Manufactured Number Average Value Number Average Value Number Average Value Number Average Value Number Average Value Number Average Value Number Average Value
LOANS ORIGINATED 273 $134,143 131 $99,480 145 $147,558 4 $59,562 1 $273,450 71 $85,695 0 $0 APPLICATIONS APPROVED, NOT ACCEPTED 27 $133,231 19 $112,689 20 $142,520 1 $51,330 0 $0 10 $78,333 0 $0 APPLICATIONS DENIED 49 $136,377 46 $120,325 124 $173,018 16 $68,464 0 $0 29 $91,563 1 $8,850 APPLICATIONS WITHDRAWN 31 $141,735 31 $106,838 61 $147,044 5 $52,338 0 $0 24 $93,395 0 $0 FILES CLOSED FOR INCOMPLETENESS 12 $149,070 5 $100,584 19 $146,448 1 $98,560 0 $0 2 $126,450 0 $0
Aggregated Statistics For Year 2008(Based on 3 full and 5 partial tracts) A) FHA, FSA/RHS & VA B) Conventional C) Refinancings D) Home Improvement Loans E) Loans on Dwellings For 5+ Families F) Non-occupant Loans on G) Loans On Manufactured Number Average Value Number Average Value Number Average Value Number Average Value Number Average Value Number Average Value Number Average Value
LOANS ORIGINATED 191 $166,345 211 $151,836 162 $162,042 16 $66,805 1 $596,270 73 $121,935 5 $41,390 APPLICATIONS APPROVED, NOT ACCEPTED 19 $153,020 43 $174,769 68 $192,636 9 $67,270 1 $586,500 18 $172,982 3 $73,327 APPLICATIONS DENIED 42 $159,552 84 $162,582 241 $212,933 42 $100,158 2 $549,635 31 $119,625 11 $33,053 APPLICATIONS WITHDRAWN 21 $162,488 52 $165,321 92 $191,450 16 $113,430 0 $0 25 $108,321 0 $0 FILES CLOSED FOR INCOMPLETENESS 12 $133,802 19 $212,771 20 $199,124 5 $107,804 0 $0 4 $121,395 0 $0
Aggregated Statistics For Year 2007(Based on 3 full and 5 partial tracts) A) FHA, FSA/RHS & VA B) Conventional C) Refinancings D) Home Improvement Loans E) Loans on Dwellings For 5+ Families F) Non-occupant Loans on G) Loans On Manufactured Number Average Value Number Average Value Number Average Value Number Average Value Number Average Value Number Average Value Number Average Value
LOANS ORIGINATED 11 $277,605 284 $212,778 657 $211,486 97 $126,113 4 $498,098 108 $212,253 5 $34,694 APPLICATIONS APPROVED, NOT ACCEPTED 1 $211,140 80 $215,426 177 $226,373 22 $120,971 1 $447,690 27 $216,359 2 $46,475 APPLICATIONS DENIED 4 $240,030 166 $233,055 617 $259,119 111 $120,823 0 $0 72 $265,654 11 $48,787 APPLICATIONS WITHDRAWN 2 $357,955 53 $183,126 255 $231,886 25 $222,596 1 $630,490 35 $201,833 2 $24,995 FILES CLOSED FOR INCOMPLETENESS 0 $0 29 $218,632 106 $254,307 6 $183,960 0 $0 9 $220,263 1 $337,960
Aggregated Statistics For Year 2006(Based on 3 full and 5 partial tracts) A) FHA, FSA/RHS & VA B) Conventional C) Refinancings D) Home Improvement Loans E) Loans on Dwellings For 5+ Families F) Non-occupant Loans on G) Loans On Manufactured Number Average Value Number Average Value Number Average Value Number Average Value Number Average Value Number Average Value Number Average Value
LOANS ORIGINATED 2 $139,465 785 $214,680 1,312 $228,539 181 $152,934 4 $2,042,918 219 $225,551 3 $107,200 APPLICATIONS APPROVED, NOT ACCEPTED 0 $0 163 $216,362 291 $243,354 49 $168,663 1 $884,700 42 $246,232 5 $85,238 APPLICATIONS DENIED 0 $0 348 $216,721 704 $245,555 142 $144,712 0 $0 100 $232,720 15 $86,647 APPLICATIONS WITHDRAWN 0 $0 149 $217,367 498 $241,208 43 $158,251 1 $406,960 41 $238,493 0 $0 FILES CLOSED FOR INCOMPLETENESS 0 $0 39 $228,049 114 $250,692 8 $170,585 0 $0 10 $232,983 0 $0
Aggregated Statistics For Year 2005(Based on 3 full and 5 partial tracts) A) FHA, FSA/RHS & VA B) Conventional C) Refinancings D) Home Improvement Loans E) Loans on Dwellings For 5+ Families F) Non-occupant Loans on G) Loans On Manufactured Number Average Value Number Average Value Number Average Value Number Average Value Number Average Value Number Average Value Number Average Value
LOANS ORIGINATED 3 $216,333 1,048 $206,009 1,621 $212,162 192 $144,990 1 $379,270 254 $202,823 3 $62,987 APPLICATIONS APPROVED, NOT ACCEPTED 2 $226,455 190 $196,722 294 $213,507 29 $140,677 1 $267,070 41 $219,681 16 $69,247 APPLICATIONS DENIED 0 $0 311 $200,896 649 $220,473 142 $129,501 4 $364,058 71 $206,764 18 $52,154 APPLICATIONS WITHDRAWN 0 $0 202 $208,100 550 $215,033 67 $152,705 0 $0 48 $201,421 5 $127,804 FILES CLOSED FOR INCOMPLETENESS 0 $0 50 $202,215 176 $213,870 13 $158,078 0 $0 9 $172,356 0 $0
Aggregated Statistics For Year 2004(Based on 3 full and 5 partial tracts) A) FHA, FSA/RHS & VA B) Conventional C) Refinancings D) Home Improvement Loans E) Loans on Dwellings For 5+ Families F) Non-occupant Loans on G) Loans On Manufactured Number Average Value Number Average Value Number Average Value Number Average Value Number Average Value Number Average Value Number Average Value
LOANS ORIGINATED 12 $195,595 864 $168,404 1,457 $166,469 159 $106,631 7 $1,748,660 211 $164,797 4 $52,742 APPLICATIONS APPROVED, NOT ACCEPTED 0 $0 157 $167,616 286 $174,132 28 $115,522 0 $0 37 $182,350 7 $69,886 APPLICATIONS DENIED 2 $219,420 229 $164,970 642 $169,179 109 $81,355 0 $0 73 $166,903 17 $51,332 APPLICATIONS WITHDRAWN 1 $271,080 136 $156,376 473 $166,867 41 $100,966 0 $0 41 $162,605 1 $13,270 FILES CLOSED FOR INCOMPLETENESS 0 $0 31 $189,699 202 $171,823 8 $89,362 0 $0 14 $130,339 0 $0
Aggregated Statistics For Year 2003(Based on 3 full and 5 partial tracts) A) FHA, FSA/RHS & VA B) Conventional C) Refinancings D) Home Improvement Loans E) Loans on Dwellings For 5+ Families F) Non-occupant Loans on Number Average Value Number Average Value Number Average Value Number Average Value Number Average Value Number Average Value
LOANS ORIGINATED 57 $166,560 579 $145,501 2,068 $136,048 78 $40,632 4 $1,439,080 242 $127,723 APPLICATIONS APPROVED, NOT ACCEPTED 4 $180,882 91 $148,357 296 $141,898 24 $36,379 0 $0 31 $140,189 APPLICATIONS DENIED 6 $164,970 125 $135,203 635 $139,640 75 $34,304 1 $235,330 51 $129,083 APPLICATIONS WITHDRAWN 13 $149,522 87 $156,159 541 $146,021 14 $43,284 2 $349,900 35 $127,279 FILES CLOSED FOR INCOMPLETENESS 1 $162,000 14 $158,571 98 $135,163 5 $39,784 0 $0 7 $90,294
Aggregated Statistics For Year 2002(Based on 1 partial tract) A) FHA, FSA/RHS & VA B) Conventional C) Refinancings D) Home Improvement Loans E) Loans on Dwellings For 5+ Families F) Non-occupant Loans on Number Average Value Number Average Value Number Average Value Number Average Value Number Average Value Number Average Value
LOANS ORIGINATED 9 $152,828 74 $138,363 130 $110,600 12 $22,560 2 $2,125,160 20 $116,718 APPLICATIONS APPROVED, NOT ACCEPTED 0 $0 9 $95,403 27 $118,022 4 $20,738 0 $0 2 $83,400 APPLICATIONS DENIED 1 $144,020 14 $111,529 41 $114,627 13 $26,153 0 $0 3 $60,160 APPLICATIONS WITHDRAWN 0 $0 4 $100,265 26 $128,662 1 $31,900 0 $0 1 $119,410 FILES CLOSED FOR INCOMPLETENESS 1 $108,470 3 $88,720 13 $130,555 0 $0 0 $0 1 $164,070
Aggregated Statistics For Year 2001(Based on 1 partial tract) A) FHA, FSA/RHS & VA B) Conventional C) Refinancings D) Home Improvement Loans E) Loans on Dwellings For 5+ Families F) Non-occupant Loans on Number Average Value Number Average Value Number Average Value Number Average Value Number Average Value Number Average Value
LOANS ORIGINATED 33 $137,195 57 $112,882 99 $101,480 5 $16,590 1 $2,666,140 20 $94,750 APPLICATIONS APPROVED, NOT ACCEPTED 0 $0 11 $103,331 19 $101,464 1 $45,580 0 $0 1 $105,730 APPLICATIONS DENIED 2 $135,815 18 $62,944 55 $91,647 6 $18,230 1 $2,666,140 4 $78,845 APPLICATIONS WITHDRAWN 5 $63,988 14 $151,830 53 $95,862 3 $40,713 0 $0 2 $107,100 FILES CLOSED FOR INCOMPLETENESS 0 $0 1 $82,040 6 $115,457 0 $0 0 $0 0 $0
Aggregated Statistics For Year 2000(Based on 1 partial tract) A) FHA, FSA/RHS & VA B) Conventional C) Refinancings D) Home Improvement Loans E) Loans on Dwellings For 5+ Families F) Non-occupant Loans on Number Average Value Number Average Value Number Average Value Number Average Value Number Average Value Number Average Value
LOANS ORIGINATED 33 $107,944 52 $87,153 15 $74,379 7 $20,704 1 $386,480 6 $96,618 APPLICATIONS APPROVED, NOT ACCEPTED 3 $75,350 4 $75,428 5 $54,508 1 $27,350 0 $0 2 $45,120 APPLICATIONS DENIED 3 $89,327 19 $71,768 24 $61,792 5 $31,720 0 $0 7 $79,821 APPLICATIONS WITHDRAWN 2 $88,870 4 $86,365 17 $65,038 2 $15,950 0 $0 0 $0 FILES CLOSED FOR INCOMPLETENESS 0 $0 1 $31,900 3 $78,390 0 $0 0 $0 0 $0
Aggregated Statistics For Year 1999(Based on 1 full and 3 partial tracts) A) FHA, FSA/RHS & VA B) Conventional C) Refinancings D) Home Improvement Loans E) Loans on Dwellings For 5+ Families F) Non-occupant Loans on Number Average Value Number Average Value Number Average Value Number Average Value Number Average Value Number Average Value
LOANS ORIGINATED 173 $105,438 181 $93,126 358 $83,961 38 $27,104 6 $134,110 57 $71,336 APPLICATIONS APPROVED, NOT ACCEPTED 10 $103,137 22 $87,217 92 $77,221 22 $24,955 1 $87,230 8 $64,584 APPLICATIONS DENIED 27 $99,604 64 $66,179 245 $70,865 59 $21,784 1 $87,940 22 $65,598 APPLICATIONS WITHDRAWN 27 $95,581 33 $98,773 190 $76,440 6 $48,515 1 $62,740 15 $70,869 FILES CLOSED FOR INCOMPLETENESS 2 $115,020 4 $78,272 32 $87,131 1 $22,480 0 $0 3 $66,940
Detailed HMDA statistics for the following Tracts:
0025.01
, 0025.02 , 0026.02 , 0026.03 , 0026.04 , 0026.05 , 0027.01 , 0027.02
Private Mortgage Insurance Companies Aggregated Statistics For Year 2009(Based on 3 full and 5 partial tracts) A) Conventional B) Refinancings Number Average Value Number Average Value
LOANS ORIGINATED 22 $135,969 2 $133,720 APPLICATIONS APPROVED, NOT ACCEPTED 10 $176,171 2 $255,040 APPLICATIONS DENIED 6 $114,273 0 $0 APPLICATIONS WITHDRAWN 1 $120,320 0 $0 FILES CLOSED FOR INCOMPLETENESS 1 $199,700 0 $0
Aggregated Statistics For Year 2008(Based on 3 full and 5 partial tracts) A) Conventional B) Refinancings C) Non-occupant Loans on Number Average Value Number Average Value Number Average Value
LOANS ORIGINATED 89 $173,981 14 $262,090 4 $145,172 APPLICATIONS APPROVED, NOT ACCEPTED 36 $214,688 24 $294,656 0 $0 APPLICATIONS DENIED 16 $154,056 4 $473,592 7 $159,740 APPLICATIONS WITHDRAWN 9 $125,160 0 $0 4 $89,740 FILES CLOSED FOR INCOMPLETENESS 2 $157,135 2 $209,285 1 $289,340
Aggregated Statistics For Year 2007(Based on 3 full and 5 partial tracts) A) Conventional B) Refinancings C) Non-occupant Loans on Number Average Value Number Average Value Number Average Value
LOANS ORIGINATED 61 $266,311 56 $307,653 2 $199,145 APPLICATIONS APPROVED, NOT ACCEPTED 2 $335,495 14 $329,730 1 $253,000 APPLICATIONS DENIED 2 $205,200 3 $338,733 0 $0 APPLICATIONS WITHDRAWN 1 $294,610 2 $271,705 0 $0 FILES CLOSED FOR INCOMPLETENESS 1 $249,260 0 $0 0 $0
Aggregated Statistics For Year 2006(Based on 3 full and 5 partial tracts) A) Conventional B) Refinancings C) Non-occupant Loans on Number Average Value Number Average Value Number Average Value
LOANS ORIGINATED 12 $337,111 18 $320,363 3 $298,147 APPLICATIONS APPROVED, NOT ACCEPTED 1 $285,580 11 $296,656 0 $0 APPLICATIONS DENIED 1 $285,580 4 $241,500 0 $0 APPLICATIONS WITHDRAWN 0 $0 1 $254,400 0 $0 FILES CLOSED FOR INCOMPLETENESS 0 $0 1 $202,620 0 $0
Aggregated Statistics For Year 2005(Based on 3 full and 5 partial tracts) A) Conventional B) Refinancings C) Non-occupant Loans on Number Average Value Number Average Value Number Average Value
LOANS ORIGINATED 18 $302,369 21 $249,661 3 $279,123 APPLICATIONS APPROVED, NOT ACCEPTED 8 $312,886 5 $246,228 1 $256,140 APPLICATIONS DENIED 1 $319,380 1 $300,800 0 $0 APPLICATIONS WITHDRAWN 2 $308,220 6 $228,063 0 $0 FILES CLOSED FOR INCOMPLETENESS 19 $321,347 0 $0 0 $0
Aggregated Statistics For Year 2004(Based on 3 full and 5 partial tracts) A) Conventional B) Refinancings C) Non-occupant Loans on Number Average Value Number Average Value Number Average Value
LOANS ORIGINATED 49 $224,572 42 $211,503 7 $187,911 APPLICATIONS APPROVED, NOT ACCEPTED 16 $196,378 17 $220,616 5 $207,460 APPLICATIONS DENIED 1 $159,250 0 $0 1 $159,250 APPLICATIONS WITHDRAWN 4 $202,355 3 $195,653 1 $169,740 FILES CLOSED FOR INCOMPLETENESS 1 $166,320 0 $0 0 $0
Aggregated Statistics For Year 2003(Based on 3 full and 5 partial tracts) A) Conventional B) Refinancings C) Non-occupant Loans on Number Average Value Number Average Value Number Average Value
LOANS ORIGINATED 104 $187,292 114 $176,613 9 $150,762 APPLICATIONS APPROVED, NOT ACCEPTED 25 $167,836 42 $171,930 3 $158,310 APPLICATIONS DENIED 1 $275,750 3 $152,617 0 $0 APPLICATIONS WITHDRAWN 5 $177,912 5 $130,596 1 $51,850 FILES CLOSED FOR INCOMPLETENESS 0 $0 1 $176,000 0 $0
Aggregated Statistics For Year 2002(Based on 1 partial tract) A) Conventional B) Refinancings C) Non-occupant Loans on Number Average Value Number Average Value Number Average Value
LOANS ORIGINATED 15 $164,070 6 $148,727 1 $129,430 APPLICATIONS APPROVED, NOT ACCEPTED 4 $110,062 3 $124,573 2 $95,710 APPLICATIONS DENIED 0 $0 0 $0 0 $0 APPLICATIONS WITHDRAWN 0 $0 3 $139,460 0 $0 FILES CLOSED FOR INCOMPLETENESS 0 $0 0 $0 0 $0
Aggregated Statistics For Year 2001(Based on 1 partial tract) A) Conventional B) Refinancings C) Non-occupant Loans on Number Average Value Number Average Value Number Average Value
LOANS ORIGINATED 21 $126,221 9 $119,407 4 $93,658 APPLICATIONS APPROVED, NOT ACCEPTED 2 $119,860 0 $0 0 $0 APPLICATIONS DENIED 0 $0 1 $111,200 0 $0 APPLICATIONS WITHDRAWN 0 $0 0 $0 0 $0 FILES CLOSED FOR INCOMPLETENESS 0 $0 0 $0 0 $0
Aggregated Statistics For Year 2000(Based on 1 partial tract) A) Conventional B) Refinancings Number Average Value Number Average Value
LOANS ORIGINATED 12 $89,858 2 $95,250 APPLICATIONS APPROVED, NOT ACCEPTED 1 $68,360 2 $91,150 APPLICATIONS DENIED 1 $105,730 0 $0 APPLICATIONS WITHDRAWN 2 $103,455 0 $0 FILES CLOSED FOR INCOMPLETENESS 0 $0 0 $0
Aggregated Statistics For Year 1999(Based on 1 full and 3 partial tracts) A) Conventional B) Refinancings C) Non-occupant Loans on Number Average Value Number Average Value Number Average Value
LOANS ORIGINATED 52 $112,804 47 $110,104 4 $72,272 APPLICATIONS APPROVED, NOT ACCEPTED 2 $123,685 10 $108,629 2 $92,400 APPLICATIONS DENIED 2 $94,195 4 $87,890 1 $95,930 APPLICATIONS WITHDRAWN 3 $94,487 2 $145,140 0 $0 FILES CLOSED FOR INCOMPLETENESS 1 $52,580 1 $64,760 0 $0
Detailed PMIC statistics for the following Tracts:
0025.01
, 0025.02 , 0026.02 , 0026.03 , 0026.04 , 0026.05 , 0027.01 , 0027.02
Most common first names in Ceres, CA among deceased individuals Name Count Lived (average)
William 126 73.5 years John 120 74.2 years Mary 102 80.3 years James 96 70.7 years Robert 81 71.7 years Charles 70 72.8 years George 68 74.5 years Frank 54 75.6 years Dorothy 49 75.3 years Helen 42 76.0 years
Most common last names in Ceres, CA among deceased individuals Last name Count Lived (average)
Smith 60 70.4 years Jones 48 75.9 years Brown 35 74.0 years Taylor 35 71.3 years Davis 34 75.9 years Johnson 33 77.7 years Williams 27 71.2 years Baker 24 74.3 years Wilson 24 78.1 years Young 23 74.4 years
Ceres compared to California state average:
Median house value below state average. Black race population percentage below state average. Hispanic race population percentage above state average. Length of stay since moving in above state average. Percentage of population with a bachelor's degree or higher significantly below state average.
#74 on the list of "Top 101 cities with largest percentage of females in occupations: farming, fishing, and forestry occupations (population 5,000+)"
#96 on the list of "Top 101 cities with the highest number of auto thefts per 100,000 residents, excludes tourist destinations and others with a lot of outsiders visiting based on city industries data (population 5,000+)"
#24 on the list of "Top 101 counties with the highest Particulate Matter (PM2.5 ) Annual air pollution readings in 2012 (µg/m3 )"
#26 on the list of "Top 101 counties with the highest Nitrogen Dioxide air pollution readings in 2012 (ppm)"
#28 on the list of "Top 101 counties with the highest ground withdrawal of fresh water for public supply"
#36 on the list of "Top 101 counties with the highest Particulate Matter (PM10 ) Annual air pollution readings in 2012 (µg/m3 )"
#56 on the list of "Top 101 counties with the lowest percentage of residents relocating from foreign countries between 2010 and 2011 (pop. 50,000+)"
Top Patent Applicants
William Winterberg (2)
Svatoboj Otruba (2)
Michael Cousins (1)
Roger Hartel Neudeck (1)
Alan Dewayne Walker, Sr. (1)
Christopher Alvarez (1)
Frederick J. Lane (1)
Jerry Castro (1)
Shannon Melissa King (1)
Jarod Lee King (1)
Total of 13 patent applications in 2008-2024.


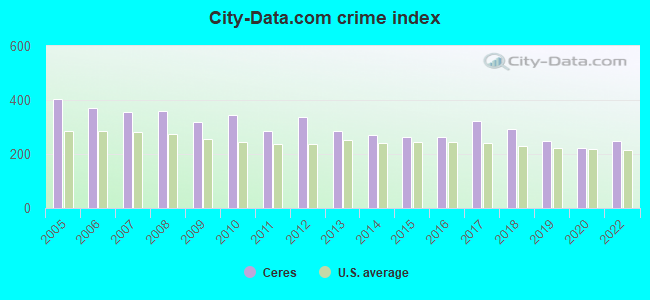
 Recent articles from our blog. Our writers, many of them Ph.D. graduates or candidates, create easy-to-read articles on a wide variety of topics.

 (4.6 miles
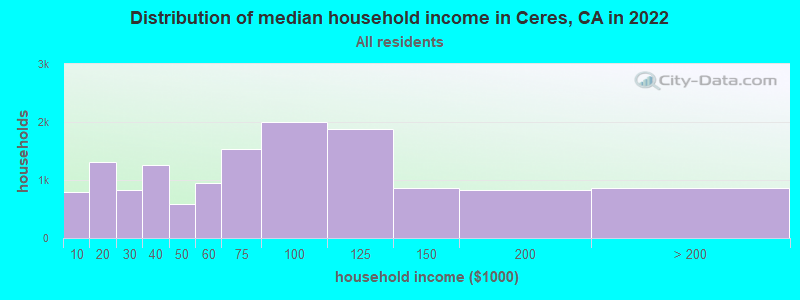
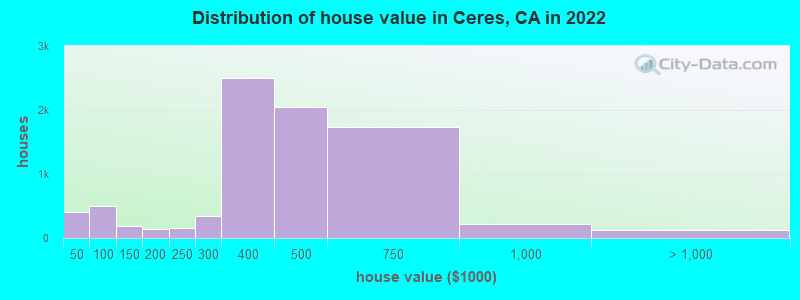
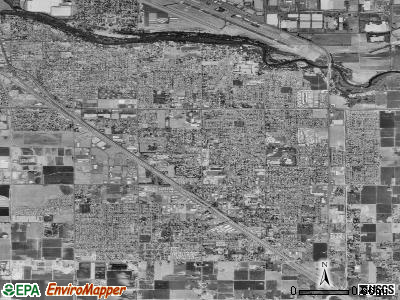
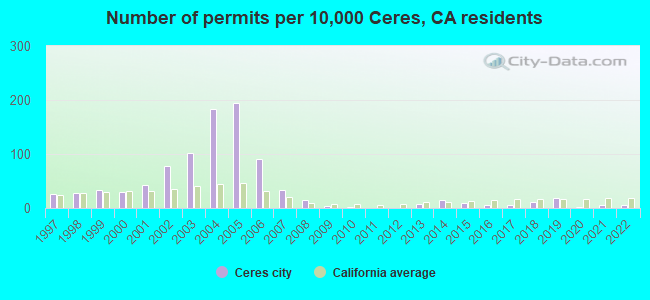
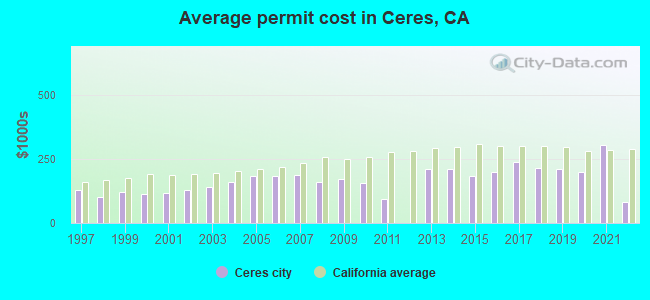
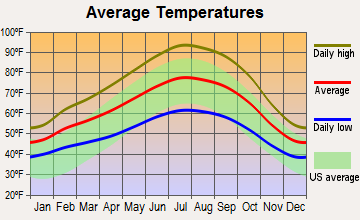
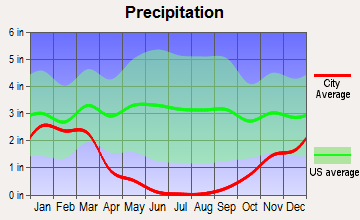
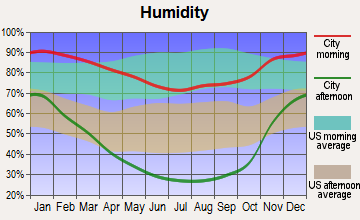
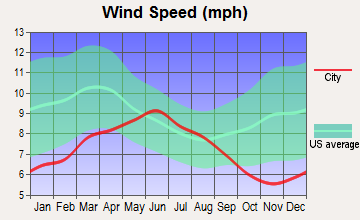
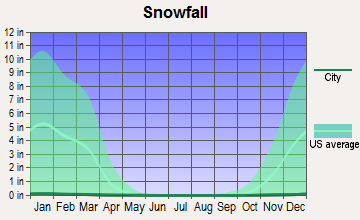


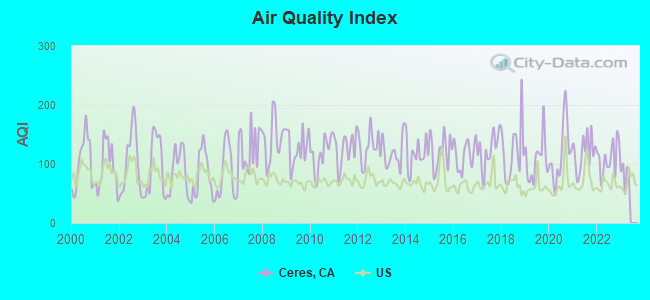
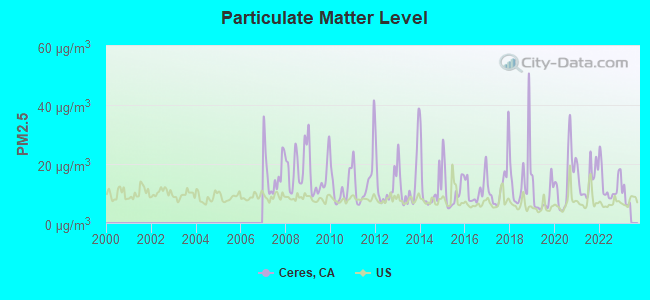
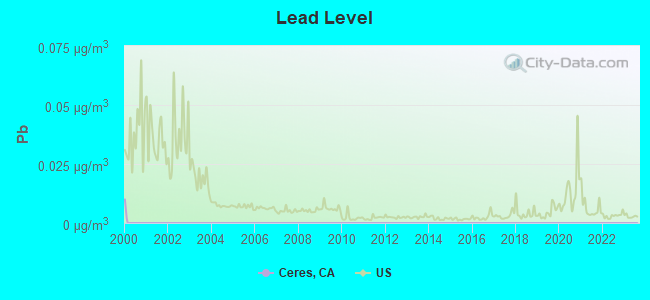

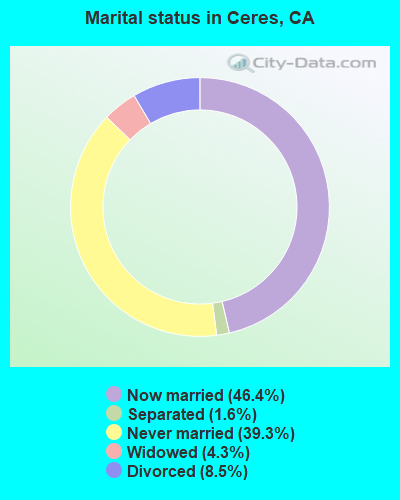
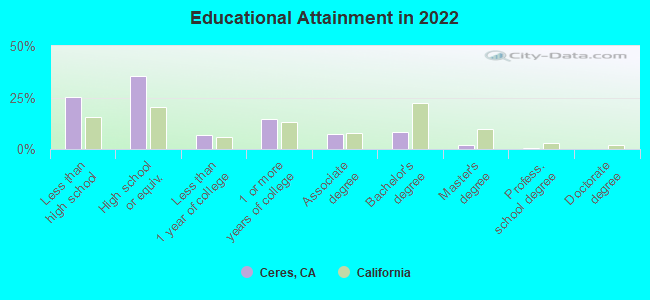
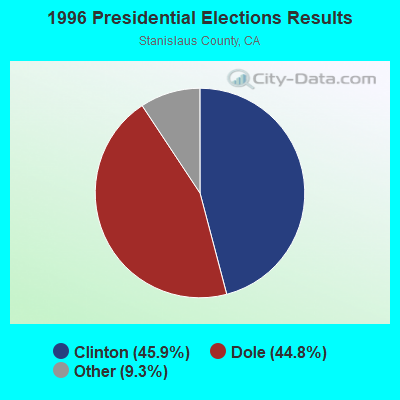
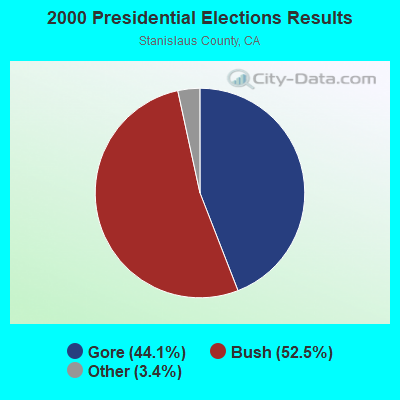
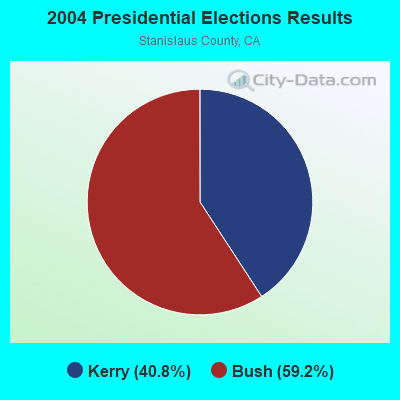
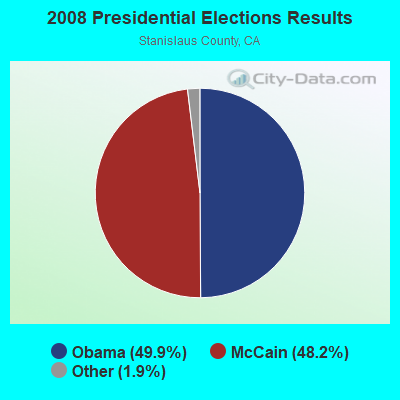
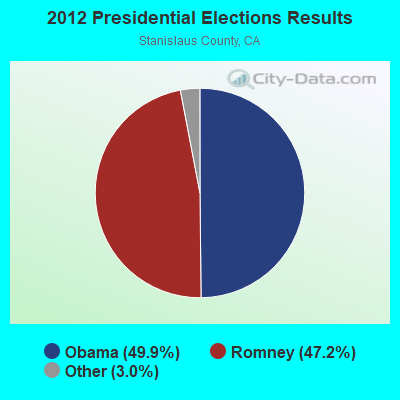

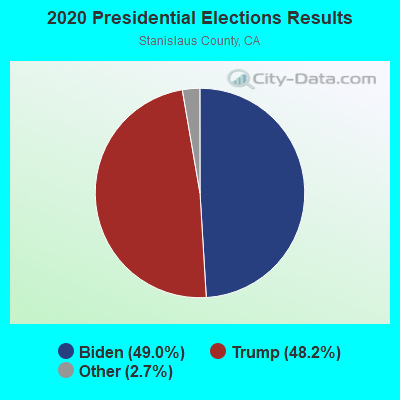
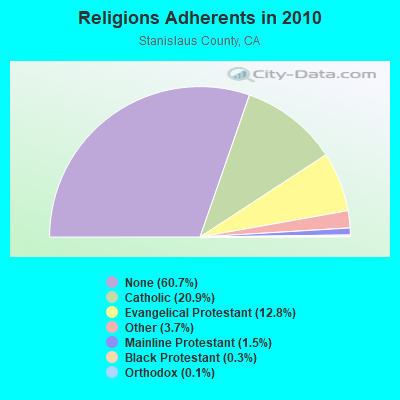
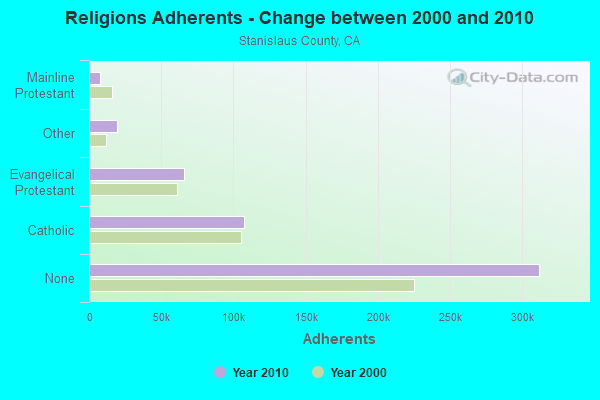
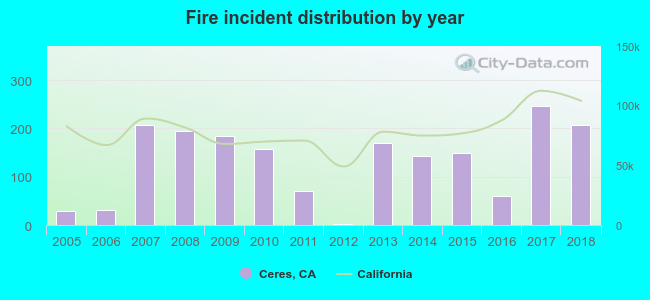 According to the data from the years 2005 - 2018 the average number of fires per year is 132. The highest number of reported fires - 247 took place in 2017, and the least - 2 in 2012. The data has a growing trend.
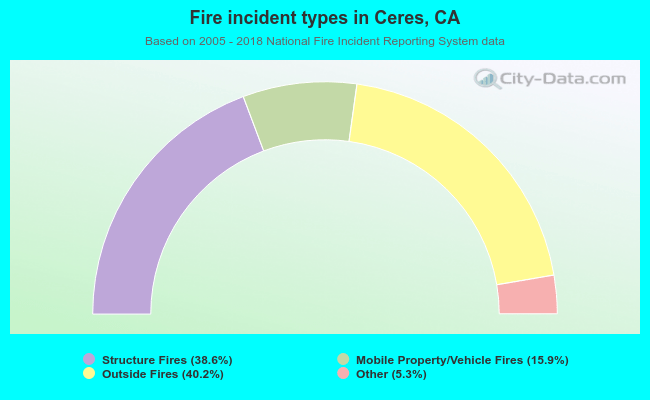 When looking into fire subcategories, the most reports belonged to: Outside Fires (40.2%), and Structure Fires (38.6%).