Sylvania, Ohio Submit your own pictures of this city and show them to the world
OSM Map
General Map
Google Map
MSN Map
OSM Map
General Map
Google Map
MSN Map
OSM Map
General Map
Google Map
MSN Map
OSM Map
General Map
Google Map
MSN Map
Please wait while loading the map...
Population in 2022: 19,051 (100% urban, 0% rural). Population change since 2000: +2.0%Males: 9,285 Females: 9,766
March 2022 cost of living index in Sylvania: 92.2 (less than average, U.S. average is 100) Percentage of residents living in poverty in 2022: 6.9%for White Non-Hispanic residents , 24.8% for Black residents , 3.4% for Hispanic or Latino residents , 28.1% for other race residents , 9.5% for two or more races residents )
Profiles of local businesses
Business Search - 14 Million verified businesses
Data:
Median household income ($)
Median household income (% change since 2000)
Household income diversity
Ratio of average income to average house value (%)
Ratio of average income to average rent
Median household income ($) - White
Median household income ($) - Black or African American
Median household income ($) - Asian
Median household income ($) - Hispanic or Latino
Median household income ($) - American Indian and Alaska Native
Median household income ($) - Multirace
Median household income ($) - Other Race
Median household income for houses/condos with a mortgage ($)
Median household income for apartments without a mortgage ($)
Races - White alone (%)
Races - White alone (% change since 2000)
Races - Black alone (%)
Races - Black alone (% change since 2000)
Races - American Indian alone (%)
Races - American Indian alone (% change since 2000)
Races - Asian alone (%)
Races - Asian alone (% change since 2000)
Races - Hispanic (%)
Races - Hispanic (% change since 2000)
Races - Native Hawaiian and Other Pacific Islander alone (%)
Races - Native Hawaiian and Other Pacific Islander alone (% change since 2000)
Races - Two or more races (%)
Races - Two or more races (% change since 2000)
Races - Other race alone (%)
Races - Other race alone (% change since 2000)
Racial diversity
Unemployment (%)
Unemployment (% change since 2000)
Unemployment (%) - White
Unemployment (%) - Black or African American
Unemployment (%) - Asian
Unemployment (%) - Hispanic or Latino
Unemployment (%) - American Indian and Alaska Native
Unemployment (%) - Multirace
Unemployment (%) - Other Race
Population density (people per square mile)
Population - Males (%)
Population - Females (%)
Population - Males (%) - White
Population - Males (%) - Black or African American
Population - Males (%) - Asian
Population - Males (%) - Hispanic or Latino
Population - Males (%) - American Indian and Alaska Native
Population - Males (%) - Multirace
Population - Males (%) - Other Race
Population - Females (%) - White
Population - Females (%) - Black or African American
Population - Females (%) - Asian
Population - Females (%) - Hispanic or Latino
Population - Females (%) - American Indian and Alaska Native
Population - Females (%) - Multirace
Population - Females (%) - Other Race
Coronavirus confirmed cases (Apr 27, 2024)
Deaths caused by coronavirus (Apr 27, 2024)
Coronavirus confirmed cases (per 100k population) (Apr 27, 2024)
Deaths caused by coronavirus (per 100k population) (Apr 27, 2024)
Daily increase in number of cases (Apr 27, 2024)
Weekly increase in number of cases (Apr 27, 2024)
Cases doubled (in days) (Apr 27, 2024)
Hospitalized patients (Apr 18, 2022)
Negative test results (Apr 18, 2022)
Total test results (Apr 18, 2022)
COVID Vaccine doses distributed (per 100k population) (Sep 19, 2023)
COVID Vaccine doses administered (per 100k population) (Sep 19, 2023)
COVID Vaccine doses distributed (Sep 19, 2023)
COVID Vaccine doses administered (Sep 19, 2023)
Likely homosexual households (%)
Likely homosexual households (% change since 2000)
Likely homosexual households - Lesbian couples (%)
Likely homosexual households - Lesbian couples (% change since 2000)
Likely homosexual households - Gay men (%)
Likely homosexual households - Gay men (% change since 2000)
Cost of living index
Median gross rent ($)
Median contract rent ($)
Median monthly housing costs ($)
Median house or condo value ($)
Median house or condo value ($ change since 2000)
Mean house or condo value by units in structure - 1, detached ($)
Mean house or condo value by units in structure - 1, attached ($)
Mean house or condo value by units in structure - 2 ($)
Mean house or condo value by units in structure by units in structure - 3 or 4 ($)
Mean house or condo value by units in structure - 5 or more ($)
Mean house or condo value by units in structure - Boat, RV, van, etc. ($)
Mean house or condo value by units in structure - Mobile home ($)
Median house or condo value ($) - White
Median house or condo value ($) - Black or African American
Median house or condo value ($) - Asian
Median house or condo value ($) - Hispanic or Latino
Median house or condo value ($) - American Indian and Alaska Native
Median house or condo value ($) - Multirace
Median house or condo value ($) - Other Race
Median resident age
Resident age diversity
Median resident age - Males
Median resident age - Females
Median resident age - White
Median resident age - Black or African American
Median resident age - Asian
Median resident age - Hispanic or Latino
Median resident age - American Indian and Alaska Native
Median resident age - Multirace
Median resident age - Other Race
Median resident age - Males - White
Median resident age - Males - Black or African American
Median resident age - Males - Asian
Median resident age - Males - Hispanic or Latino
Median resident age - Males - American Indian and Alaska Native
Median resident age - Males - Multirace
Median resident age - Males - Other Race
Median resident age - Females - White
Median resident age - Females - Black or African American
Median resident age - Females - Asian
Median resident age - Females - Hispanic or Latino
Median resident age - Females - American Indian and Alaska Native
Median resident age - Females - Multirace
Median resident age - Females - Other Race
Commute - mean travel time to work (minutes)
Travel time to work - Less than 5 minutes (%)
Travel time to work - Less than 5 minutes (% change since 2000)
Travel time to work - 5 to 9 minutes (%)
Travel time to work - 5 to 9 minutes (% change since 2000)
Travel time to work - 10 to 19 minutes (%)
Travel time to work - 10 to 19 minutes (% change since 2000)
Travel time to work - 20 to 29 minutes (%)
Travel time to work - 20 to 29 minutes (% change since 2000)
Travel time to work - 30 to 39 minutes (%)
Travel time to work - 30 to 39 minutes (% change since 2000)
Travel time to work - 40 to 59 minutes (%)
Travel time to work - 40 to 59 minutes (% change since 2000)
Travel time to work - 60 to 89 minutes (%)
Travel time to work - 60 to 89 minutes (% change since 2000)
Travel time to work - 90 or more minutes (%)
Travel time to work - 90 or more minutes (% change since 2000)
Marital status - Never married (%)
Marital status - Now married (%)
Marital status - Separated (%)
Marital status - Widowed (%)
Marital status - Divorced (%)
Median family income ($)
Median family income (% change since 2000)
Median non-family income ($)
Median non-family income (% change since 2000)
Median per capita income ($)
Median per capita income (% change since 2000)
Median family income ($) - White
Median family income ($) - Black or African American
Median family income ($) - Asian
Median family income ($) - Hispanic or Latino
Median family income ($) - American Indian and Alaska Native
Median family income ($) - Multirace
Median family income ($) - Other Race
Median year house/condo built
Median year apartment built
Year house built - Built 2005 or later (%)
Year house built - Built 2000 to 2004 (%)
Year house built - Built 1990 to 1999 (%)
Year house built - Built 1980 to 1989 (%)
Year house built - Built 1970 to 1979 (%)
Year house built - Built 1960 to 1969 (%)
Year house built - Built 1950 to 1959 (%)
Year house built - Built 1940 to 1949 (%)
Year house built - Built 1939 or earlier (%)
Average household size
Household density (households per square mile)
Average household size - White
Average household size - Black or African American
Average household size - Asian
Average household size - Hispanic or Latino
Average household size - American Indian and Alaska Native
Average household size - Multirace
Average household size - Other Race
Occupied housing units (%)
Vacant housing units (%)
Owner occupied housing units (%)
Renter occupied housing units (%)
Vacancy status - For rent (%)
Vacancy status - For sale only (%)
Vacancy status - Rented or sold, not occupied (%)
Vacancy status - For seasonal, recreational, or occasional use (%)
Vacancy status - For migrant workers (%)
Vacancy status - Other vacant (%)
Residents with income below the poverty level (%)
Residents with income below 50% of the poverty level (%)
Children below poverty level (%)
Poor families by family type - Married-couple family (%)
Poor families by family type - Male, no wife present (%)
Poor families by family type - Female, no husband present (%)
Poverty status for native-born residents (%)
Poverty status for foreign-born residents (%)
Poverty among high school graduates not in families (%)
Poverty among people who did not graduate high school not in families (%)
Residents with income below the poverty level (%) - White
Residents with income below the poverty level (%) - Black or African American
Residents with income below the poverty level (%) - Asian
Residents with income below the poverty level (%) - Hispanic or Latino
Residents with income below the poverty level (%) - American Indian and Alaska Native
Residents with income below the poverty level (%) - Multirace
Residents with income below the poverty level (%) - Other Race
Air pollution - Air Quality Index (AQI)
Air pollution - CO
Air pollution - NO2
Air pollution - SO2
Air pollution - Ozone
Air pollution - PM10
Air pollution - PM25
Air pollution - Pb
Crime - Murders per 100,000 population
Crime - Rapes per 100,000 population
Crime - Robberies per 100,000 population
Crime - Assaults per 100,000 population
Crime - Burglaries per 100,000 population
Crime - Thefts per 100,000 population
Crime - Auto thefts per 100,000 population
Crime - Arson per 100,000 population
Crime - City-data.com crime index
Crime - Violent crime index
Crime - Property crime index
Crime - Murders per 100,000 population (5 year average)
Crime - Rapes per 100,000 population (5 year average)
Crime - Robberies per 100,000 population (5 year average)
Crime - Assaults per 100,000 population (5 year average)
Crime - Burglaries per 100,000 population (5 year average)
Crime - Thefts per 100,000 population (5 year average)
Crime - Auto thefts per 100,000 population (5 year average)
Crime - Arson per 100,000 population (5 year average)
Crime - City-data.com crime index (5 year average)
Crime - Violent crime index (5 year average)
Crime - Property crime index (5 year average)
1996 Presidential Elections Results (%) - Democratic Party (Clinton)
1996 Presidential Elections Results (%) - Republican Party (Dole)
1996 Presidential Elections Results (%) - Other
2000 Presidential Elections Results (%) - Democratic Party (Gore)
2000 Presidential Elections Results (%) - Republican Party (Bush)
2000 Presidential Elections Results (%) - Other
2004 Presidential Elections Results (%) - Democratic Party (Kerry)
2004 Presidential Elections Results (%) - Republican Party (Bush)
2004 Presidential Elections Results (%) - Other
2008 Presidential Elections Results (%) - Democratic Party (Obama)
2008 Presidential Elections Results (%) - Republican Party (McCain)
2008 Presidential Elections Results (%) - Other
2012 Presidential Elections Results (%) - Democratic Party (Obama)
2012 Presidential Elections Results (%) - Republican Party (Romney)
2012 Presidential Elections Results (%) - Other
2016 Presidential Elections Results (%) - Democratic Party (Clinton)
2016 Presidential Elections Results (%) - Republican Party (Trump)
2016 Presidential Elections Results (%) - Other
2020 Presidential Elections Results (%) - Democratic Party (Biden)
2020 Presidential Elections Results (%) - Republican Party (Trump)
2020 Presidential Elections Results (%) - Other
Ancestries Reported - Arab (%)
Ancestries Reported - Czech (%)
Ancestries Reported - Danish (%)
Ancestries Reported - Dutch (%)
Ancestries Reported - English (%)
Ancestries Reported - French (%)
Ancestries Reported - French Canadian (%)
Ancestries Reported - German (%)
Ancestries Reported - Greek (%)
Ancestries Reported - Hungarian (%)
Ancestries Reported - Irish (%)
Ancestries Reported - Italian (%)
Ancestries Reported - Lithuanian (%)
Ancestries Reported - Norwegian (%)
Ancestries Reported - Polish (%)
Ancestries Reported - Portuguese (%)
Ancestries Reported - Russian (%)
Ancestries Reported - Scotch-Irish (%)
Ancestries Reported - Scottish (%)
Ancestries Reported - Slovak (%)
Ancestries Reported - Subsaharan African (%)
Ancestries Reported - Swedish (%)
Ancestries Reported - Swiss (%)
Ancestries Reported - Ukrainian (%)
Ancestries Reported - United States (%)
Ancestries Reported - Welsh (%)
Ancestries Reported - West Indian (%)
Ancestries Reported - Other (%)
Educational Attainment - No schooling completed (%)
Educational Attainment - Less than high school (%)
Educational Attainment - High school or equivalent (%)
Educational Attainment - Less than 1 year of college (%)
Educational Attainment - 1 or more years of college (%)
Educational Attainment - Associate degree (%)
Educational Attainment - Bachelor's degree (%)
Educational Attainment - Master's degree (%)
Educational Attainment - Professional school degree (%)
Educational Attainment - Doctorate degree (%)
School Enrollment - Nursery, preschool (%)
School Enrollment - Kindergarten (%)
School Enrollment - Grade 1 to 4 (%)
School Enrollment - Grade 5 to 8 (%)
School Enrollment - Grade 9 to 12 (%)
School Enrollment - College undergrad (%)
School Enrollment - Graduate or professional (%)
School Enrollment - Not enrolled in school (%)
School enrollment - Public schools (%)
School enrollment - Private schools (%)
School enrollment - Not enrolled (%)
Median number of rooms in houses and condos
Median number of rooms in apartments
Housing units lacking complete plumbing facilities (%)
Housing units lacking complete kitchen facilities (%)
Density of houses
Urban houses (%)
Rural houses (%)
Households with people 60 years and over (%)
Households with people 65 years and over (%)
Households with people 75 years and over (%)
Households with one or more nonrelatives (%)
Households with no nonrelatives (%)
Population in households (%)
Family households (%)
Nonfamily households (%)
Population in families (%)
Family households with own children (%)
Median number of bedrooms in owner occupied houses
Mean number of bedrooms in owner occupied houses
Median number of bedrooms in renter occupied houses
Mean number of bedrooms in renter occupied houses
Median number of vehichles in owner occupied houses
Mean number of vehichles in owner occupied houses
Median number of vehichles in renter occupied houses
Mean number of vehichles in renter occupied houses
Mortgage status - with mortgage (%)
Mortgage status - with second mortgage (%)
Mortgage status - with home equity loan (%)
Mortgage status - with both second mortgage and home equity loan (%)
Mortgage status - without a mortgage (%)
Average family size
Average family size - White
Average family size - Black or African American
Average family size - Asian
Average family size - Hispanic or Latino
Average family size - American Indian and Alaska Native
Average family size - Multirace
Average family size - Other Race
Geographical mobility - Same house 1 year ago (%)
Geographical mobility - Moved within same county (%)
Geographical mobility - Moved from different county within same state (%)
Geographical mobility - Moved from different state (%)
Geographical mobility - Moved from abroad (%)
Place of birth - Born in state of residence (%)
Place of birth - Born in other state (%)
Place of birth - Native, outside of US (%)
Place of birth - Foreign born (%)
Housing units in structures - 1, detached (%)
Housing units in structures - 1, attached (%)
Housing units in structures - 2 (%)
Housing units in structures - 3 or 4 (%)
Housing units in structures - 5 to 9 (%)
Housing units in structures - 10 to 19 (%)
Housing units in structures - 20 to 49 (%)
Housing units in structures - 50 or more (%)
Housing units in structures - Mobile home (%)
Housing units in structures - Boat, RV, van, etc. (%)
House/condo owner moved in on average (years ago)
Renter moved in on average (years ago)
Year householder moved into unit - Moved in 1999 to March 2000 (%)
Year householder moved into unit - Moved in 1995 to 1998 (%)
Year householder moved into unit - Moved in 1990 to 1994 (%)
Year householder moved into unit - Moved in 1980 to 1989 (%)
Year householder moved into unit - Moved in 1970 to 1979 (%)
Year householder moved into unit - Moved in 1969 or earlier (%)
Means of transportation to work - Drove car alone (%)
Means of transportation to work - Carpooled (%)
Means of transportation to work - Public transportation (%)
Means of transportation to work - Bus or trolley bus (%)
Means of transportation to work - Streetcar or trolley car (%)
Means of transportation to work - Subway or elevated (%)
Means of transportation to work - Railroad (%)
Means of transportation to work - Ferryboat (%)
Means of transportation to work - Taxicab (%)
Means of transportation to work - Motorcycle (%)
Means of transportation to work - Bicycle (%)
Means of transportation to work - Walked (%)
Means of transportation to work - Other means (%)
Working at home (%)
Industry diversity
Most Common Industries - Agriculture, forestry, fishing and hunting, and mining (%)
Most Common Industries - Agriculture, forestry, fishing and hunting (%)
Most Common Industries - Mining, quarrying, and oil and gas extraction (%)
Most Common Industries - Construction (%)
Most Common Industries - Manufacturing (%)
Most Common Industries - Wholesale trade (%)
Most Common Industries - Retail trade (%)
Most Common Industries - Transportation and warehousing, and utilities (%)
Most Common Industries - Transportation and warehousing (%)
Most Common Industries - Utilities (%)
Most Common Industries - Information (%)
Most Common Industries - Finance and insurance, and real estate and rental and leasing (%)
Most Common Industries - Finance and insurance (%)
Most Common Industries - Real estate and rental and leasing (%)
Most Common Industries - Professional, scientific, and management, and administrative and waste management services (%)
Most Common Industries - Professional, scientific, and technical services (%)
Most Common Industries - Management of companies and enterprises (%)
Most Common Industries - Administrative and support and waste management services (%)
Most Common Industries - Educational services, and health care and social assistance (%)
Most Common Industries - Educational services (%)
Most Common Industries - Health care and social assistance (%)
Most Common Industries - Arts, entertainment, and recreation, and accommodation and food services (%)
Most Common Industries - Arts, entertainment, and recreation (%)
Most Common Industries - Accommodation and food services (%)
Most Common Industries - Other services, except public administration (%)
Most Common Industries - Public administration (%)
Occupation diversity
Most Common Occupations - Management, business, science, and arts occupations (%)
Most Common Occupations - Management, business, and financial occupations (%)
Most Common Occupations - Management occupations (%)
Most Common Occupations - Business and financial operations occupations (%)
Most Common Occupations - Computer, engineering, and science occupations (%)
Most Common Occupations - Computer and mathematical occupations (%)
Most Common Occupations - Architecture and engineering occupations (%)
Most Common Occupations - Life, physical, and social science occupations (%)
Most Common Occupations - Education, legal, community service, arts, and media occupations (%)
Most Common Occupations - Community and social service occupations (%)
Most Common Occupations - Legal occupations (%)
Most Common Occupations - Education, training, and library occupations (%)
Most Common Occupations - Arts, design, entertainment, sports, and media occupations (%)
Most Common Occupations - Healthcare practitioners and technical occupations (%)
Most Common Occupations - Health diagnosing and treating practitioners and other technical occupations (%)
Most Common Occupations - Health technologists and technicians (%)
Most Common Occupations - Service occupations (%)
Most Common Occupations - Healthcare support occupations (%)
Most Common Occupations - Protective service occupations (%)
Most Common Occupations - Fire fighting and prevention, and other protective service workers including supervisors (%)
Most Common Occupations - Law enforcement workers including supervisors (%)
Most Common Occupations - Food preparation and serving related occupations (%)
Most Common Occupations - Building and grounds cleaning and maintenance occupations (%)
Most Common Occupations - Personal care and service occupations (%)
Most Common Occupations - Sales and office occupations (%)
Most Common Occupations - Sales and related occupations (%)
Most Common Occupations - Office and administrative support occupations (%)
Most Common Occupations - Natural resources, construction, and maintenance occupations (%)
Most Common Occupations - Farming, fishing, and forestry occupations (%)
Most Common Occupations - Construction and extraction occupations (%)
Most Common Occupations - Installation, maintenance, and repair occupations (%)
Most Common Occupations - Production, transportation, and material moving occupations (%)
Most Common Occupations - Production occupations (%)
Most Common Occupations - Transportation occupations (%)
Most Common Occupations - Material moving occupations (%)
People in Group quarters - Institutionalized population (%)
People in Group quarters - Correctional institutions (%)
People in Group quarters - Federal prisons and detention centers (%)
People in Group quarters - Halfway houses (%)
People in Group quarters - Local jails and other confinement facilities (including police lockups) (%)
People in Group quarters - Military disciplinary barracks (%)
People in Group quarters - State prisons (%)
People in Group quarters - Other types of correctional institutions (%)
People in Group quarters - Nursing homes (%)
People in Group quarters - Hospitals/wards, hospices, and schools for the handicapped (%)
People in Group quarters - Hospitals/wards and hospices for chronically ill (%)
People in Group quarters - Hospices or homes for chronically ill (%)
People in Group quarters - Military hospitals or wards for chronically ill (%)
People in Group quarters - Other hospitals or wards for chronically ill (%)
People in Group quarters - Hospitals or wards for drug/alcohol abuse (%)
People in Group quarters - Mental (Psychiatric) hospitals or wards (%)
People in Group quarters - Schools, hospitals, or wards for the mentally retarded (%)
People in Group quarters - Schools, hospitals, or wards for the physically handicapped (%)
People in Group quarters - Institutions for the deaf (%)
People in Group quarters - Institutions for the blind (%)
People in Group quarters - Orthopedic wards and institutions for the physically handicapped (%)
People in Group quarters - Wards in general hospitals for patients who have no usual home elsewhere (%)
People in Group quarters - Wards in military hospitals for patients who have no usual home elsewhere (%)
People in Group quarters - Juvenile institutions (%)
People in Group quarters - Long-term care (%)
People in Group quarters - Homes for abused, dependent, and neglected children (%)
People in Group quarters - Residential treatment centers for emotionally disturbed children (%)
People in Group quarters - Training schools for juvenile delinquents (%)
People in Group quarters - Short-term care, detention or diagnostic centers for delinquent children (%)
People in Group quarters - Type of juvenile institution unknown (%)
People in Group quarters - Noninstitutionalized population (%)
People in Group quarters - College dormitories (includes college quarters off campus) (%)
People in Group quarters - Military quarters (%)
People in Group quarters - On base (%)
People in Group quarters - Barracks, unaccompanied personnel housing (UPH), (Enlisted/Officer), ;and similar group living quarters for military personnel (%)
People in Group quarters - Transient quarters for temporary residents (%)
People in Group quarters - Military ships (%)
People in Group quarters - Group homes (%)
People in Group quarters - Homes or halfway houses for drug/alcohol abuse (%)
People in Group quarters - Homes for the mentally ill (%)
People in Group quarters - Homes for the mentally retarded (%)
People in Group quarters - Homes for the physically handicapped (%)
People in Group quarters - Other group homes (%)
People in Group quarters - Religious group quarters (%)
People in Group quarters - Dormitories (%)
People in Group quarters - Agriculture workers' dormitories on farms (%)
People in Group quarters - Job Corps and vocational training facilities (%)
People in Group quarters - Other workers' dormitories (%)
People in Group quarters - Crews of maritime vessels (%)
People in Group quarters - Other nonhousehold living situations (%)
People in Group quarters - Other noninstitutional group quarters (%)
Residents speaking English at home (%)
Residents speaking English at home - Born in the United States (%)
Residents speaking English at home - Native, born elsewhere (%)
Residents speaking English at home - Foreign born (%)
Residents speaking Spanish at home (%)
Residents speaking Spanish at home - Born in the United States (%)
Residents speaking Spanish at home - Native, born elsewhere (%)
Residents speaking Spanish at home - Foreign born (%)
Residents speaking other language at home (%)
Residents speaking other language at home - Born in the United States (%)
Residents speaking other language at home - Native, born elsewhere (%)
Residents speaking other language at home - Foreign born (%)
Class of Workers - Employee of private company (%)
Class of Workers - Self-employed in own incorporated business (%)
Class of Workers - Private not-for-profit wage and salary workers (%)
Class of Workers - Local government workers (%)
Class of Workers - State government workers (%)
Class of Workers - Federal government workers (%)
Class of Workers - Self-employed workers in own not incorporated business and Unpaid family workers (%)
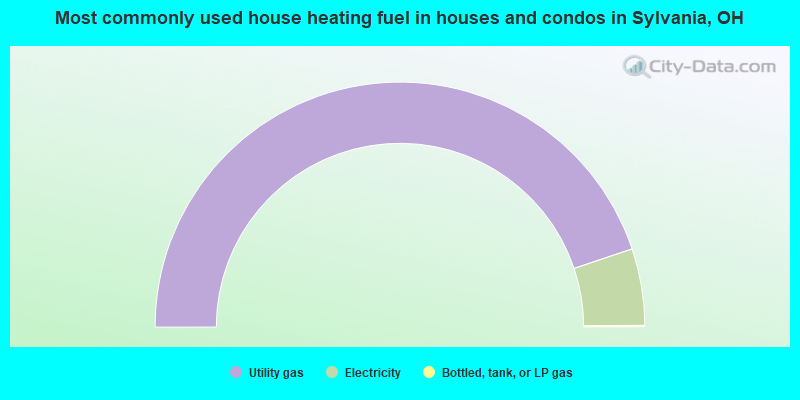
House heating fuel used in houses and condos - Utility gas (%)
House heating fuel used in houses and condos - Bottled, tank, or LP gas (%)
House heating fuel used in houses and condos - Electricity (%)
House heating fuel used in houses and condos - Fuel oil, kerosene, etc. (%)
House heating fuel used in houses and condos - Coal or coke (%)
House heating fuel used in houses and condos - Wood (%)
House heating fuel used in houses and condos - Solar energy (%)
House heating fuel used in houses and condos - Other fuel (%)
House heating fuel used in houses and condos - No fuel used (%)
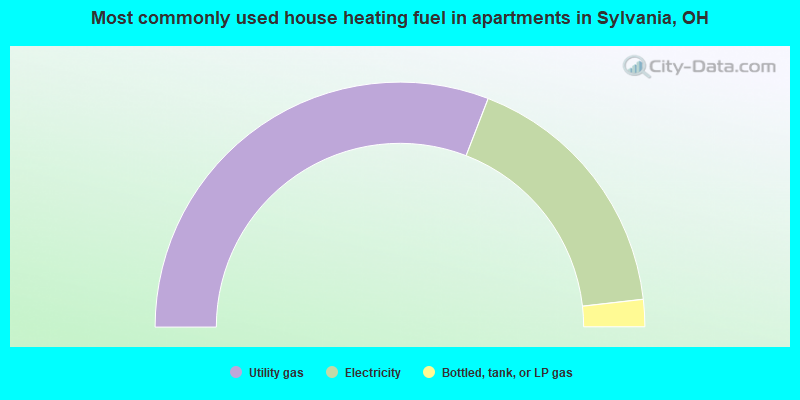
House heating fuel used in apartments - Utility gas (%)
House heating fuel used in apartments - Bottled, tank, or LP gas (%)
House heating fuel used in apartments - Electricity (%)
House heating fuel used in apartments - Fuel oil, kerosene, etc. (%)
House heating fuel used in apartments - Coal or coke (%)
House heating fuel used in apartments - Wood (%)
House heating fuel used in apartments - Solar energy (%)
House heating fuel used in apartments - Other fuel (%)
House heating fuel used in apartments - No fuel used (%)
Armed forces status - In Armed Forces (%)
Armed forces status - Civilian (%)
Armed forces status - Civilian - Veteran (%)
Armed forces status - Civilian - Nonveteran (%)
Fatal accidents locations in years 2005-2021
Fatal accidents locations in 2005
Fatal accidents locations in 2006
Fatal accidents locations in 2007
Fatal accidents locations in 2008
Fatal accidents locations in 2009
Fatal accidents locations in 2010
Fatal accidents locations in 2011
Fatal accidents locations in 2012
Fatal accidents locations in 2013
Fatal accidents locations in 2014
Fatal accidents locations in 2015
Fatal accidents locations in 2016
Fatal accidents locations in 2017
Fatal accidents locations in 2018
Fatal accidents locations in 2019
Fatal accidents locations in 2020
Fatal accidents locations in 2021
Alcohol use - People drinking some alcohol every month (%)
Alcohol use - People not drinking at all (%)
Alcohol use - Average days/month drinking alcohol
Alcohol use - Average drinks/week
Alcohol use - Average days/year people drink much
Audiometry - Average condition of hearing (%)
Audiometry - People that can hear a whisper from across a quiet room (%)
Audiometry - People that can hear normal voice from across a quiet room (%)
Audiometry - Ears ringing, roaring, buzzing (%)
Audiometry - Had a job exposure to loud noise (%)
Audiometry - Had off-work exposure to loud noise (%)
Blood Pressure & Cholesterol - Has high blood pressure (%)
Blood Pressure & Cholesterol - Checking blood pressure at home (%)
Blood Pressure & Cholesterol - Frequently checking blood cholesterol (%)
Blood Pressure & Cholesterol - Has high cholesterol level (%)
Consumer Behavior - Money monthly spent on food at supermarket/grocery store
Consumer Behavior - Money monthly spent on food at other stores
Consumer Behavior - Money monthly spent on eating out
Consumer Behavior - Money monthly spent on carryout/delivered foods
Consumer Behavior - Income spent on food at supermarket/grocery store (%)
Consumer Behavior - Income spent on food at other stores (%)
Consumer Behavior - Income spent on eating out (%)
Consumer Behavior - Income spent on carryout/delivered foods (%)
Current Health Status - General health condition (%)
Current Health Status - Blood donors (%)
Current Health Status - Has blood ever tested for HIV virus (%)
Current Health Status - Left-handed people (%)
Dermatology - People using sunscreen (%)
Diabetes - Diabetics (%)
Diabetes - Had a blood test for high blood sugar (%)
Diabetes - People taking insulin (%)
Diet Behavior & Nutrition - Diet health (%)
Diet Behavior & Nutrition - Milk product consumption (# of products/month)
Diet Behavior & Nutrition - Meals not home prepared (#/week)
Diet Behavior & Nutrition - Meals from fast food or pizza place (#/week)
Diet Behavior & Nutrition - Ready-to-eat foods (#/month)
Diet Behavior & Nutrition - Frozen meals/pizza (#/month)
Drug Use - People that ever used marijuana or hashish (%)
Drug Use - Ever used hard drugs (%)
Drug Use - Ever used any form of cocaine (%)
Drug Use - Ever used heroin (%)
Drug Use - Ever used methamphetamine (%)
Health Insurance - People covered by health insurance (%)
Kidney Conditions-Urology - Avg. # of times urinating at night
Medical Conditions - People with asthma (%)
Medical Conditions - People with anemia (%)
Medical Conditions - People with psoriasis (%)
Medical Conditions - People with overweight (%)
Medical Conditions - Elderly people having difficulties in thinking or remembering (%)
Medical Conditions - People who ever received blood transfusion (%)
Medical Conditions - People having trouble seeing even with glass/contacts (%)
Medical Conditions - People with arthritis (%)
Medical Conditions - People with gout (%)
Medical Conditions - People with congestive heart failure (%)
Medical Conditions - People with coronary heart disease (%)
Medical Conditions - People with angina pectoris (%)
Medical Conditions - People who ever had heart attack (%)
Medical Conditions - People who ever had stroke (%)
Medical Conditions - People with emphysema (%)
Medical Conditions - People with thyroid problem (%)
Medical Conditions - People with chronic bronchitis (%)
Medical Conditions - People with any liver condition (%)
Medical Conditions - People who ever had cancer or malignancy (%)
Mental Health - People who have little interest in doing things (%)
Mental Health - People feeling down, depressed, or hopeless (%)
Mental Health - People who have trouble sleeping or sleeping too much (%)
Mental Health - People feeling tired or having little energy (%)
Mental Health - People with poor appetite or overeating (%)
Mental Health - People feeling bad about themself (%)
Mental Health - People who have trouble concentrating on things (%)
Mental Health - People moving or speaking slowly or too fast (%)
Mental Health - People having thoughts they would be better off dead (%)
Oral Health - Average years since last visit a dentist
Oral Health - People embarrassed because of mouth (%)
Oral Health - People with gum disease (%)
Oral Health - General health of teeth and gums (%)
Oral Health - Average days a week using dental floss/device
Oral Health - Average days a week using mouthwash for dental problem
Oral Health - Average number of teeth
Pesticide Use - Households using pesticides to control insects (%)
Pesticide Use - Households using pesticides to kill weeds (%)
Physical Activity - People doing vigorous-intensity work activities (%)
Physical Activity - People doing moderate-intensity work activities (%)
Physical Activity - People walking or bicycling (%)
Physical Activity - People doing vigorous-intensity recreational activities (%)
Physical Activity - People doing moderate-intensity recreational activities (%)
Physical Activity - Average hours a day doing sedentary activities
Physical Activity - Average hours a day watching TV or videos
Physical Activity - Average hours a day using computer
Physical Functioning - People having limitations keeping them from working (%)
Physical Functioning - People limited in amount of work they can do (%)
Physical Functioning - People that need special equipment to walk (%)
Physical Functioning - People experiencing confusion/memory problems (%)
Physical Functioning - People requiring special healthcare equipment (%)
Prescription Medications - Average number of prescription medicines taking
Preventive Aspirin Use - Adults 40+ taking low-dose aspirin (%)
Reproductive Health - Vaginal deliveries (%)
Reproductive Health - Cesarean deliveries (%)
Reproductive Health - Deliveries resulted in a live birth (%)
Reproductive Health - Pregnancies resulted in a delivery (%)
Reproductive Health - Women breastfeeding newborns (%)
Reproductive Health - Women that had a hysterectomy (%)
Reproductive Health - Women that had both ovaries removed (%)
Reproductive Health - Women that have ever taken birth control pills (%)
Reproductive Health - Women taking birth control pills (%)
Reproductive Health - Women that have ever used Depo-Provera or injectables (%)
Reproductive Health - Women that have ever used female hormones (%)
Sexual Behavior - People 18+ that ever had sex (vaginal, anal, or oral) (%)
Sexual Behavior - Males 18+ that ever had vaginal sex with a woman (%)
Sexual Behavior - Males 18+ that ever performed oral sex on a woman (%)
Sexual Behavior - Males 18+ that ever had anal sex with a woman (%)
Sexual Behavior - Males 18+ that ever had any sex with a man (%)
Sexual Behavior - Females 18+ that ever had vaginal sex with a man (%)
Sexual Behavior - Females 18+ that ever performed oral sex on a man (%)
Sexual Behavior - Females 18+ that ever had anal sex with a man (%)
Sexual Behavior - Females 18+ that ever had any kind of sex with a woman (%)
Sexual Behavior - Average age people first had sex
Sexual Behavior - Average number of female sex partners in lifetime (males 18+)
Sexual Behavior - Average number of female vaginal sex partners in lifetime (males 18+)
Sexual Behavior - Average age people first performed oral sex on a woman (18+)
Sexual Behavior - Average number of woman performed oral sex on in lifetime (18+)
Sexual Behavior - Average number of male sex partners in lifetime (males 18+)
Sexual Behavior - Average number of male anal sex partners in lifetime (males 18+)
Sexual Behavior - Average age people first performed oral sex on a man (18+)
Sexual Behavior - Average number of male oral sex partners in lifetime (18+)
Sexual Behavior - People using protection when performing oral sex (%)
Sexual Behavior - Average number of times people have vaginal or anal sex a year
Sexual Behavior - People having sex without condom (%)
Sexual Behavior - Average number of male sex partners in lifetime (females 18+)
Sexual Behavior - Average number of male vaginal sex partners in lifetime (females 18+)
Sexual Behavior - Average number of female sex partners in lifetime (females 18+)
Sexual Behavior - Circumcised males 18+ (%)
Sleep Disorders - Average hours sleeping at night
Sleep Disorders - People that has trouble sleeping (%)
Smoking-Cigarette Use - People smoking cigarettes (%)
Taste & Smell - People 40+ having problems with smell (%)
Taste & Smell - People 40+ having problems with taste (%)
Taste & Smell - People 40+ that ever had wisdom teeth removed (%)
Taste & Smell - People 40+ that ever had tonsils teeth removed (%)
Taste & Smell - People 40+ that ever had a loss of consciousness because of a head injury (%)
Taste & Smell - People 40+ that ever had a broken nose or other serious injury to face or skull (%)
Taste & Smell - People 40+ that ever had two or more sinus infections (%)
Weight - Average height (inches)
Weight - Average weight (pounds)
Weight - Average BMI
Weight - People that are obese (%)
Weight - People that ever were obese (%)
Weight - People trying to lose weight (%)
According to our research of Ohio and other state lists, there were 12 registered sex offenders living in Sylvania, Ohio as of April 27, 2024 . The ratio of all residents to sex offenders in Sylvania is 1,565 to 1.The ratio of registered sex offenders to all residents in this city is much lower than the state average.
Officers per 1,000 residents here:
1.58Ohio average:
2.31
Latest news from Sylvania, OH collected exclusively by city-data.com from local newspapers, TV, and radio stations
Ancestries: German (24.5%), Polish (9.9%), American (7.6%), English (7.0%), Irish (6.7%), European (5.1%).
Current Local Time:
Land area: 5.79 square miles.
Population density: 3,289 people per square mile (average).
1,037 residents are foreign born (3.8% Asia , 0.8% Europe ).
Median real estate property taxes paid for housing units with mortgages in 2022: $4,636 (1.9%)Median real estate property taxes paid for housing units with no mortgage in 2022: $3,700 (1.9%)
Nearest city with pop. 50,000+: Toledo, OH
Nearest city with pop. 1,000,000+: Chicago, IL
Nearest cities:
Latitude: 41.71 N, Longitude: 83.70 W
Daytime population change due to commuting: +1,317 (+7.0%)Workers who live and work in this city: 2,275 (24.2%)
Property values in Sylvania, OH
Unemployment in December 2023:
Population change in the 1990s: +1,214 (+7.0%).
Most common occupations in Sylvania, OH (%)
Both Males Females
Preschool, kindergarten, elementary, and middle school teachers (5.6%)
Other sales and related occupations, including supervisors (4.8%)
Other management occupations, except farmers and farm managers (4.5%)
Sales representatives, services, wholesale and manufacturing (3.8%)
Registered nurses (3.8%)
Retail sales workers, except cashiers (3.4%)
Secretaries and administrative assistants (3.1%)
Sales representatives, services, wholesale and manufacturing (6.1%)
Other management occupations, except farmers and farm managers (5.7%)
Other sales and related occupations, including supervisors (5.4%)
Top executives (4.8%)
Other production occupations, including supervisors (3.8%)
Laborers and material movers, hand (3.4%)
Retail sales workers, except cashiers (3.3%)
Preschool, kindergarten, elementary, and middle school teachers (9.0%)
Registered nurses (7.3%)
Secretaries and administrative assistants (6.4%)
Other office and administrative support workers, including supervisors (5.0%)
Health technologists and technicians (4.3%)
Other sales and related occupations, including supervisors (4.1%)
Retail sales workers, except cashiers (3.6%)
Tornado activity:
Sylvania-area historical tornado activity is slightly above Ohio state average. It is 49% greater than the overall U.S. average.
On 4/11/1965, a category F4 (max. wind speeds 207-260 mph) tornado 6.1 miles away from the Sylvania city center killed 18 people and injured 236 people and caused between $5,000,000 and $50,000,000 in damages.
On 6/8/1953, a category F4 tornado 8.4 miles away from the city center killed 4 people and injured 18 people and caused between $50,000 and $500,000 in damages.
Earthquake activity:
Sylvania-area historical earthquake activity is significantly above Ohio state average. It is 31% smaller than the overall U.S. average. On 9/25/1998 at 19:52:52, a magnitude 5.2 (4.8 MB, 4.3 MS, 5.2 LG, 4.5 MW, Depth: 3.1 mi, Class: Moderate, Intensity: VI - VII) earthquake occurred 171.7 miles away from Sylvania center On 1/31/1986 at 16:46:43, a magnitude 5.0 (5.0 MB) earthquake occurred 131.6 miles away from the city center On 7/12/1986 at 08:19:37, a magnitude 4.5 (4.5 MB, Class: Light, Intensity: IV - V) earthquake occurred 88.4 miles away from Sylvania center On 7/27/1980 at 18:52:21, a magnitude 5.2 (5.1 MB, 4.7 MS, 5.0 UK, 5.2 UK) earthquake occurred 242.9 miles away from Sylvania center On 4/18/2008 at 09:36:59, a magnitude 5.4 (5.1 MB, 4.8 MS, 5.4 MW, 5.2 MW) earthquake occurred 315.9 miles away from the city center On 5/2/2015 at 16:23:07, a magnitude 4.2 (4.2 MW, Depth: 2.8 mi) earthquake occurred 95.8 miles away from the city center Magnitude types: regional Lg-wave magnitude (LG), body-wave magnitude (MB), surface-wave magnitude (MS), moment magnitude (MW) Natural disasters: The number of natural disasters in Lucas County (13) is near the US average (15).Major Disasters (Presidential) Declared: 8Emergencies Declared: 4Storms: 8, Floods: 7, Tornadoes: 4, Snowstorms: 2, Blizzard: 1, Hurricane: 1, Power Outage: 1, Wind: 1, Other: 1 (Note: some incidents may be assigned to more than one category). Hospitals in Sylvania: FLOWER HOSPITAL (Voluntary non-profit - Private, provides emergency services, 5200 HARROUN ROAD) Nursing Homes in Sylvania: GOERLICH CENTER (5320 HARROUN ROAD) KINGSTON CARE CENTER OF SYLVANIA (4121 KING ROAD) LAKE PARK NURSING FACILITY (5100 HARROUN RD) ROSARY CARE CENTER (6832 CONVENT BOULEVARD) SUNSET VILLAGE (9640 SYLVANIA-METAMORA ROAD) SYLVANIA CARE AND REHABILITATION CENTER (5757 WHITEFORD RD) Dialysis Facilities in Sylvania: DIALYSIS PARTNERS OF NW OHIO@ FLOWER HOSPITAL (5308 HARROUN RD., SUITE 60) SYLVANIA DIALYSIS CENTER (7635 W. SYLVANIA AVENUE) Home Health Centers in Sylvania: CARING HOME HEALTH SERVICES (5520 MONROE ST) GUARDIAN ANGEL HOME CARE, INC (5800 MONROE STREET, BLDG F, UNIT 10) Heliports located in Sylvania: Amtrak station near Sylvania: 10 miles: TOLEDO (415 EMERALD AVE.) Services: ticket office, fully wheelchair accessible, enclosed waiting area, public restrooms, public payphones, vending machines, free short-term parking, free long-term parking, call for car rental service, taxi stand, public transit connection.
Colleges/Universities in Sylvania: Lourdes University Full-time enrollment: 1,653; Location: 6832 Convent Blvd; Private, not-for-profit; Website: www.lourdes.edu; Offers Master's degree )
Ross College-Sylvania Full-time enrollment: 552; Location: 5834 Monroe Street, Suite F-J; Private, for-profit; Website: www.rosseducation.edu)
Colleges/universities with over 2000 students nearest to Sylvania:
University of Toledo (about 6 miles; Toledo, OH ; Full-time enrollment: 18,409)
Owens Community College (about 13 miles; Perrysburg, OH ; FT enrollment: 9,416)
Monroe County Community College (about 19 miles; Monroe, MI ; FT enrollment: 2,553)
Siena Heights University (about 21 miles; Adrian, MI ; FT enrollment: 2,009)
Bowling Green State University-Main Campus (about 24 miles; Bowling Green, OH ; FT enrollment: 16,357)
Northwest State Community College (about 36 miles; Archbold, OH ; FT enrollment: 2,406)
Eastern Michigan University (about 38 miles; Ypsilanti, MI ; FT enrollment: 18,395)
Public high schools in Sylvania: SYLVANIA NORTHVIEW HIGH SCHOOL Students: 1,292, Location: 5403 SILICA DR, Grades: 9-12)SYLVANIA SOUTHVIEW HIGH SCHOOL Students: 1,291, Location: 7225 SYLVANIA AVE, Grades: 9-12)SYLVANIA TIMBERSTONE JUNIOR HIGH SCHOOL Students: 584, Location: 9000 SYLVANIA AVE, Grades: 6-9)SYLVANIA ARBOR HILLS JUNIOR HIGH SCHOOL Students: 568, Location: 5334 WHITEFORD RD, Grades: 6-9)Private high school in Sylvania: TOLEDO ISLAMIC ACADEMY Students: 202, Location: 5225 ALEXIS RD, Grades: PK-12)
Public elementary/middle schools in Sylvania: SYLVANIA MCCORD JUNIOR HIGH SCHOOL Students: 634, Location: 4304 N MCCORD RD, Grades: 6-8)HILL VIEW ELEMENTARY SCHOOL Students: 349, Location: 5424 WHITEFORD RD, Grades: KG-6)MAPLEWOOD ELEMENTARY SCHOOL Students: 327, Location: 6769 MAPLEWOOD AVE, Grades: KG-5)SYLVAN ELEMENTARY SCHOOL Students: 318, Location: 4830 WICKFORD DR E, Grades: KG-5)CENTRAL TRAIL ELEMENTARY SCHOOL Location: 4321 MITCHAW RD, Grades: KG-6)
HIGHLAND ELEMENTARY SCHOOL Location: 7720 ERIE ST, Grades: KG-6)
Private elementary/middle schools in Sylvania: ST JOSEPH ELEMENTARY SCHOOL Students: 740, Location: 5411 MAIN ST, Grades: PK-8)
SYLVANIA FRANCISCAN ACADEMY Students: 198, Location: 5335 SILICA DR, Grades: PK-8)
See full list of schools located in Sylvania
Notable locations in Sylvania: (A) , Highland Meadows Country Club (B) , Sylvania Country Club (C) , Highland Meadows Golf Course (D) , Lucas County Emergency Medical Services Lifesquad 6 (E) , Sylvania Branch Library (F) , Sylvania Township Fire Department Station 1 (G) , Umbria Hall (H) , Sophia Counseling Center (I) , Saint Joseph Hall (J) , Saint Clare Hall (K) , Rosary Care Center (L) , Regina Hall (M) , Portiuncula (N) , Mother Adelaide Hall (O) , Maria Hall (P) , Madonna Hall (Q) , Lourdes Hall (R) , The Franciscan Center (S) , Duns Scotus Library (T) . Display/hide their locations on the map
Shopping Centers: (1) , Sylvania Country Squire Shopping Center (2) , Saxon Square Shopping Center (3) , Wickford Woods Shopping Center (4) . Display/hide their locations on the map
Churches in Sylvania include: (A) , First Congregational Church (B) , Reorganized Church of Jesus Christ of Latter Day Saints (C) , Saint Josephs Roman Catholic Church (D) , King of Glory Church (E) , Our Lady Queen of Peace Chapel (F) , Trinity House of Prayer (G) , Olivet Church (H) , First United Methodist Church (I) . Display/hide their locations on the map
Cemeteries: (1) , Porta Coeli Cemetery (2) , Ravine Cemetery (3) . Display/hide their locations on the map
Creek: (A) . Display/hide its location on the map
Park in Sylvania: (1) . Display/hide its location on the map
Tourist attractions:
Hotel:
Courts:
Birthplace of: Alissa Czisny - Figure skater, Becky Minger - Beauty pageant winner, Ralph Comstock - Baseball player, Sam Abell - Photographer, Terry Cook - Craftsman Truck series NASCAR driver (born : Feb 26, 1968).
Lucas County has a predicted average indoor radon screening level between 2 and 4 pCi/L (pico curies per liter) - Moderate Potential Drinking water stations with addresses in Sylvania and their reported violations in the past:
SPUYTEN DUYVAL GOLF CLUB (Population served: 206, Groundwater):
Past monitoring violations:
One routine major monitoring violation
Address: Building A-2 Serves NY, Population served: 25, Groundwater):
Past health violations:
MCL, Monthly (TCR) - In NOV-2006, Contaminant: Coliform. Follow-up actions: St Public Notif requested (NOV-13-2006), St Boil Water Order (NOV-13-2006), St Compliance achieved (NOV-13-2006), St Formal NOV issued (NOV-13-2006)
Past monitoring violations:
9 routine major monitoring violations
One minor monitoring violation
2 regular monitoring violations
Average household size: This city:
2.4 peopleOhio:
2.4 people
Percentage of family households: This city:
66.6%Whole state:
65.0%
Percentage of households with unmarried partners: This city:
4.8%Whole state:
6.8%
Likely homosexual households (counted as self-reported same-sex unmarried-partner households)
Lesbian couples: 0.4% of all households Gay men: 0.2% of all households
423 people in nursing facilities/skilled-nursing facilities in 2010people in in-patient hospice facilities in 2010people in nursing homes in 2000
Banks with branches in Sylvania (2011 data):
Fifth Third Bank: Courier Service Branch, Sylvania Branch, Bankmart Kroger Sylvania Branch. Info updated 2009/10/05: Bank assets: $114,540.4 mil, Deposits: $89,689.1 mil, headquarters in Cincinnati, OH, positive income , Commercial Lending Specialization, 1378 total offices , Holding Company: Fifth Third Bancorp
RBS Citizens, National Association: Sylvania at 4939 Holland Sylvania Rd, branch established on 1935/04/26; Monroe Street Kroger Branch at 6235 Monroe St, branch established on 2006/05/01. Info updated 2007/09/19: Bank assets: $106,940.6 mil, Deposits: $75,690.2 mil, headquarters in Providence, RI, positive income , 1135 total offices , Holding Company: Uk Financial Investments Limited
The Huntington National Bank: Sylvania Branch at 6370 Monroe Street, branch established on 1979/12/17. Info updated 2012/04/02: Bank assets: $54,183.4 mil, Deposits: $44,300.3 mil, headquarters in Columbus, OH, positive income , Commercial Lending Specialization, 878 total offices , Holding Company: Huntington Bancshares Incorporated
PNC Bank, National Association: Sylvania Branch at 6392 Monroe Street, branch established on 1989/08/14. Info updated 2012/03/20: Bank assets: $263,309.6 mil, Deposits: $197,343.0 mil, headquarters in Wilmington, DE, positive income , Commercial Lending Specialization, 3085 total offices , Holding Company: Pnc Financial Services Group, Inc., The
The State Bank and Trust Company: Sylvania Branch at 6401 Monroe Street, branch established on 1997/01/13. Info updated 2009/01/05: Bank assets: $624.9 mil, Deposits: $521.1 mil, headquarters in Defiance, OH, positive income , Commercial Lending Specialization, 19 total offices , Holding Company: Rurban Financial Corp.
KeyBank National Association: Sylvania Main Branch at 5604 North Main Street, branch established on 1900/09/07. Info updated 2008/03/03: Bank assets: $86,198.8 mil, Deposits: $64,214.8 mil, headquarters in Cleveland, OH, positive income , Commercial Lending Specialization, 1067 total offices , Holding Company: Keycorp
The Metamora State Bank: Sylvania Banking Center Branch at 8282 Erie Street, branch established on 1995/11/27. Info updated 2006/11/03: Bank assets: $60.3 mil, Deposits: $54.2 mil, headquarters in Metamora, OH, positive income , 2 total offices , Holding Company: Metamora Bancorp, Inc.
For population 15 years and over in Sylvania:
Never married: 23.0%Now married: 58.0%Separated: 1.8%Widowed: 6.7%Divorced: 10.4% For population 25 years and over in Sylvania:
High school or higher: 97.3%Bachelor's degree or higher: 49.9%Graduate or professional degree: 21.7%Unemployed: 2.1%Mean travel time to work (commute): 20.6 minutes
Education Gini index (Inequality in education) Here:
9.2Ohio average:
11.0
Religion statistics for Sylvania, OH (based on Lucas County data)
Religion Adherents Congregations Catholic 92,283 35 Evangelical Protestant 40,272 145 Mainline Protestant 39,991 115 Black Protestant 15,134 44 Other 7,578 29 Orthodox 2,680 4 None 243,877 -
Source: Clifford Grammich, Kirk Hadaway, Richard Houseal, Dale E.Jones, Alexei Krindatch, Richie Stanley and Richard H.Taylor. 2012. 2010 U.S.Religion Census: Religious Congregations & Membership Study. Association of Statisticians of American Religious Bodies. Jones, Dale E., et al. 2002. Congregations and Membership in the United States 2000. Nashville, TN: Glenmary Research Center. Graphs represent county-level data
Food Environment Statistics: Number of grocery stores : 74Here :
1.67 / 10,000 pop.Ohio :
1.89 / 10,000 pop.
Number of supercenters and club stores : 6Here :
0.14 / 10,000 pop.Ohio :
0.13 / 10,000 pop.
Number of convenience stores (no gas) : 98Here :
2.22 / 10,000 pop.Ohio :
1.25 / 10,000 pop.
Number of convenience stores (with gas) : 132Lucas County :
2.98 / 10,000 pop.State :
2.93 / 10,000 pop.
Number of full-service restaurants : 334Here :
7.55 / 10,000 pop.Ohio :
6.25 / 10,000 pop.
Adult obesity rate : Lucas County :
30.0%Ohio :
29.1%
Low-income preschool obesity rate : This county :
10.6%State :
11.9%
Health and Nutrition: Healthy diet rate : This city:
52.1%Ohio:
50.4%
Average overall health of teeth and gums : Sylvania:
50.0%State:
47.8%
People feeling badly about themselves : This city:
20.4%Ohio:
20.6%
People not drinking alcohol at all : Average hours sleeping at night : General health condition : Average condition of hearing : More about Health and Nutrition of Sylvania, OH Residents
Local government employment and payroll (March 2022)
Function
Full-time employees
Monthly full-time payroll
Average yearly full-time wage
Part-time employees
Monthly part-time payroll
Police Protection - Officers
33 $240,930 $87,611 0 $0 Judicial and Legal
16 $76,096 $57,072 7 $14,681 Streets and Highways
13 $77,872 $71,882 0 $0 Financial Administration
9 $62,731 $83,641 0 $0 Water Supply
9 $51,845 $69,127 0 $0 Parks and Recreation
9 $54,254 $72,339 0 $0 Sewerage
7 $46,270 $79,320 0 $0 Correction
5 $23,917 $57,401 0 $0 Police - Other
4 $21,007 $63,021 0 $0 Other and Unallocable
4 $31,445 $94,335 4 $4,801 Other Government Administration
3 $22,510 $90,040 8 $11,117
Totals for Government
112 $708,877 $75,951 19 $30,598
Sylvania government finances - Expenditure in 2018 (per resident):
Construction - Water Utilities: $1,930,000 ($101.31)
Current Operations - Police Protection: $6,536,000 ($343.08)
General - Other: $4,167,000 ($218.73)Financial Administration: $3,809,000 ($199.94)Water Utilities: $3,111,000 ($163.30)Sewerage: $2,623,000 ($137.68)Central Staff Services: $1,752,000 ($91.96)Judicial and Legal Services: $1,599,000 ($83.93)Parks and Recreation: $1,184,000 ($62.15)General Public Buildings: $457,000 ($23.99)Regular Highways: $325,000 ($17.06)Health - Other: $160,000 ($8.40)General - Interest on Debt: $740,000 ($38.84)
Other Capital Outlay - Sewerage: $304,000 ($15.96)
Total Salaries and Wages: $1,615,000 ($84.77)
Water Utilities - Interest on Debt: $95,000 ($4.99)
Sylvania government finances - Revenue in 2018 (per resident):
Charges - Sewerage: $2,190,000 ($114.95)
Other: $564,000 ($29.60)Miscellaneous - Fines and Forfeits: $1,562,000 ($81.99)
Special Assessments: $1,334,000 ($70.02)General Revenue - Other: $746,000 ($39.16)Interest Earnings: $421,000 ($22.10)Revenue - Water Utilities: $4,475,000 ($234.90)
State Intergovernmental - General Local Government Support: $1,347,000 ($70.70)
Other: $1,129,000 ($59.26)Tax - Individual Income: $12,005,000 ($630.15)
Property: $2,154,000 ($113.06)Other License: $451,000 ($23.67)
Sylvania government finances - Debt in 2018 (per resident):
Long Term Debt - Beginning Outstanding - Unspecified Public Purpose: $19,541,000 ($1025.72)
Outstanding Unspecified Public Purpose: $18,149,000 ($952.65)Beginning Outstanding - Public Debt for Private Purpose: $4,025,000 ($211.27)Outstanding Nonguaranteed - Industrial Revenue: $3,950,000 ($207.34)Retired Unspecified Public Purpose: $1,392,000 ($73.07)Retired Nonguaranteed - Public Debt for Private Purpose: $75,000 ($3.94)
Sylvania government finances - Cash and Securities in 2018 (per resident):
Bond Funds - Cash and Securities: $12,168,000 ($638.71)
Other Funds - Cash and Securities: $10,910,000 ($572.67)
Sinking Funds - Cash and Securities: $4,868,000 ($255.52)
4.37% of this county's 2021 resident taxpayers lived in other counties in 2020 ($52,879 average adjusted gross income )
Here:
4.37%Ohio average:
5.68%
0.01% of residents moved from foreign countries ($120 average AGI )Lucas County:
0.01%Ohio average:
0.01%
Top counties from which taxpayers relocated into this county between 2020 and 2021:
Businesses in Sylvania, OH
Name Count Name Count
ALDI 1 Little Caesars Pizza 1 Audi 1 McDonald's 1 AutoZone 1 New Balance 2 Blockbuster 1 Nike 1 Chevrolet 1 Penske 1 Cold Stone Creamery 1 Rite Aid 4 Curves 1 Starbucks 2 DHL 1 Subway 5 FedEx 4 Taco Bell 1 GNC 1 Tim Hortons 2 Jimmy John's 1 UPS 7 KFC 1 Wendy's 1 Kroger 2 Wingate 1 Lane Furniture 1 YMCA 1
Strongest AM radio stations in Sylvania:
WFDF (910 AM; 50 kW; FLINT, MI; Owner: ABC, INC.)
WTOD (1560 AM; daytime; 5 kW; TOLEDO, OH; Owner: CUMULUS LICENSING CORP.)
WJR (760 AM; 50 kW; DETROIT, MI; Owner: ABC, INC.)
WCHB (1200 AM; 50 kW; TAYLOR, MI; Owner: RADIO ONE OF DETROIT, LLC)
WDFN (1130 AM; 50 kW; DETROIT, MI; Owner: AMFM RADIO LICENSES, L.L.C.)
WSPD (1370 AM; 5 kW; TOLEDO, OH; Owner: CITICASTERS LICENSES, L.P.)
WDMN (1520 AM; 1 kW; TOLEDO, OH)
WWJ (950 AM; 50 kW; DETROIT, MI; Owner: INFINITY BROADCASTING OPERATIONS, INC.)
WXYT (1270 AM; 50 kW; DETROIT, MI; Owner: INFINITY BROADCASTING CORP. OF DETROIT)
WCWA (1230 AM; 1 kW; TOLEDO, OH; Owner: JACOR BROADCASTING CORPORATION)
WTKA (1050 AM; 10 kW; ANN ARBOR, MI; Owner: CAPSTAR TX LIMITED PARTNERSHIP)
WJYM (730 AM; 1 kW; BOWLING GREEN, OH; Owner: FAMILY WORSHIP CENTER CHURCH, INC.)
WDEO (990 AM; 9 kW; YPSILANTI, MI; Owner: WORD BROADCASTERS, INC.)
Strongest FM radio stations in Sylvania:
WYSZ (89.3 FM; MAUMEE, OH; Owner: SIDE BY SIDE, INC.)
WOTL (90.3 FM; TOLEDO, OH; Owner: FAMILY STATIONS, INC.)
WWWM-FM (105.5 FM; SYLVANIA, OH; Owner: CUMULUS LICENSING CORP.)
W264AK (100.7 FM; TOLEDO, OH; Owner: CALVARY CHAPEL OF TWIN FALLS, INC.)
WPOS-FM (102.3 FM; HOLLAND, OH; Owner: THE MAUMEE VALLEY BROADCASTING ASSN.)
WGTE-FM (91.3 FM; TOLEDO, OH; Owner: THE PUBLIC B/C FOUNDATION OF NW OHIO)
WRVF (101.5 FM; TOLEDO, OH; Owner: CITICASTERS LICENSES, L.P.)
WXQQ (96.9 FM; WAUSEON, OH; Owner: CORNERSTONE CHURCH, INC.)
WKKO (99.9 FM; TOLEDO, OH; Owner: CUMULUS LICENSING CORP.)
WIOT (104.7 FM; TOLEDO, OH; Owner: JACOR BROADCASTING CORPORATION)
WVKS (92.5 FM; TOLEDO, OH; Owner: CITICASTERS LICENSES, L.P.)
WJUC (107.3 FM; SWANTON, OH; Owner: WELCH COMMUNICATIONS, INC.)
WTWR-FM (98.3 FM; LUNA PIER, MI; Owner: CUMULUS LICENSING CORP.)
WAAQ (88.3 FM; ONSTED, MI; Owner: GREAT LAKES COMMUNITY BROADCASTING, INC.)
WRWK (106.5 FM; DELTA, OH; Owner: CUMULUS LICENSING CORP.)
WRQN (93.5 FM; BOWLING GREEN, OH; Owner: CUMULUS LICENSING CORP.)
WXTS-FM (88.3 FM; TOLEDO, OH; Owner: BD OF ED TOLEDO CITY SCHOOL DIST)
WJZE (97.3 FM; OAK HARBOR, OH; Owner: RASP BROADCASTING ENTERPRISES, INC.)
WIMX (95.7 FM; GIBSONBURG, OH; Owner: RIVERSIDE BROADCASTING, INC)
WLEN (103.9 FM; ADRIAN, MI; Owner: LENAWEE BROADCASTING COMPANY)
TV broadcast stations around Sylvania:
WUPW (Channel 36; TOLEDO, OH; Owner: WUPW BROADCASTING, LLC)
WTOL (Channel 11; TOLEDO, OH; Owner: LIBCO, INC.)
W64BM (Channel 64; TOLEDO, OH; Owner: VENTANA TELEVISION, INC.)
WNWO-TV (Channel 24; TOLEDO, OH; Owner: RAYCOM NATIONAL, INC.)
WGTE-TV (Channel 30; TOLEDO, OH; Owner: THE PUBLIC BROADCASTING FOUNDATION OF NW OHIO)
WTVG (Channel 13; TOLEDO, OH; Owner: WTVG, INC.)
W59DC (Channel 59; HOUGHTON LAKE, MI; Owner: MS COMMUNICATIONS, LLC)
WBTL-LP (Channel 34; TOLEDO, OH; Owner: VENTURE TECHNOLOGIES GROUP, LLC)
WNGT-LP (Channel 48; TOLEDO, OH; Owner: L & M VIDEO PRODUCTIONS, INC.)
W22CO (Channel 22; TOLEDO, OH; Owner: NATIONAL MINORITY T.V., INC.)
WLMB (Channel 40; TOLEDO, OH; Owner: DOMINION BROADCASTING, INC.)
WBGU-TV (Channel 27; BOWLING GREEN, OH; Owner: BOWLING GREEN STATE UNIVERSITY)
National Bridge Inventory (NBI) Statistics 48 Number of bridges459ft / 140m Total length841,700 Total average daily traffic98,793 Total average daily truck traffic
New bridges - historical statistics
1 1930-1939 1 1950-1959 29 1960-1969 3 1970-1979 4 1980-1989 2 1990-1999 3 2000-2009 5 2010-2019
See full National Bridge Inventory statistics for Sylvania, OH
Home Mortgage Disclosure Act Aggregated Statistics For Year 2009(Based on 1 full and 4 partial tracts) A) FHA, FSA/RHS & VA B) Conventional C) Refinancings D) Home Improvement Loans E) Loans on Dwellings For 5+ Families F) Non-occupant Loans on Number Average Value Number Average Value Number Average Value Number Average Value Number Average Value Number Average Value
LOANS ORIGINATED 69 $133,716 75 $137,734 343 $154,544 9 $33,430 1 $3,999,410 14 $114,610 APPLICATIONS APPROVED, NOT ACCEPTED 3 $119,843 4 $148,592 42 $169,262 3 $18,670 0 $0 1 $37,010 APPLICATIONS DENIED 8 $144,090 4 $106,340 119 $164,676 13 $23,062 0 $0 2 $86,835 APPLICATIONS WITHDRAWN 1 $193,710 5 $171,082 60 $167,945 4 $81,142 0 $0 3 $95,337 FILES CLOSED FOR INCOMPLETENESS 0 $0 2 $124,390 22 $161,068 1 $15,000 0 $0 2 $81,330
Aggregated Statistics For Year 2008(Based on 1 full and 4 partial tracts) A) FHA, FSA/RHS & VA B) Conventional C) Refinancings D) Home Improvement Loans E) Loans on Dwellings For 5+ Families F) Non-occupant Loans on G) Loans On Manufactured Number Average Value Number Average Value Number Average Value Number Average Value Number Average Value Number Average Value Number Average Value
LOANS ORIGINATED 47 $156,649 102 $168,024 129 $150,297 18 $22,502 1 $3,645,610 17 $114,796 0 $0 APPLICATIONS APPROVED, NOT ACCEPTED 1 $54,150 8 $182,319 27 $150,624 4 $17,545 0 $0 3 $86,377 0 $0 APPLICATIONS DENIED 12 $161,126 10 $173,084 88 $157,134 22 $68,563 0 $0 4 $125,758 2 $94,780 APPLICATIONS WITHDRAWN 6 $122,537 16 $145,464 31 $168,565 3 $59,917 0 $0 4 $92,355 0 $0 FILES CLOSED FOR INCOMPLETENESS 0 $0 2 $191,935 9 $167,058 0 $0 0 $0 2 $140,070 0 $0
Aggregated Statistics For Year 2007(Based on 1 full and 4 partial tracts) A) FHA, FSA/RHS & VA B) Conventional C) Refinancings D) Home Improvement Loans E) Loans on Dwellings For 5+ Families F) Non-occupant Loans on G) Loans On Manufactured Number Average Value Number Average Value Number Average Value Number Average Value Number Average Value Number Average Value Number Average Value
LOANS ORIGINATED 8 $170,600 212 $147,172 190 $134,155 25 $50,799 2 $2,378,340 23 $111,292 0 $0 APPLICATIONS APPROVED, NOT ACCEPTED 0 $0 14 $128,841 36 $153,021 11 $40,914 0 $0 2 $125,350 0 $0 APPLICATIONS DENIED 0 $0 24 $110,163 177 $155,741 30 $42,002 0 $0 8 $143,801 2 $17,380 APPLICATIONS WITHDRAWN 1 $81,190 21 $129,792 70 $138,906 1 $55,500 0 $0 5 $98,472 0 $0 FILES CLOSED FOR INCOMPLETENESS 0 $0 6 $160,150 21 $164,367 1 $251,800 0 $0 1 $112,420 0 $0
Aggregated Statistics For Year 2006(Based on 1 full and 4 partial tracts) A) FHA, FSA/RHS & VA B) Conventional C) Refinancings D) Home Improvement Loans E) Loans on Dwellings For 5+ Families F) Non-occupant Loans on G) Loans On Manufactured Number Average Value Number Average Value Number Average Value Number Average Value Number Average Value Number Average Value Number Average Value
LOANS ORIGINATED 15 $161,663 272 $151,534 242 $129,531 32 $61,715 3 $1,069,740 23 $125,567 1 $7,640 APPLICATIONS APPROVED, NOT ACCEPTED 2 $107,000 23 $164,903 71 $129,811 12 $30,281 0 $0 2 $88,665 0 $0 APPLICATIONS DENIED 0 $0 39 $121,642 160 $144,168 32 $31,268 0 $0 9 $111,462 2 $19,315 APPLICATIONS WITHDRAWN 1 $175,830 36 $166,035 77 $139,201 6 $76,810 0 $0 6 $85,105 0 $0 FILES CLOSED FOR INCOMPLETENESS 0 $0 5 $185,314 36 $195,696 1 $64,640 0 $0 4 $131,722 0 $0
Aggregated Statistics For Year 2005(Based on 1 full and 4 partial tracts) A) FHA, FSA/RHS & VA B) Conventional C) Refinancings D) Home Improvement Loans E) Loans on Dwellings For 5+ Families F) Non-occupant Loans on G) Loans On Manufactured Number Average Value Number Average Value Number Average Value Number Average Value Number Average Value Number Average Value Number Average Value
LOANS ORIGINATED 10 $149,305 340 $152,167 322 $137,964 30 $66,862 1 $182,430 29 $116,925 1 $6,110 APPLICATIONS APPROVED, NOT ACCEPTED 1 $76,160 28 $171,546 47 $144,703 8 $52,998 0 $0 1 $81,420 0 $0 APPLICATIONS DENIED 2 $119,150 29 $127,718 200 $148,009 34 $57,028 0 $0 7 $160,511 1 $93,040 APPLICATIONS WITHDRAWN 1 $65,030 25 $137,381 101 $152,010 18 $160,322 0 $0 3 $71,383 1 $32,740 FILES CLOSED FOR INCOMPLETENESS 1 $134,450 5 $159,378 45 $181,910 1 $97,480 0 $0 1 $86,570 0 $0
Aggregated Statistics For Year 2004(Based on 1 full and 4 partial tracts) A) FHA, FSA/RHS & VA B) Conventional C) Refinancings D) Home Improvement Loans E) Loans on Dwellings For 5+ Families F) Non-occupant Loans on G) Loans On Manufactured Number Average Value Number Average Value Number Average Value Number Average Value Number Average Value Number Average Value Number Average Value
LOANS ORIGINATED 9 $160,609 324 $154,767 359 $144,236 26 $36,369 1 $479,920 24 $97,412 2 $18,170 APPLICATIONS APPROVED, NOT ACCEPTED 1 $174,000 29 $132,070 60 $144,029 9 $44,123 0 $0 1 $135,730 1 $4,590 APPLICATIONS DENIED 5 $115,152 38 $141,519 162 $149,689 29 $64,120 0 $0 5 $145,910 4 $16,620 APPLICATIONS WITHDRAWN 1 $92,470 30 $146,106 132 $148,538 5 $56,828 1 $71,900 4 $116,995 0 $0 FILES CLOSED FOR INCOMPLETENESS 2 $126,455 7 $145,283 37 $151,988 5 $55,646 0 $0 1 $145,180 0 $0
Aggregated Statistics For Year 2003(Based on 1 full and 4 partial tracts) A) FHA, FSA/RHS & VA B) Conventional C) Refinancings D) Home Improvement Loans E) Loans on Dwellings For 5+ Families F) Non-occupant Loans on Number Average Value Number Average Value Number Average Value Number Average Value Number Average Value Number Average Value
LOANS ORIGINATED 10 $139,767 325 $140,056 1,039 $140,093 23 $23,251 4 $842,090 30 $98,011 APPLICATIONS APPROVED, NOT ACCEPTED 1 $99,000 20 $114,871 124 $133,095 13 $24,552 0 $0 4 $67,520 APPLICATIONS DENIED 2 $102,900 28 $113,945 197 $135,350 16 $16,284 0 $0 5 $117,506 APPLICATIONS WITHDRAWN 1 $54,680 35 $136,292 142 $145,353 6 $40,357 0 $0 9 $114,024 FILES CLOSED FOR INCOMPLETENESS 0 $0 8 $155,376 41 $143,805 2 $12,995 0 $0 2 $116,125
Aggregated Statistics For Year 2002(Based on 1 full and 4 partial tracts) A) FHA, FSA/RHS & VA B) Conventional C) Refinancings D) Home Improvement Loans E) Loans on Dwellings For 5+ Families F) Non-occupant Loans on Number Average Value Number Average Value Number Average Value Number Average Value Number Average Value Number Average Value
LOANS ORIGINATED 22 $127,350 290 $138,720 908 $143,700 26 $18,865 1 $220,680 26 $100,883 APPLICATIONS APPROVED, NOT ACCEPTED 1 $84,140 22 $154,135 124 $130,107 9 $12,854 0 $0 7 $68,787 APPLICATIONS DENIED 0 $0 21 $100,562 151 $157,387 18 $14,942 0 $0 6 $77,080 APPLICATIONS WITHDRAWN 0 $0 21 $140,095 114 $133,602 5 $15,948 1 $324,780 4 $66,998 FILES CLOSED FOR INCOMPLETENESS 1 $48,110 4 $108,910 41 $142,662 0 $0 0 $0 2 $99,190
Aggregated Statistics For Year 2001(Based on 1 full and 4 partial tracts) A) FHA, FSA/RHS & VA B) Conventional C) Refinancings D) Home Improvement Loans E) Loans on Dwellings For 5+ Families F) Non-occupant Loans on Number Average Value Number Average Value Number Average Value Number Average Value Number Average Value Number Average Value
LOANS ORIGINATED 16 $113,842 282 $142,426 752 $127,315 40 $22,438 3 $727,653 27 $82,281 APPLICATIONS APPROVED, NOT ACCEPTED 1 $46,500 21 $147,140 89 $113,700 17 $14,228 0 $0 2 $86,430 APPLICATIONS DENIED 4 $103,850 25 $110,359 157 $123,006 23 $15,142 1 $180,000 5 $83,514 APPLICATIONS WITHDRAWN 2 $106,270 15 $152,797 88 $116,842 5 $17,112 0 $0 4 $132,092 FILES CLOSED FOR INCOMPLETENESS 0 $0 5 $169,852 37 $123,378 1 $8,070 0 $0 0 $0
Aggregated Statistics For Year 2000(Based on 1 full and 4 partial tracts) A) FHA, FSA/RHS & VA B) Conventional C) Refinancings D) Home Improvement Loans E) Loans on Dwellings For 5+ Families F) Non-occupant Loans on Number Average Value Number Average Value Number Average Value Number Average Value Number Average Value Number Average Value
LOANS ORIGINATED 21 $123,089 288 $145,322 182 $112,774 43 $18,982 1 $417,140 10 $62,138 APPLICATIONS APPROVED, NOT ACCEPTED 0 $0 24 $130,722 57 $112,191 16 $40,201 0 $0 3 $49,857 APPLICATIONS DENIED 2 $95,345 29 $84,148 75 $105,061 28 $19,805 0 $0 3 $34,170 APPLICATIONS WITHDRAWN 1 $148,250 12 $124,982 45 $81,200 3 $37,963 0 $0 2 $23,220 FILES CLOSED FOR INCOMPLETENESS 0 $0 2 $48,590 13 $128,888 1 $34,530 0 $0 0 $0
Aggregated Statistics For Year 1999(Based on 1 full and 4 partial tracts) A) FHA, FSA/RHS & VA B) Conventional C) Refinancings D) Home Improvement Loans E) Loans on Dwellings For 5+ Families F) Non-occupant Loans on Number Average Value Number Average Value Number Average Value Number Average Value Number Average Value Number Average Value
LOANS ORIGINATED 19 $105,736 283 $138,243 327 $114,343 55 $14,108 1 $1,994,340 19 $85,796 APPLICATIONS APPROVED, NOT ACCEPTED 2 $82,725 25 $99,949 65 $102,282 13 $14,877 0 $0 3 $73,067 APPLICATIONS DENIED 0 $0 25 $106,557 79 $99,898 22 $15,325 0 $0 4 $52,420 APPLICATIONS WITHDRAWN 1 $113,230 12 $132,237 72 $99,380 12 $72,442 1 $2,455,880 2 $48,750 FILES CLOSED FOR INCOMPLETENESS 0 $0 5 $172,572 19 $103,059 2 $43,345 0 $0 1 $62,130
Detailed HMDA statistics for the following Tracts:
0081.00
, 0082.01 , 0082.02 , 0082.03 , 0083.01
Private Mortgage Insurance Companies Aggregated Statistics For Year 2009(Based on 1 full and 4 partial tracts) A) Conventional B) Refinancings Number Average Value Number Average Value
LOANS ORIGINATED 17 $147,777 12 $158,248 APPLICATIONS APPROVED, NOT ACCEPTED 2 $245,495 8 $182,909 APPLICATIONS DENIED 2 $111,605 3 $165,333 APPLICATIONS WITHDRAWN 1 $52,160 0 $0 FILES CLOSED FOR INCOMPLETENESS 1 $275,300 1 $67,210
Aggregated Statistics For Year 2008(Based on 1 full and 4 partial tracts) A) Conventional B) Refinancings C) Non-occupant Loans on Number Average Value Number Average Value Number Average Value
LOANS ORIGINATED 49 $157,999 17 $161,843 5 $123,178 APPLICATIONS APPROVED, NOT ACCEPTED 11 $140,982 10 $188,171 2 $88,295 APPLICATIONS DENIED 7 $239,614 1 $366,520 1 $149,130 APPLICATIONS WITHDRAWN 3 $127,260 0 $0 1 $62,390 FILES CLOSED FOR INCOMPLETENESS 0 $0 2 $186,465 0 $0
Aggregated Statistics For Year 2007(Based on 1 full and 4 partial tracts) A) Conventional B) Refinancings C) Non-occupant Loans on Number Average Value Number Average Value Number Average Value
LOANS ORIGINATED 81 $149,468 26 $176,198 6 $115,535 APPLICATIONS APPROVED, NOT ACCEPTED 7 $264,433 9 $170,994 1 $59,680 APPLICATIONS DENIED 1 $135,000 0 $0 0 $0 APPLICATIONS WITHDRAWN 6 $101,305 1 $302,750 2 $73,000 FILES CLOSED FOR INCOMPLETENESS 0 $0 2 $89,525 2 $89,525
Aggregated Statistics For Year 2006(Based on 1 full and 4 partial tracts) A) Conventional B) Refinancings C) Non-occupant Loans on Number Average Value Number Average Value Number Average Value
LOANS ORIGINATED 61 $161,995 24 $166,761 4 $143,258 APPLICATIONS APPROVED, NOT ACCEPTED 10 $235,979 7 $199,183 1 $66,670 APPLICATIONS DENIED 0 $0 2 $66,930 2 $66,930 APPLICATIONS WITHDRAWN 2 $409,250 4 $179,530 0 $0 FILES CLOSED FOR INCOMPLETENESS 0 $0 0 $0 0 $0
Aggregated Statistics For Year 2005(Based on 1 full and 4 partial tracts) A) Conventional B) Refinancings C) Non-occupant Loans on Number Average Value Number Average Value Number Average Value
LOANS ORIGINATED 73 $171,312 37 $166,076 3 $100,137 APPLICATIONS APPROVED, NOT ACCEPTED 9 $192,217 9 $184,938 1 $153,860 APPLICATIONS DENIED 0 $0 0 $0 0 $0 APPLICATIONS WITHDRAWN 2 $137,940 4 $203,722 0 $0 FILES CLOSED FOR INCOMPLETENESS 0 $0 1 $87,760 0 $0
Aggregated Statistics For Year 2004(Based on 1 full and 4 partial tracts) A) Conventional B) Refinancings C) Non-occupant Loans on Number Average Value Number Average Value Number Average Value
LOANS ORIGINATED 85 $162,937 27 $152,602 5 $102,298 APPLICATIONS APPROVED, NOT ACCEPTED 14 $147,071 13 $142,911 2 $56,650 APPLICATIONS DENIED 1 $67,250 1 $212,810 0 $0 APPLICATIONS WITHDRAWN 4 $215,742 1 $157,670 0 $0 FILES CLOSED FOR INCOMPLETENESS 0 $0 0 $0 0 $0
Aggregated Statistics For Year 2003(Based on 1 full and 4 partial tracts) A) Conventional B) Refinancings C) Non-occupant Loans on Number Average Value Number Average Value Number Average Value
LOANS ORIGINATED 77 $144,677 95 $159,582 4 $83,082 APPLICATIONS APPROVED, NOT ACCEPTED 10 $161,198 31 $151,430 2 $52,085 APPLICATIONS DENIED 1 $95,710 2 $162,285 1 $64,500 APPLICATIONS WITHDRAWN 3 $117,683 5 $168,056 1 $95,330 FILES CLOSED FOR INCOMPLETENESS 0 $0 1 $152,000 0 $0
Aggregated Statistics For Year 2002(Based on 1 full and 4 partial tracts) A) Conventional B) Refinancings C) Non-occupant Loans on Number Average Value Number Average Value Number Average Value
LOANS ORIGINATED 84 $139,242 70 $142,189 6 $100,198 APPLICATIONS APPROVED, NOT ACCEPTED 13 $182,477 24 $161,237 1 $69,360 APPLICATIONS DENIED 2 $75,410 1 $169,380 1 $42,820 APPLICATIONS WITHDRAWN 3 $157,187 5 $140,044 2 $117,565 FILES CLOSED FOR INCOMPLETENESS 0 $0 0 $0 0 $0
Aggregated Statistics For Year 2001(Based on 1 full and 4 partial tracts) A) Conventional B) Refinancings C) Non-occupant Loans on Number Average Value Number Average Value Number Average Value
LOANS ORIGINATED 89 $142,725 64 $157,600 2 $52,885 APPLICATIONS APPROVED, NOT ACCEPTED 11 $169,297 14 $195,332 1 $21,680 APPLICATIONS DENIED 0 $0 1 $194,000 0 $0 APPLICATIONS WITHDRAWN 3 $177,160 3 $167,323 0 $0 FILES CLOSED FOR INCOMPLETENESS 0 $0 0 $0 0 $0
Aggregated Statistics For Year 2000(Based on 1 full and 4 partial tracts) A) Conventional B) Refinancings C) Non-occupant Loans on Number Average Value Number Average Value Number Average Value
LOANS ORIGINATED 82 $141,255 17 $148,029 1 $80,170 APPLICATIONS APPROVED, NOT ACCEPTED 7 $161,139 2 $185,000 0 $0 APPLICATIONS DENIED 1 $170,000 0 $0 0 $0 APPLICATIONS WITHDRAWN 3 $123,820 1 $120,000 0 $0 FILES CLOSED FOR INCOMPLETENESS 0 $0 0 $0 0 $0
Aggregated Statistics For Year 1999(Based on 1 full and 4 partial tracts) A) Conventional B) Refinancings C) Non-occupant Loans on Number Average Value Number Average Value Number Average Value
LOANS ORIGINATED 63 $129,386 18 $129,587 2 $76,020 APPLICATIONS APPROVED, NOT ACCEPTED 9 $128,653 3 $166,157 0 $0 APPLICATIONS DENIED 3 $187,323 4 $120,758 1 $212,770 APPLICATIONS WITHDRAWN 1 $112,470 1 $58,200 0 $0 FILES CLOSED FOR INCOMPLETENESS 0 $0 1 $116,280 0 $0
Detailed PMIC statistics for the following Tracts:
0081.00
, 0082.01 , 0082.02 , 0082.03 , 0083.01
Most common first names in Sylvania, OH among deceased individuals Name Count Lived (average)
Mary 184 82.8 years Robert 176 74.3 years John 164 75.0 years William 137 75.0 years Helen 107 84.3 years James 91 72.2 years Dorothy 83 81.6 years Ruth 81 83.2 years Charles 80 77.4 years Richard 68 71.9 years
Most common last names in Sylvania, OH among deceased individuals Last name Count Lived (average)
Smith 82 77.8 years Miller 57 75.6 years Johnson 42 80.7 years Brown 35 74.9 years Williams 30 142.4 years Snyder 24 79.2 years Hall 22 78.1 years Davis 21 74.4 years Wilson 19 79.5 years Jones 18 76.2 years
Sylvania compared to Ohio state average:
Unemployed percentage significantly below state average. Black race population percentage significantly below state average. Percentage of population with a bachelor's degree or higher significantly above state average.
Top Patent Applicants
Benyamin Buller (49)
Timothy R. Pryor (28)
Rui Shao (19)
Ashok Biyani (18)
Akhlesh Gupta (16)
Brian J. Chisholm (14)
Dipankar Pal (13)
James Bernard Kramer (10)
Jeffrey C. Gayer (10)
John F. Schaupp (10)
Total of 524 patent applications in 2008-2024.


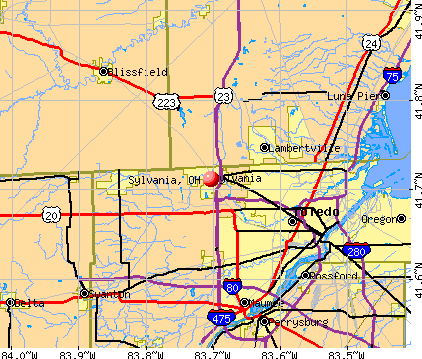


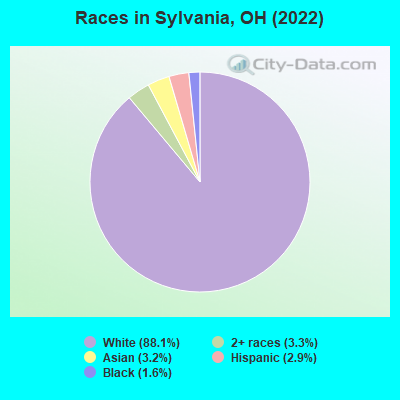
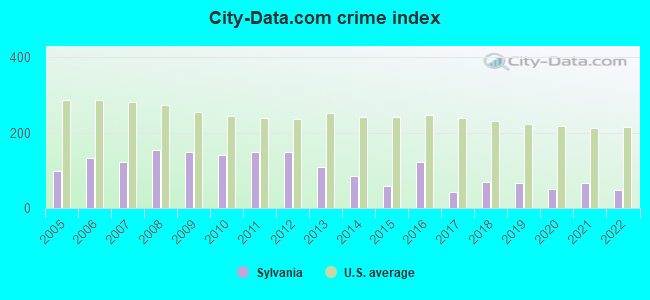
 Recent articles from our blog. Our writers, many of them Ph.D. graduates or candidates, create easy-to-read articles on a wide variety of topics.

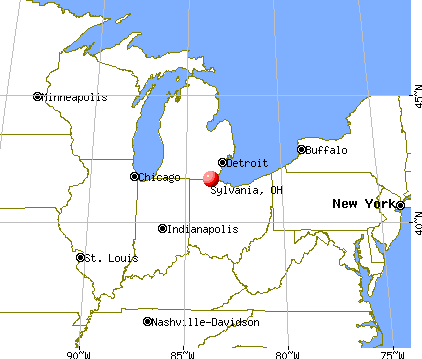
 (7.3 miles
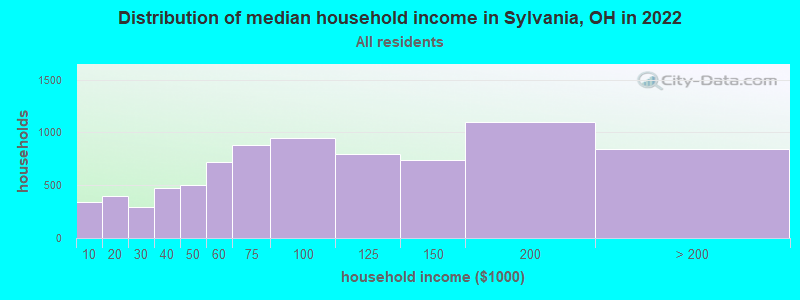
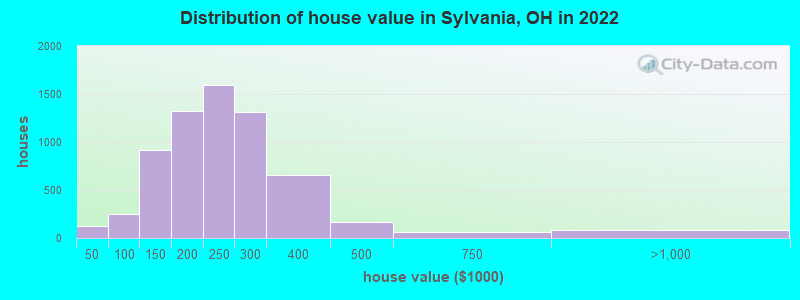
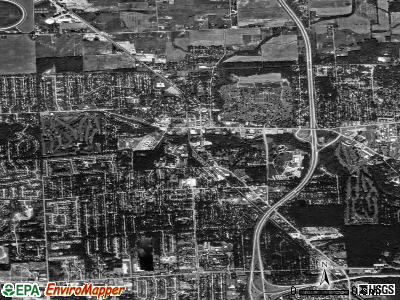
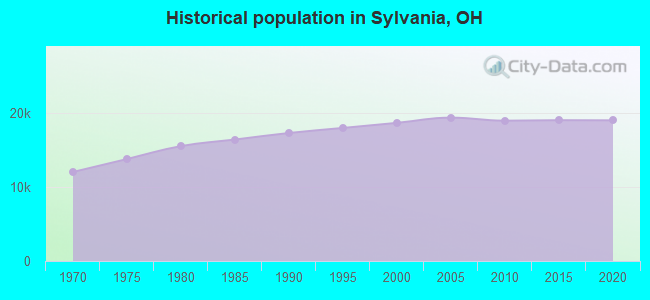
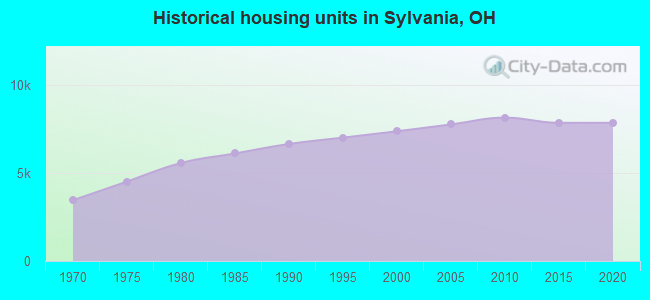
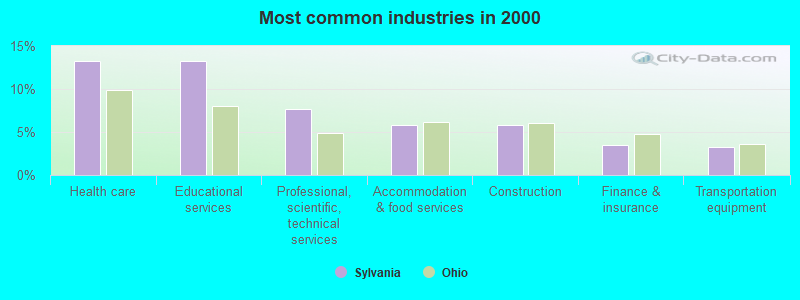
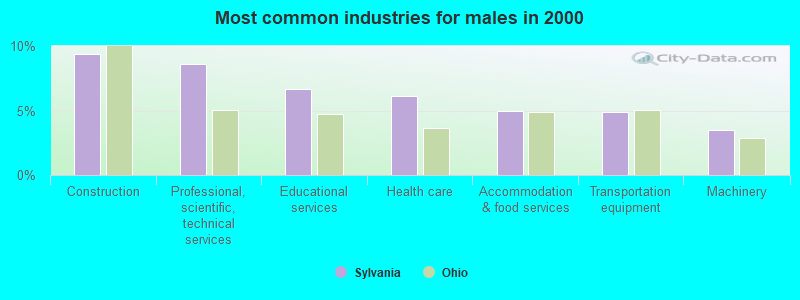
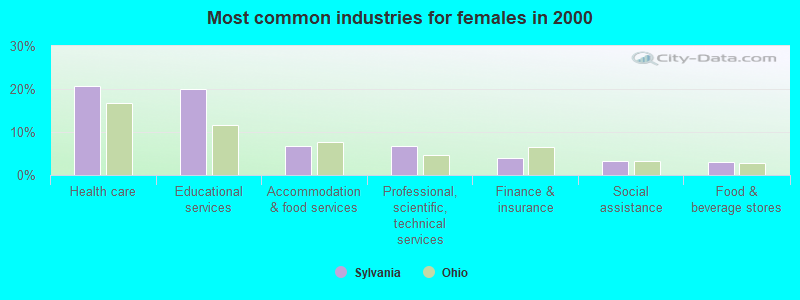
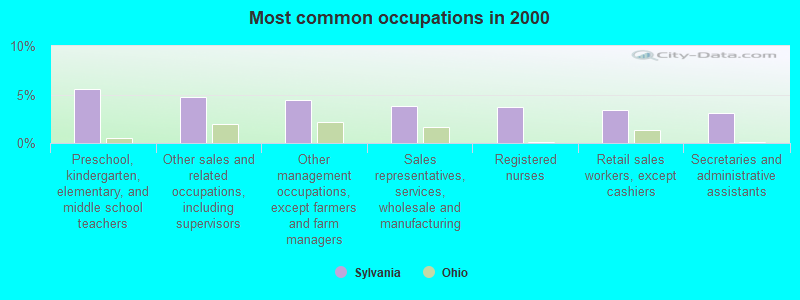
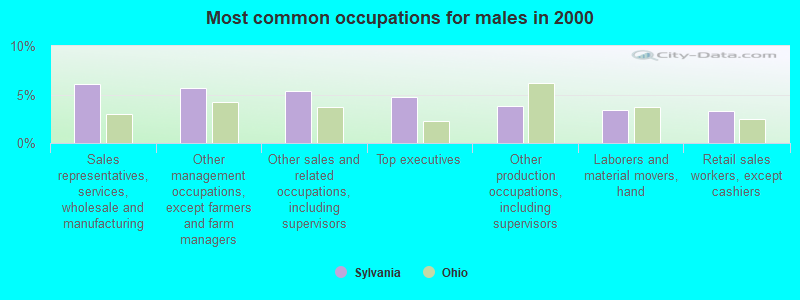
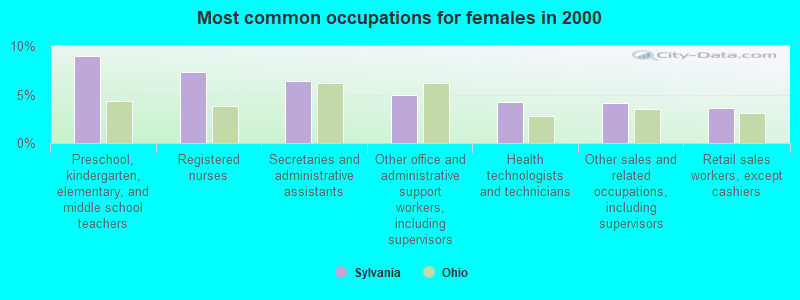
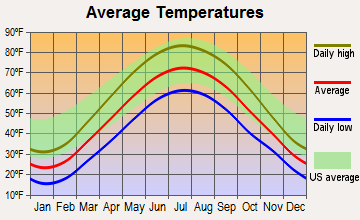
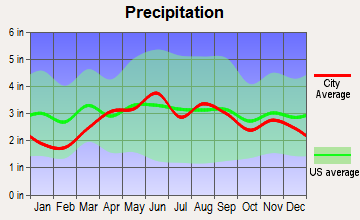
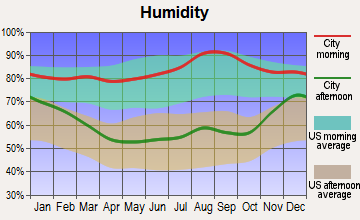
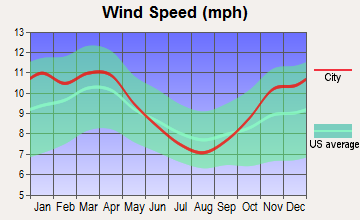
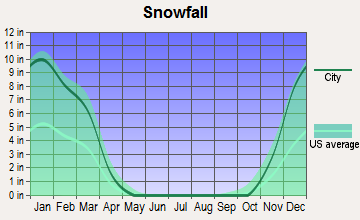
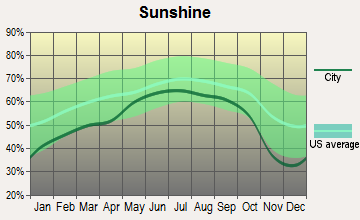
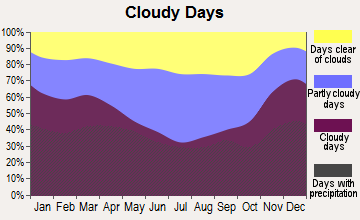
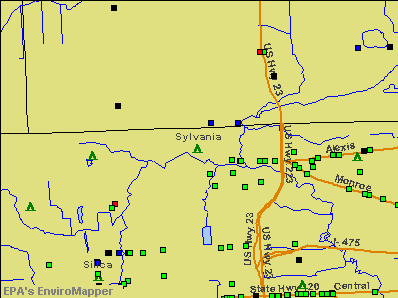

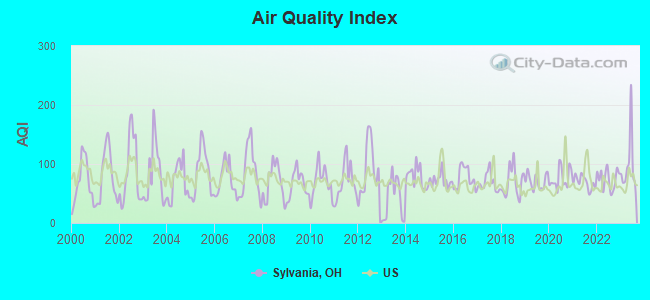
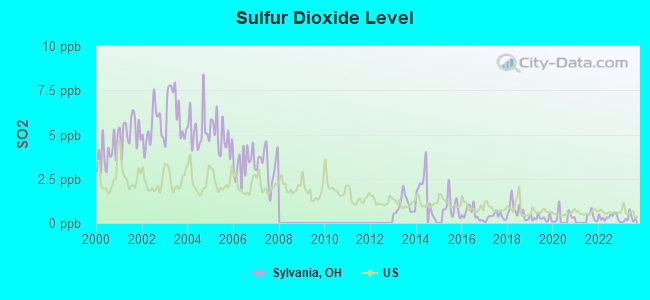
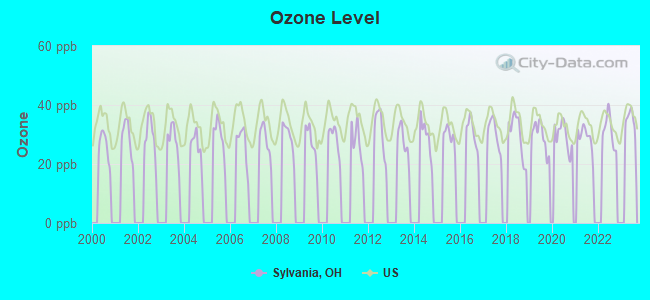
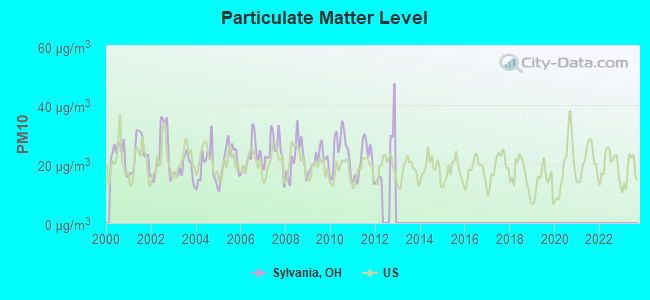
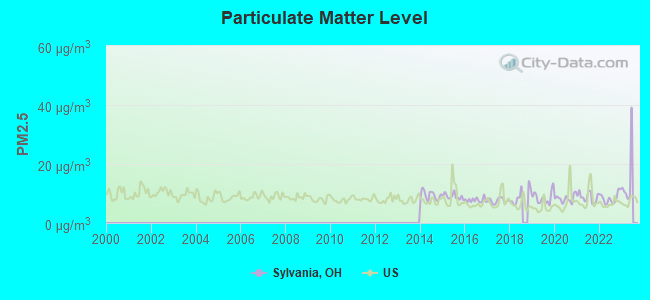
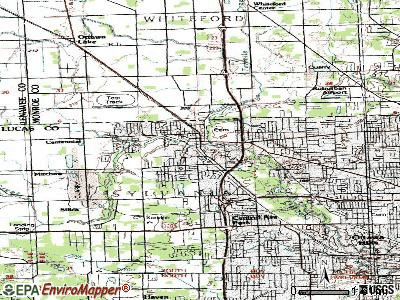
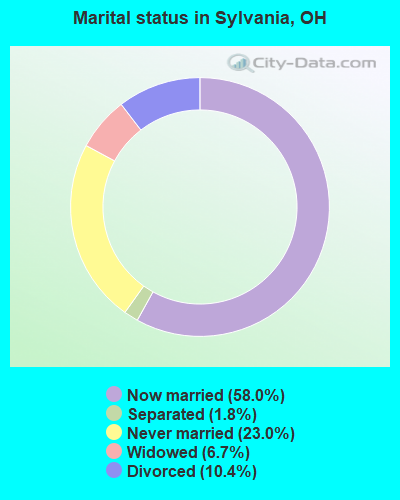
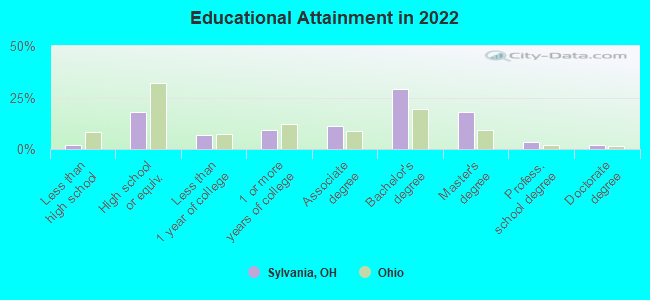
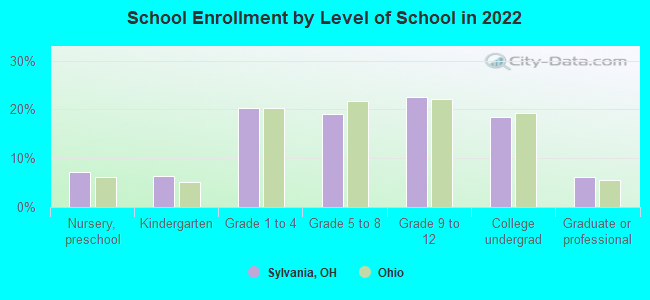
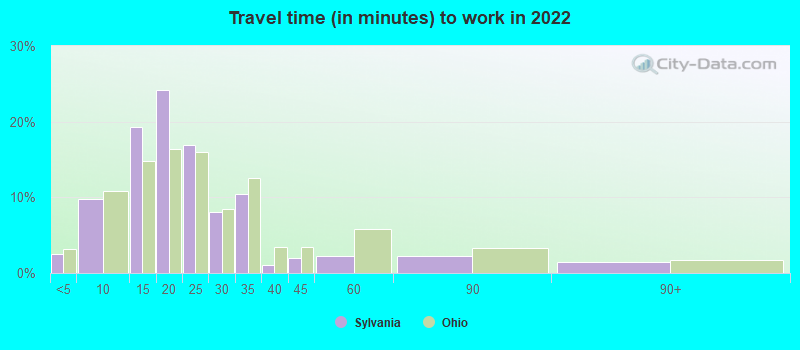
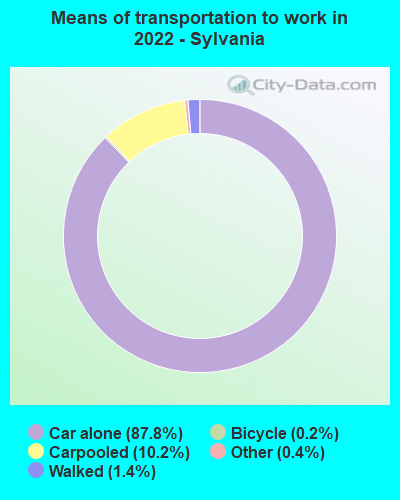
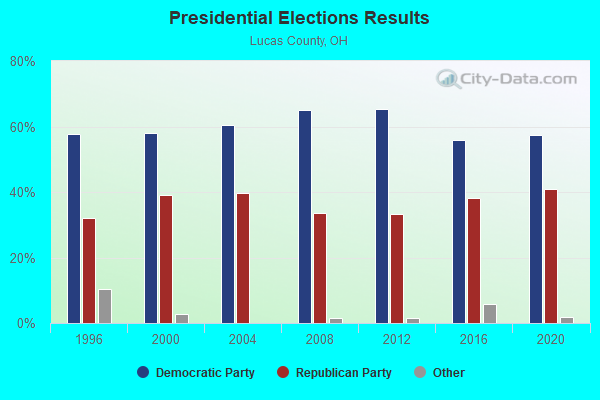
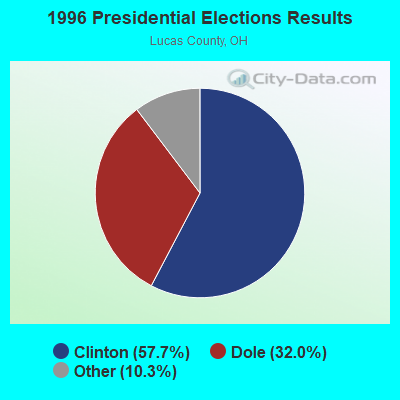
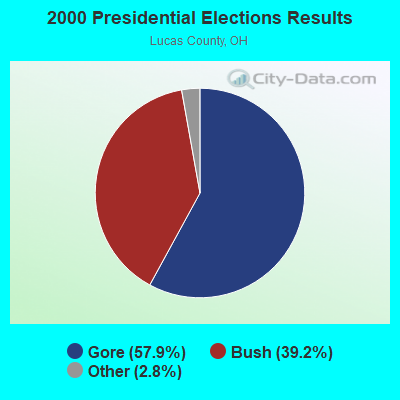
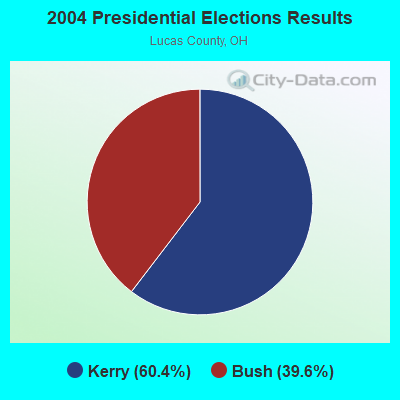

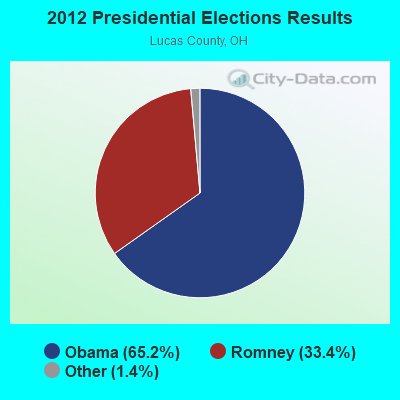
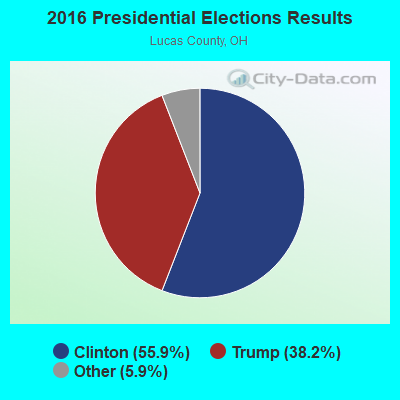
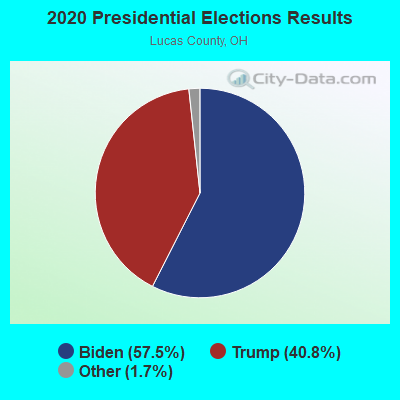
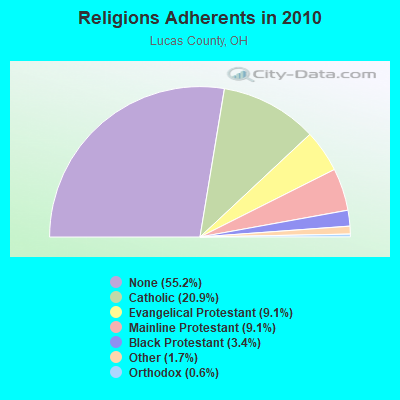
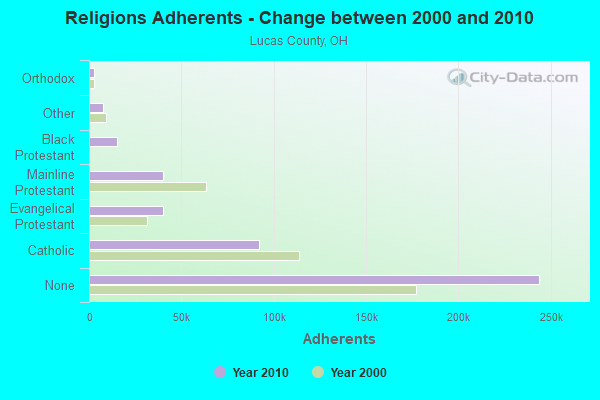
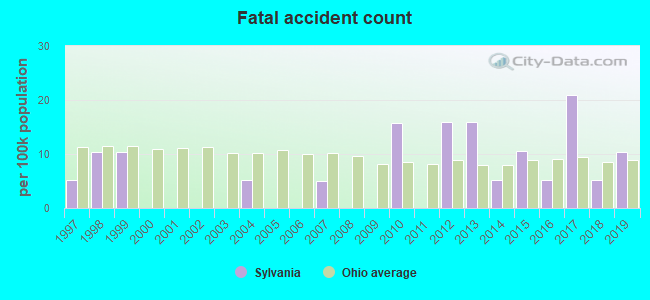
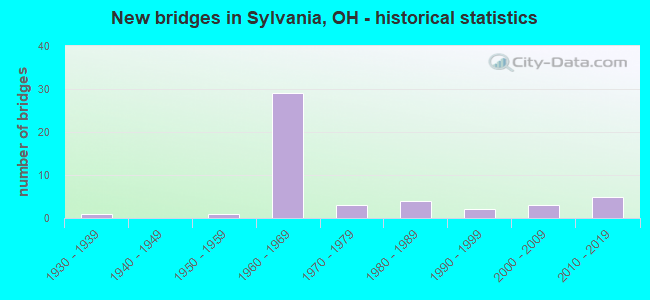
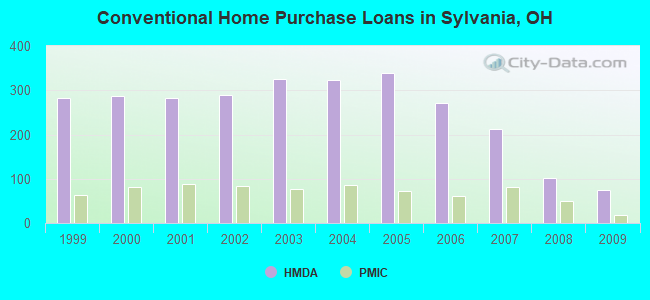
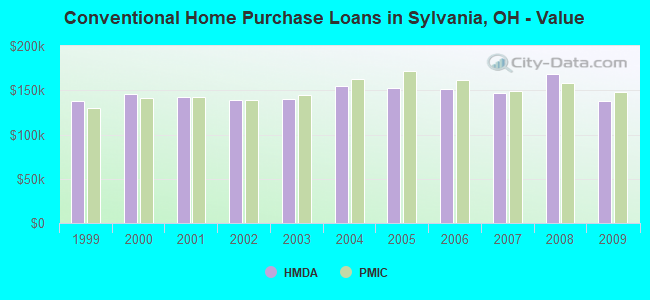
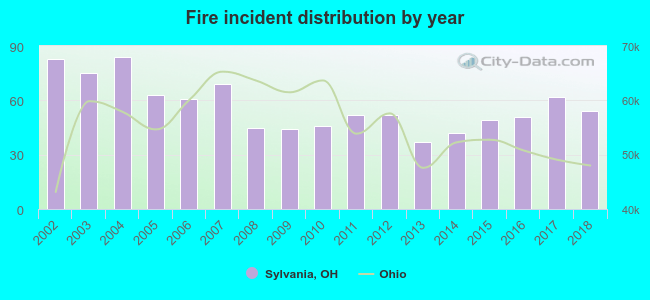 Based on the data from the years 2002 - 2018 the average number of fires per year is 57. The highest number of fire incidents - 84 took place in 2004, and the least - 37 in 2013. The data has a dropping trend.
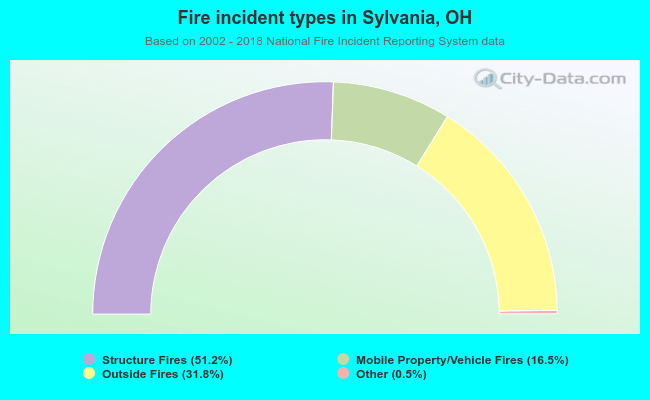 When looking into fire subcategories, the most incidents belonged to: Structure Fires (51.2%), and Outside Fires (31.8%).