Vadnais Heights, Minnesota Submit your own pictures of this city and show them to the world
OSM Map
General Map
Google Map
MSN Map
OSM Map
General Map
Google Map
MSN Map
OSM Map
General Map
Google Map
MSN Map
OSM Map
General Map
Google Map
MSN Map
Please wait while loading the map...
Population in 2022: 12,713 (100% urban, 0% rural). Population change since 2000: -2.7%Males: 6,024 Females: 6,689
March 2022 cost of living index in Vadnais Heights: 113.3 (more than average, U.S. average is 100) Percentage of residents living in poverty in 2022: 5.3%for White Non-Hispanic residents , 19.3% for Black residents , 0.6% for Hispanic or Latino residents , 3.4% for other race residents , 1.5% for two or more races residents )
Profiles of local businesses
Business Search - 14 Million verified businesses
Data:
Median household income ($)
Median household income (% change since 2000)
Household income diversity
Ratio of average income to average house value (%)
Ratio of average income to average rent
Median household income ($) - White
Median household income ($) - Black or African American
Median household income ($) - Asian
Median household income ($) - Hispanic or Latino
Median household income ($) - American Indian and Alaska Native
Median household income ($) - Multirace
Median household income ($) - Other Race
Median household income for houses/condos with a mortgage ($)
Median household income for apartments without a mortgage ($)
Races - White alone (%)
Races - White alone (% change since 2000)
Races - Black alone (%)
Races - Black alone (% change since 2000)
Races - American Indian alone (%)
Races - American Indian alone (% change since 2000)
Races - Asian alone (%)
Races - Asian alone (% change since 2000)
Races - Hispanic (%)
Races - Hispanic (% change since 2000)
Races - Native Hawaiian and Other Pacific Islander alone (%)
Races - Native Hawaiian and Other Pacific Islander alone (% change since 2000)
Races - Two or more races (%)
Races - Two or more races (% change since 2000)
Races - Other race alone (%)
Races - Other race alone (% change since 2000)
Racial diversity
Unemployment (%)
Unemployment (% change since 2000)
Unemployment (%) - White
Unemployment (%) - Black or African American
Unemployment (%) - Asian
Unemployment (%) - Hispanic or Latino
Unemployment (%) - American Indian and Alaska Native
Unemployment (%) - Multirace
Unemployment (%) - Other Race
Population density (people per square mile)
Population - Males (%)
Population - Females (%)
Population - Males (%) - White
Population - Males (%) - Black or African American
Population - Males (%) - Asian
Population - Males (%) - Hispanic or Latino
Population - Males (%) - American Indian and Alaska Native
Population - Males (%) - Multirace
Population - Males (%) - Other Race
Population - Females (%) - White
Population - Females (%) - Black or African American
Population - Females (%) - Asian
Population - Females (%) - Hispanic or Latino
Population - Females (%) - American Indian and Alaska Native
Population - Females (%) - Multirace
Population - Females (%) - Other Race
Coronavirus confirmed cases (Apr 27, 2024)
Deaths caused by coronavirus (Apr 27, 2024)
Coronavirus confirmed cases (per 100k population) (Apr 27, 2024)
Deaths caused by coronavirus (per 100k population) (Apr 27, 2024)
Daily increase in number of cases (Apr 27, 2024)
Weekly increase in number of cases (Apr 27, 2024)
Cases doubled (in days) (Apr 27, 2024)
Hospitalized patients (Apr 18, 2022)
Negative test results (Apr 18, 2022)
Total test results (Apr 18, 2022)
COVID Vaccine doses distributed (per 100k population) (Sep 19, 2023)
COVID Vaccine doses administered (per 100k population) (Sep 19, 2023)
COVID Vaccine doses distributed (Sep 19, 2023)
COVID Vaccine doses administered (Sep 19, 2023)
Likely homosexual households (%)
Likely homosexual households (% change since 2000)
Likely homosexual households - Lesbian couples (%)
Likely homosexual households - Lesbian couples (% change since 2000)
Likely homosexual households - Gay men (%)
Likely homosexual households - Gay men (% change since 2000)
Cost of living index
Median gross rent ($)
Median contract rent ($)
Median monthly housing costs ($)
Median house or condo value ($)
Median house or condo value ($ change since 2000)
Mean house or condo value by units in structure - 1, detached ($)
Mean house or condo value by units in structure - 1, attached ($)
Mean house or condo value by units in structure - 2 ($)
Mean house or condo value by units in structure by units in structure - 3 or 4 ($)
Mean house or condo value by units in structure - 5 or more ($)
Mean house or condo value by units in structure - Boat, RV, van, etc. ($)
Mean house or condo value by units in structure - Mobile home ($)
Median house or condo value ($) - White
Median house or condo value ($) - Black or African American
Median house or condo value ($) - Asian
Median house or condo value ($) - Hispanic or Latino
Median house or condo value ($) - American Indian and Alaska Native
Median house or condo value ($) - Multirace
Median house or condo value ($) - Other Race
Median resident age
Resident age diversity
Median resident age - Males
Median resident age - Females
Median resident age - White
Median resident age - Black or African American
Median resident age - Asian
Median resident age - Hispanic or Latino
Median resident age - American Indian and Alaska Native
Median resident age - Multirace
Median resident age - Other Race
Median resident age - Males - White
Median resident age - Males - Black or African American
Median resident age - Males - Asian
Median resident age - Males - Hispanic or Latino
Median resident age - Males - American Indian and Alaska Native
Median resident age - Males - Multirace
Median resident age - Males - Other Race
Median resident age - Females - White
Median resident age - Females - Black or African American
Median resident age - Females - Asian
Median resident age - Females - Hispanic or Latino
Median resident age - Females - American Indian and Alaska Native
Median resident age - Females - Multirace
Median resident age - Females - Other Race
Commute - mean travel time to work (minutes)
Travel time to work - Less than 5 minutes (%)
Travel time to work - Less than 5 minutes (% change since 2000)
Travel time to work - 5 to 9 minutes (%)
Travel time to work - 5 to 9 minutes (% change since 2000)
Travel time to work - 10 to 19 minutes (%)
Travel time to work - 10 to 19 minutes (% change since 2000)
Travel time to work - 20 to 29 minutes (%)
Travel time to work - 20 to 29 minutes (% change since 2000)
Travel time to work - 30 to 39 minutes (%)
Travel time to work - 30 to 39 minutes (% change since 2000)
Travel time to work - 40 to 59 minutes (%)
Travel time to work - 40 to 59 minutes (% change since 2000)
Travel time to work - 60 to 89 minutes (%)
Travel time to work - 60 to 89 minutes (% change since 2000)
Travel time to work - 90 or more minutes (%)
Travel time to work - 90 or more minutes (% change since 2000)
Marital status - Never married (%)
Marital status - Now married (%)
Marital status - Separated (%)
Marital status - Widowed (%)
Marital status - Divorced (%)
Median family income ($)
Median family income (% change since 2000)
Median non-family income ($)
Median non-family income (% change since 2000)
Median per capita income ($)
Median per capita income (% change since 2000)
Median family income ($) - White
Median family income ($) - Black or African American
Median family income ($) - Asian
Median family income ($) - Hispanic or Latino
Median family income ($) - American Indian and Alaska Native
Median family income ($) - Multirace
Median family income ($) - Other Race
Median year house/condo built
Median year apartment built
Year house built - Built 2005 or later (%)
Year house built - Built 2000 to 2004 (%)
Year house built - Built 1990 to 1999 (%)
Year house built - Built 1980 to 1989 (%)
Year house built - Built 1970 to 1979 (%)
Year house built - Built 1960 to 1969 (%)
Year house built - Built 1950 to 1959 (%)
Year house built - Built 1940 to 1949 (%)
Year house built - Built 1939 or earlier (%)
Average household size
Household density (households per square mile)
Average household size - White
Average household size - Black or African American
Average household size - Asian
Average household size - Hispanic or Latino
Average household size - American Indian and Alaska Native
Average household size - Multirace
Average household size - Other Race
Occupied housing units (%)
Vacant housing units (%)
Owner occupied housing units (%)
Renter occupied housing units (%)
Vacancy status - For rent (%)
Vacancy status - For sale only (%)
Vacancy status - Rented or sold, not occupied (%)
Vacancy status - For seasonal, recreational, or occasional use (%)
Vacancy status - For migrant workers (%)
Vacancy status - Other vacant (%)
Residents with income below the poverty level (%)
Residents with income below 50% of the poverty level (%)
Children below poverty level (%)
Poor families by family type - Married-couple family (%)
Poor families by family type - Male, no wife present (%)
Poor families by family type - Female, no husband present (%)
Poverty status for native-born residents (%)
Poverty status for foreign-born residents (%)
Poverty among high school graduates not in families (%)
Poverty among people who did not graduate high school not in families (%)
Residents with income below the poverty level (%) - White
Residents with income below the poverty level (%) - Black or African American
Residents with income below the poverty level (%) - Asian
Residents with income below the poverty level (%) - Hispanic or Latino
Residents with income below the poverty level (%) - American Indian and Alaska Native
Residents with income below the poverty level (%) - Multirace
Residents with income below the poverty level (%) - Other Race
Air pollution - Air Quality Index (AQI)
Air pollution - CO
Air pollution - NO2
Air pollution - SO2
Air pollution - Ozone
Air pollution - PM10
Air pollution - PM25
Air pollution - Pb
Crime - Murders per 100,000 population
Crime - Rapes per 100,000 population
Crime - Robberies per 100,000 population
Crime - Assaults per 100,000 population
Crime - Burglaries per 100,000 population
Crime - Thefts per 100,000 population
Crime - Auto thefts per 100,000 population
Crime - Arson per 100,000 population
Crime - City-data.com crime index
Crime - Violent crime index
Crime - Property crime index
Crime - Murders per 100,000 population (5 year average)
Crime - Rapes per 100,000 population (5 year average)
Crime - Robberies per 100,000 population (5 year average)
Crime - Assaults per 100,000 population (5 year average)
Crime - Burglaries per 100,000 population (5 year average)
Crime - Thefts per 100,000 population (5 year average)
Crime - Auto thefts per 100,000 population (5 year average)
Crime - Arson per 100,000 population (5 year average)
Crime - City-data.com crime index (5 year average)
Crime - Violent crime index (5 year average)
Crime - Property crime index (5 year average)
1996 Presidential Elections Results (%) - Democratic Party (Clinton)
1996 Presidential Elections Results (%) - Republican Party (Dole)
1996 Presidential Elections Results (%) - Other
2000 Presidential Elections Results (%) - Democratic Party (Gore)
2000 Presidential Elections Results (%) - Republican Party (Bush)
2000 Presidential Elections Results (%) - Other
2004 Presidential Elections Results (%) - Democratic Party (Kerry)
2004 Presidential Elections Results (%) - Republican Party (Bush)
2004 Presidential Elections Results (%) - Other
2008 Presidential Elections Results (%) - Democratic Party (Obama)
2008 Presidential Elections Results (%) - Republican Party (McCain)
2008 Presidential Elections Results (%) - Other
2012 Presidential Elections Results (%) - Democratic Party (Obama)
2012 Presidential Elections Results (%) - Republican Party (Romney)
2012 Presidential Elections Results (%) - Other
2016 Presidential Elections Results (%) - Democratic Party (Clinton)
2016 Presidential Elections Results (%) - Republican Party (Trump)
2016 Presidential Elections Results (%) - Other
2020 Presidential Elections Results (%) - Democratic Party (Biden)
2020 Presidential Elections Results (%) - Republican Party (Trump)
2020 Presidential Elections Results (%) - Other
Ancestries Reported - Arab (%)
Ancestries Reported - Czech (%)
Ancestries Reported - Danish (%)
Ancestries Reported - Dutch (%)
Ancestries Reported - English (%)
Ancestries Reported - French (%)
Ancestries Reported - French Canadian (%)
Ancestries Reported - German (%)
Ancestries Reported - Greek (%)
Ancestries Reported - Hungarian (%)
Ancestries Reported - Irish (%)
Ancestries Reported - Italian (%)
Ancestries Reported - Lithuanian (%)
Ancestries Reported - Norwegian (%)
Ancestries Reported - Polish (%)
Ancestries Reported - Portuguese (%)
Ancestries Reported - Russian (%)
Ancestries Reported - Scotch-Irish (%)
Ancestries Reported - Scottish (%)
Ancestries Reported - Slovak (%)
Ancestries Reported - Subsaharan African (%)
Ancestries Reported - Swedish (%)
Ancestries Reported - Swiss (%)
Ancestries Reported - Ukrainian (%)
Ancestries Reported - United States (%)
Ancestries Reported - Welsh (%)
Ancestries Reported - West Indian (%)
Ancestries Reported - Other (%)
Educational Attainment - No schooling completed (%)
Educational Attainment - Less than high school (%)
Educational Attainment - High school or equivalent (%)
Educational Attainment - Less than 1 year of college (%)
Educational Attainment - 1 or more years of college (%)
Educational Attainment - Associate degree (%)
Educational Attainment - Bachelor's degree (%)
Educational Attainment - Master's degree (%)
Educational Attainment - Professional school degree (%)
Educational Attainment - Doctorate degree (%)
School Enrollment - Nursery, preschool (%)
School Enrollment - Kindergarten (%)
School Enrollment - Grade 1 to 4 (%)
School Enrollment - Grade 5 to 8 (%)
School Enrollment - Grade 9 to 12 (%)
School Enrollment - College undergrad (%)
School Enrollment - Graduate or professional (%)
School Enrollment - Not enrolled in school (%)
School enrollment - Public schools (%)
School enrollment - Private schools (%)
School enrollment - Not enrolled (%)
Median number of rooms in houses and condos
Median number of rooms in apartments
Housing units lacking complete plumbing facilities (%)
Housing units lacking complete kitchen facilities (%)
Density of houses
Urban houses (%)
Rural houses (%)
Households with people 60 years and over (%)
Households with people 65 years and over (%)
Households with people 75 years and over (%)
Households with one or more nonrelatives (%)
Households with no nonrelatives (%)
Population in households (%)
Family households (%)
Nonfamily households (%)
Population in families (%)
Family households with own children (%)
Median number of bedrooms in owner occupied houses
Mean number of bedrooms in owner occupied houses
Median number of bedrooms in renter occupied houses
Mean number of bedrooms in renter occupied houses
Median number of vehichles in owner occupied houses
Mean number of vehichles in owner occupied houses
Median number of vehichles in renter occupied houses
Mean number of vehichles in renter occupied houses
Mortgage status - with mortgage (%)
Mortgage status - with second mortgage (%)
Mortgage status - with home equity loan (%)
Mortgage status - with both second mortgage and home equity loan (%)
Mortgage status - without a mortgage (%)
Average family size
Average family size - White
Average family size - Black or African American
Average family size - Asian
Average family size - Hispanic or Latino
Average family size - American Indian and Alaska Native
Average family size - Multirace
Average family size - Other Race
Geographical mobility - Same house 1 year ago (%)
Geographical mobility - Moved within same county (%)
Geographical mobility - Moved from different county within same state (%)
Geographical mobility - Moved from different state (%)
Geographical mobility - Moved from abroad (%)
Place of birth - Born in state of residence (%)
Place of birth - Born in other state (%)
Place of birth - Native, outside of US (%)
Place of birth - Foreign born (%)
Housing units in structures - 1, detached (%)
Housing units in structures - 1, attached (%)
Housing units in structures - 2 (%)
Housing units in structures - 3 or 4 (%)
Housing units in structures - 5 to 9 (%)
Housing units in structures - 10 to 19 (%)
Housing units in structures - 20 to 49 (%)
Housing units in structures - 50 or more (%)
Housing units in structures - Mobile home (%)
Housing units in structures - Boat, RV, van, etc. (%)
House/condo owner moved in on average (years ago)
Renter moved in on average (years ago)
Year householder moved into unit - Moved in 1999 to March 2000 (%)
Year householder moved into unit - Moved in 1995 to 1998 (%)
Year householder moved into unit - Moved in 1990 to 1994 (%)
Year householder moved into unit - Moved in 1980 to 1989 (%)
Year householder moved into unit - Moved in 1970 to 1979 (%)
Year householder moved into unit - Moved in 1969 or earlier (%)
Means of transportation to work - Drove car alone (%)
Means of transportation to work - Carpooled (%)
Means of transportation to work - Public transportation (%)
Means of transportation to work - Bus or trolley bus (%)
Means of transportation to work - Streetcar or trolley car (%)
Means of transportation to work - Subway or elevated (%)
Means of transportation to work - Railroad (%)
Means of transportation to work - Ferryboat (%)
Means of transportation to work - Taxicab (%)
Means of transportation to work - Motorcycle (%)
Means of transportation to work - Bicycle (%)
Means of transportation to work - Walked (%)
Means of transportation to work - Other means (%)
Working at home (%)
Industry diversity
Most Common Industries - Agriculture, forestry, fishing and hunting, and mining (%)
Most Common Industries - Agriculture, forestry, fishing and hunting (%)
Most Common Industries - Mining, quarrying, and oil and gas extraction (%)
Most Common Industries - Construction (%)
Most Common Industries - Manufacturing (%)
Most Common Industries - Wholesale trade (%)
Most Common Industries - Retail trade (%)
Most Common Industries - Transportation and warehousing, and utilities (%)
Most Common Industries - Transportation and warehousing (%)
Most Common Industries - Utilities (%)
Most Common Industries - Information (%)
Most Common Industries - Finance and insurance, and real estate and rental and leasing (%)
Most Common Industries - Finance and insurance (%)
Most Common Industries - Real estate and rental and leasing (%)
Most Common Industries - Professional, scientific, and management, and administrative and waste management services (%)
Most Common Industries - Professional, scientific, and technical services (%)
Most Common Industries - Management of companies and enterprises (%)
Most Common Industries - Administrative and support and waste management services (%)
Most Common Industries - Educational services, and health care and social assistance (%)
Most Common Industries - Educational services (%)
Most Common Industries - Health care and social assistance (%)
Most Common Industries - Arts, entertainment, and recreation, and accommodation and food services (%)
Most Common Industries - Arts, entertainment, and recreation (%)
Most Common Industries - Accommodation and food services (%)
Most Common Industries - Other services, except public administration (%)
Most Common Industries - Public administration (%)
Occupation diversity
Most Common Occupations - Management, business, science, and arts occupations (%)
Most Common Occupations - Management, business, and financial occupations (%)
Most Common Occupations - Management occupations (%)
Most Common Occupations - Business and financial operations occupations (%)
Most Common Occupations - Computer, engineering, and science occupations (%)
Most Common Occupations - Computer and mathematical occupations (%)
Most Common Occupations - Architecture and engineering occupations (%)
Most Common Occupations - Life, physical, and social science occupations (%)
Most Common Occupations - Education, legal, community service, arts, and media occupations (%)
Most Common Occupations - Community and social service occupations (%)
Most Common Occupations - Legal occupations (%)
Most Common Occupations - Education, training, and library occupations (%)
Most Common Occupations - Arts, design, entertainment, sports, and media occupations (%)
Most Common Occupations - Healthcare practitioners and technical occupations (%)
Most Common Occupations - Health diagnosing and treating practitioners and other technical occupations (%)
Most Common Occupations - Health technologists and technicians (%)
Most Common Occupations - Service occupations (%)
Most Common Occupations - Healthcare support occupations (%)
Most Common Occupations - Protective service occupations (%)
Most Common Occupations - Fire fighting and prevention, and other protective service workers including supervisors (%)
Most Common Occupations - Law enforcement workers including supervisors (%)
Most Common Occupations - Food preparation and serving related occupations (%)
Most Common Occupations - Building and grounds cleaning and maintenance occupations (%)
Most Common Occupations - Personal care and service occupations (%)
Most Common Occupations - Sales and office occupations (%)
Most Common Occupations - Sales and related occupations (%)
Most Common Occupations - Office and administrative support occupations (%)
Most Common Occupations - Natural resources, construction, and maintenance occupations (%)
Most Common Occupations - Farming, fishing, and forestry occupations (%)
Most Common Occupations - Construction and extraction occupations (%)
Most Common Occupations - Installation, maintenance, and repair occupations (%)
Most Common Occupations - Production, transportation, and material moving occupations (%)
Most Common Occupations - Production occupations (%)
Most Common Occupations - Transportation occupations (%)
Most Common Occupations - Material moving occupations (%)
People in Group quarters - Institutionalized population (%)
People in Group quarters - Correctional institutions (%)
People in Group quarters - Federal prisons and detention centers (%)
People in Group quarters - Halfway houses (%)
People in Group quarters - Local jails and other confinement facilities (including police lockups) (%)
People in Group quarters - Military disciplinary barracks (%)
People in Group quarters - State prisons (%)
People in Group quarters - Other types of correctional institutions (%)
People in Group quarters - Nursing homes (%)
People in Group quarters - Hospitals/wards, hospices, and schools for the handicapped (%)
People in Group quarters - Hospitals/wards and hospices for chronically ill (%)
People in Group quarters - Hospices or homes for chronically ill (%)
People in Group quarters - Military hospitals or wards for chronically ill (%)
People in Group quarters - Other hospitals or wards for chronically ill (%)
People in Group quarters - Hospitals or wards for drug/alcohol abuse (%)
People in Group quarters - Mental (Psychiatric) hospitals or wards (%)
People in Group quarters - Schools, hospitals, or wards for the mentally retarded (%)
People in Group quarters - Schools, hospitals, or wards for the physically handicapped (%)
People in Group quarters - Institutions for the deaf (%)
People in Group quarters - Institutions for the blind (%)
People in Group quarters - Orthopedic wards and institutions for the physically handicapped (%)
People in Group quarters - Wards in general hospitals for patients who have no usual home elsewhere (%)
People in Group quarters - Wards in military hospitals for patients who have no usual home elsewhere (%)
People in Group quarters - Juvenile institutions (%)
People in Group quarters - Long-term care (%)
People in Group quarters - Homes for abused, dependent, and neglected children (%)
People in Group quarters - Residential treatment centers for emotionally disturbed children (%)
People in Group quarters - Training schools for juvenile delinquents (%)
People in Group quarters - Short-term care, detention or diagnostic centers for delinquent children (%)
People in Group quarters - Type of juvenile institution unknown (%)
People in Group quarters - Noninstitutionalized population (%)
People in Group quarters - College dormitories (includes college quarters off campus) (%)
People in Group quarters - Military quarters (%)
People in Group quarters - On base (%)
People in Group quarters - Barracks, unaccompanied personnel housing (UPH), (Enlisted/Officer), ;and similar group living quarters for military personnel (%)
People in Group quarters - Transient quarters for temporary residents (%)
People in Group quarters - Military ships (%)
People in Group quarters - Group homes (%)
People in Group quarters - Homes or halfway houses for drug/alcohol abuse (%)
People in Group quarters - Homes for the mentally ill (%)
People in Group quarters - Homes for the mentally retarded (%)
People in Group quarters - Homes for the physically handicapped (%)
People in Group quarters - Other group homes (%)
People in Group quarters - Religious group quarters (%)
People in Group quarters - Dormitories (%)
People in Group quarters - Agriculture workers' dormitories on farms (%)
People in Group quarters - Job Corps and vocational training facilities (%)
People in Group quarters - Other workers' dormitories (%)
People in Group quarters - Crews of maritime vessels (%)
People in Group quarters - Other nonhousehold living situations (%)
People in Group quarters - Other noninstitutional group quarters (%)
Residents speaking English at home (%)
Residents speaking English at home - Born in the United States (%)
Residents speaking English at home - Native, born elsewhere (%)
Residents speaking English at home - Foreign born (%)
Residents speaking Spanish at home (%)
Residents speaking Spanish at home - Born in the United States (%)
Residents speaking Spanish at home - Native, born elsewhere (%)
Residents speaking Spanish at home - Foreign born (%)
Residents speaking other language at home (%)
Residents speaking other language at home - Born in the United States (%)
Residents speaking other language at home - Native, born elsewhere (%)
Residents speaking other language at home - Foreign born (%)
Class of Workers - Employee of private company (%)
Class of Workers - Self-employed in own incorporated business (%)
Class of Workers - Private not-for-profit wage and salary workers (%)
Class of Workers - Local government workers (%)
Class of Workers - State government workers (%)
Class of Workers - Federal government workers (%)
Class of Workers - Self-employed workers in own not incorporated business and Unpaid family workers (%)
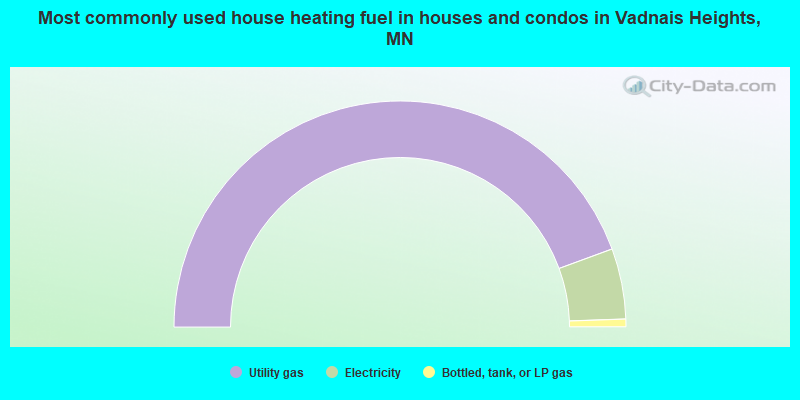
House heating fuel used in houses and condos - Utility gas (%)
House heating fuel used in houses and condos - Bottled, tank, or LP gas (%)
House heating fuel used in houses and condos - Electricity (%)
House heating fuel used in houses and condos - Fuel oil, kerosene, etc. (%)
House heating fuel used in houses and condos - Coal or coke (%)
House heating fuel used in houses and condos - Wood (%)
House heating fuel used in houses and condos - Solar energy (%)
House heating fuel used in houses and condos - Other fuel (%)
House heating fuel used in houses and condos - No fuel used (%)
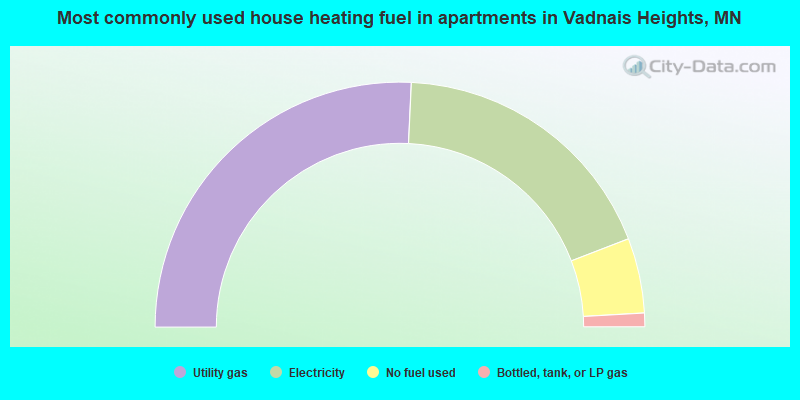
House heating fuel used in apartments - Utility gas (%)
House heating fuel used in apartments - Bottled, tank, or LP gas (%)
House heating fuel used in apartments - Electricity (%)
House heating fuel used in apartments - Fuel oil, kerosene, etc. (%)
House heating fuel used in apartments - Coal or coke (%)
House heating fuel used in apartments - Wood (%)
House heating fuel used in apartments - Solar energy (%)
House heating fuel used in apartments - Other fuel (%)
House heating fuel used in apartments - No fuel used (%)
Armed forces status - In Armed Forces (%)
Armed forces status - Civilian (%)
Armed forces status - Civilian - Veteran (%)
Armed forces status - Civilian - Nonveteran (%)
Fatal accidents locations in years 2005-2021
Fatal accidents locations in 2005
Fatal accidents locations in 2006
Fatal accidents locations in 2007
Fatal accidents locations in 2008
Fatal accidents locations in 2009
Fatal accidents locations in 2010
Fatal accidents locations in 2011
Fatal accidents locations in 2012
Fatal accidents locations in 2013
Fatal accidents locations in 2014
Fatal accidents locations in 2015
Fatal accidents locations in 2016
Fatal accidents locations in 2017
Fatal accidents locations in 2018
Fatal accidents locations in 2019
Fatal accidents locations in 2020
Fatal accidents locations in 2021
Alcohol use - People drinking some alcohol every month (%)
Alcohol use - People not drinking at all (%)
Alcohol use - Average days/month drinking alcohol
Alcohol use - Average drinks/week
Alcohol use - Average days/year people drink much
Audiometry - Average condition of hearing (%)
Audiometry - People that can hear a whisper from across a quiet room (%)
Audiometry - People that can hear normal voice from across a quiet room (%)
Audiometry - Ears ringing, roaring, buzzing (%)
Audiometry - Had a job exposure to loud noise (%)
Audiometry - Had off-work exposure to loud noise (%)
Blood Pressure & Cholesterol - Has high blood pressure (%)
Blood Pressure & Cholesterol - Checking blood pressure at home (%)
Blood Pressure & Cholesterol - Frequently checking blood cholesterol (%)
Blood Pressure & Cholesterol - Has high cholesterol level (%)
Consumer Behavior - Money monthly spent on food at supermarket/grocery store
Consumer Behavior - Money monthly spent on food at other stores
Consumer Behavior - Money monthly spent on eating out
Consumer Behavior - Money monthly spent on carryout/delivered foods
Consumer Behavior - Income spent on food at supermarket/grocery store (%)
Consumer Behavior - Income spent on food at other stores (%)
Consumer Behavior - Income spent on eating out (%)
Consumer Behavior - Income spent on carryout/delivered foods (%)
Current Health Status - General health condition (%)
Current Health Status - Blood donors (%)
Current Health Status - Has blood ever tested for HIV virus (%)
Current Health Status - Left-handed people (%)
Dermatology - People using sunscreen (%)
Diabetes - Diabetics (%)
Diabetes - Had a blood test for high blood sugar (%)
Diabetes - People taking insulin (%)
Diet Behavior & Nutrition - Diet health (%)
Diet Behavior & Nutrition - Milk product consumption (# of products/month)
Diet Behavior & Nutrition - Meals not home prepared (#/week)
Diet Behavior & Nutrition - Meals from fast food or pizza place (#/week)
Diet Behavior & Nutrition - Ready-to-eat foods (#/month)
Diet Behavior & Nutrition - Frozen meals/pizza (#/month)
Drug Use - People that ever used marijuana or hashish (%)
Drug Use - Ever used hard drugs (%)
Drug Use - Ever used any form of cocaine (%)
Drug Use - Ever used heroin (%)
Drug Use - Ever used methamphetamine (%)
Health Insurance - People covered by health insurance (%)
Kidney Conditions-Urology - Avg. # of times urinating at night
Medical Conditions - People with asthma (%)
Medical Conditions - People with anemia (%)
Medical Conditions - People with psoriasis (%)
Medical Conditions - People with overweight (%)
Medical Conditions - Elderly people having difficulties in thinking or remembering (%)
Medical Conditions - People who ever received blood transfusion (%)
Medical Conditions - People having trouble seeing even with glass/contacts (%)
Medical Conditions - People with arthritis (%)
Medical Conditions - People with gout (%)
Medical Conditions - People with congestive heart failure (%)
Medical Conditions - People with coronary heart disease (%)
Medical Conditions - People with angina pectoris (%)
Medical Conditions - People who ever had heart attack (%)
Medical Conditions - People who ever had stroke (%)
Medical Conditions - People with emphysema (%)
Medical Conditions - People with thyroid problem (%)
Medical Conditions - People with chronic bronchitis (%)
Medical Conditions - People with any liver condition (%)
Medical Conditions - People who ever had cancer or malignancy (%)
Mental Health - People who have little interest in doing things (%)
Mental Health - People feeling down, depressed, or hopeless (%)
Mental Health - People who have trouble sleeping or sleeping too much (%)
Mental Health - People feeling tired or having little energy (%)
Mental Health - People with poor appetite or overeating (%)
Mental Health - People feeling bad about themself (%)
Mental Health - People who have trouble concentrating on things (%)
Mental Health - People moving or speaking slowly or too fast (%)
Mental Health - People having thoughts they would be better off dead (%)
Oral Health - Average years since last visit a dentist
Oral Health - People embarrassed because of mouth (%)
Oral Health - People with gum disease (%)
Oral Health - General health of teeth and gums (%)
Oral Health - Average days a week using dental floss/device
Oral Health - Average days a week using mouthwash for dental problem
Oral Health - Average number of teeth
Pesticide Use - Households using pesticides to control insects (%)
Pesticide Use - Households using pesticides to kill weeds (%)
Physical Activity - People doing vigorous-intensity work activities (%)
Physical Activity - People doing moderate-intensity work activities (%)
Physical Activity - People walking or bicycling (%)
Physical Activity - People doing vigorous-intensity recreational activities (%)
Physical Activity - People doing moderate-intensity recreational activities (%)
Physical Activity - Average hours a day doing sedentary activities
Physical Activity - Average hours a day watching TV or videos
Physical Activity - Average hours a day using computer
Physical Functioning - People having limitations keeping them from working (%)
Physical Functioning - People limited in amount of work they can do (%)
Physical Functioning - People that need special equipment to walk (%)
Physical Functioning - People experiencing confusion/memory problems (%)
Physical Functioning - People requiring special healthcare equipment (%)
Prescription Medications - Average number of prescription medicines taking
Preventive Aspirin Use - Adults 40+ taking low-dose aspirin (%)
Reproductive Health - Vaginal deliveries (%)
Reproductive Health - Cesarean deliveries (%)
Reproductive Health - Deliveries resulted in a live birth (%)
Reproductive Health - Pregnancies resulted in a delivery (%)
Reproductive Health - Women breastfeeding newborns (%)
Reproductive Health - Women that had a hysterectomy (%)
Reproductive Health - Women that had both ovaries removed (%)
Reproductive Health - Women that have ever taken birth control pills (%)
Reproductive Health - Women taking birth control pills (%)
Reproductive Health - Women that have ever used Depo-Provera or injectables (%)
Reproductive Health - Women that have ever used female hormones (%)
Sexual Behavior - People 18+ that ever had sex (vaginal, anal, or oral) (%)
Sexual Behavior - Males 18+ that ever had vaginal sex with a woman (%)
Sexual Behavior - Males 18+ that ever performed oral sex on a woman (%)
Sexual Behavior - Males 18+ that ever had anal sex with a woman (%)
Sexual Behavior - Males 18+ that ever had any sex with a man (%)
Sexual Behavior - Females 18+ that ever had vaginal sex with a man (%)
Sexual Behavior - Females 18+ that ever performed oral sex on a man (%)
Sexual Behavior - Females 18+ that ever had anal sex with a man (%)
Sexual Behavior - Females 18+ that ever had any kind of sex with a woman (%)
Sexual Behavior - Average age people first had sex
Sexual Behavior - Average number of female sex partners in lifetime (males 18+)
Sexual Behavior - Average number of female vaginal sex partners in lifetime (males 18+)
Sexual Behavior - Average age people first performed oral sex on a woman (18+)
Sexual Behavior - Average number of woman performed oral sex on in lifetime (18+)
Sexual Behavior - Average number of male sex partners in lifetime (males 18+)
Sexual Behavior - Average number of male anal sex partners in lifetime (males 18+)
Sexual Behavior - Average age people first performed oral sex on a man (18+)
Sexual Behavior - Average number of male oral sex partners in lifetime (18+)
Sexual Behavior - People using protection when performing oral sex (%)
Sexual Behavior - Average number of times people have vaginal or anal sex a year
Sexual Behavior - People having sex without condom (%)
Sexual Behavior - Average number of male sex partners in lifetime (females 18+)
Sexual Behavior - Average number of male vaginal sex partners in lifetime (females 18+)
Sexual Behavior - Average number of female sex partners in lifetime (females 18+)
Sexual Behavior - Circumcised males 18+ (%)
Sleep Disorders - Average hours sleeping at night
Sleep Disorders - People that has trouble sleeping (%)
Smoking-Cigarette Use - People smoking cigarettes (%)
Taste & Smell - People 40+ having problems with smell (%)
Taste & Smell - People 40+ having problems with taste (%)
Taste & Smell - People 40+ that ever had wisdom teeth removed (%)
Taste & Smell - People 40+ that ever had tonsils teeth removed (%)
Taste & Smell - People 40+ that ever had a loss of consciousness because of a head injury (%)
Taste & Smell - People 40+ that ever had a broken nose or other serious injury to face or skull (%)
Taste & Smell - People 40+ that ever had two or more sinus infections (%)
Weight - Average height (inches)
Weight - Average weight (pounds)
Weight - Average BMI
Weight - People that are obese (%)
Weight - People that ever were obese (%)
Weight - People trying to lose weight (%)
Latest news from Vadnais Heights, MN collected exclusively by city-data.com from local newspapers, TV, and radio stations
Ancestries: German (18.0%), American (7.3%), European (7.1%), Irish (4.2%), Swedish (3.7%), Norwegian (3.5%).
Current Local Time:
Land area: 7.29 square miles.
Population density: 1,745 people per square mile (low).
1,279 residents are foreign born (3.8% Asia , 3.0% Latin America , 2.0% Africa ).
This city:
10.1%Minnesota:
8.5%
Median real estate property taxes paid for housing units with mortgages in 2022: $3,280 (1.0%)Median real estate property taxes paid for housing units with no mortgage in 2022: $3,910 (1.2%)
Nearest city with pop. 50,000+: St. Paul, MN
Nearest city with pop. 1,000,000+: Chicago, IL
Nearest cities:
Latitude: 45.06 N, Longitude: 93.08 W
Daytime population change due to commuting: +3,091 (+24.5%)Workers who live and work in this city: 1,515 (23.9%)
Property values in Vadnais Heights, MN
Single-family new house construction building permits:
2022: 17 buildings , average cost: $341,7002021: 11 buildings , average cost: $463,0002019: 18 buildings , average cost: $197,8002018: 29 buildings , average cost: $205,0002017: 1 building , cost: $250,0002016: 19 buildings , average cost: $184,4002015: 16 buildings , average cost: $179,2002014: 5 buildings , average cost: $278,0002013: 13 buildings , average cost: $156,2002012: 36 buildings , average cost: $128,2002011: 14 buildings , average cost: $162,5002010: 2 buildings , average cost: $252,5002008: 5 buildings , average cost: $293,0002007: 3 buildings , average cost: $378,0002006: 11 buildings , average cost: $248,2002005: 17 buildings , average cost: $187,7002004: 5 buildings , average cost: $216,4002003: 18 buildings , average cost: $207,1002002: 24 buildings , average cost: $187,9002001: 45 buildings , average cost: $129,6002000: 40 buildings , average cost: $131,5001999: 33 buildings , average cost: $167,3001998: 61 buildings , average cost: $116,4001997: 57 buildings , average cost: $117,200Unemployment in December 2023:
Population change in the 1990s: +1,766 (+15.6%).
Most common occupations in Vadnais Heights, MN (%)
Both Males Females
Other management occupations, except farmers and farm managers (4.8%)
Other office and administrative support workers, including supervisors (4.8%)
Material recording, scheduling, dispatching, and distributing workers (3.8%)
Other sales and related occupations, including supervisors (3.8%)
Sales representatives, services, wholesale and manufacturing (3.7%)
Other production occupations, including supervisors (3.3%)
Computer specialists (3.2%)
Other management occupations, except farmers and farm managers (5.5%)
Material recording, scheduling, dispatching, and distributing workers (5.4%)
Sales representatives, services, wholesale and manufacturing (5.2%)
Computer specialists (4.9%)
Other sales and related occupations, including supervisors (4.6%)
Other production occupations, including supervisors (4.3%)
Driver/sales workers and truck drivers (4.1%)
Other office and administrative support workers, including supervisors (8.1%)
Secretaries and administrative assistants (5.8%)
Other management occupations, except farmers and farm managers (4.2%)
Information and record clerks, except customer service representatives (4.2%)
Registered nurses (4.0%)
Accountants and auditors (3.5%)
Retail sales workers, except cashiers (3.5%)
Tornado activity:
Vadnais Heights-area historical tornado activity is slightly above Minnesota state average. It is 26% greater than the overall U.S. average.
On 5/6/1965, a category F4 (max. wind speeds 207-260 mph) tornado 7.7 miles away from the Vadnais Heights city center killed 6 people and injured 158 people and caused between $5,000,000 and $50,000,000 in damages.
On 5/6/1965, a category F4 tornado 8.9 miles away from the city center killed 3 people and injured 175 people and caused between $5,000,000 and $50,000,000 in damages.
Earthquake activity:
Vadnais Heights-area historical earthquake activity is significantly above Minnesota state average. It is 57% smaller than the overall U.S. average. On 7/9/1975 at 14:54:15, a magnitude 4.6 (4.6 MB, Class: Light, Intensity: IV - V) earthquake occurred 150.1 miles away from Vadnais Heights center On 6/5/1993 at 01:24:53, a magnitude 4.1 (4.1 LG, Depth: 6.2 mi) earthquake occurred 161.9 miles away from Vadnais Heights center On 3/4/1983 at 06:32:18, a magnitude 4.6 (4.4 MB, 4.6 LG, 4.4 ML) earthquake occurred 317.0 miles away from the city center On 10/20/1995 at 15:57:18, a magnitude 3.7 (3.7 LG, Depth: 3.1 mi, Class: Light, Intensity: II - III) earthquake occurred 190.6 miles away from the city center On 2/9/1994 at 08:45:35, a magnitude 3.1 (3.1 LG, Depth: 3.1 mi) earthquake occurred 94.1 miles away from Vadnais Heights center On 11/3/2002 at 20:41:56, a magnitude 4.3 (4.3 MB, Depth: 3.1 mi) earthquake occurred 330.3 miles away from Vadnais Heights center Magnitude types: regional Lg-wave magnitude (LG), body-wave magnitude (MB), local magnitude (ML) Natural disasters: The number of natural disasters in Ramsey County (18) is near the US average (15).Major Disasters (Presidential) Declared: 13Emergencies Declared: 3Floods: 14, Storms: 8, Tornadoes: 5, Winds: 3, Drought: 1, Hurricane: 1, Landslide: 1, Mudslide: 1, Winter Storm: 1, Other: 1 (Note: some incidents may be assigned to more than one category). Hospitals and medical centers in Vadnais Heights: SPRINGHILL (531 SPRINGHILL ROAD) Other hospitals and medical centers near Vadnais Heights: REGENCY HOME HEALTHCARE SRVCS (Home Health Center, about 3 miles away; ROSEVILLE, MN)
NORTHEAST RESIDENCE II (Hospital, about 3 miles away; LITTLE CANADA, MN)
HEALTHEAST ST JOHN'S HOSPITAL (about 3 miles away; MAPLEWOOD, MN)
AXIS ON WHITE BEAR AVENUE (Hospital, about 4 miles away; WHITE BEAR LAKE, MN)
LSS-RESIDENCE II (Hospital, about 4 miles away; SHOREVIEW, MN)
CERENITY CARE CENTER - WHITE BEAR LAKE (Nursing Home, about 4 miles away; WHITE BEAR LAKE, MN)
WHITE BEAR LAKE CTR (Nursing Home, about 4 miles away; WHITE BEAR LAKE, MN)
Amtrak station near Vadnais Heights: 9 miles: ST. PAUL/MINNEAPOLIS (ST. PAUL, 730 TRANSFER RD.) Services: ticket office, fully wheelchair accessible, enclosed waiting area, public restrooms, public payphones, vending machines, free short-term parking, free long-term parking, call for car rental service, taxi stand.
Colleges/universities with over 2000 students nearest to Vadnais Heights:
Bethel University (about 4 miles; Saint Paul, MN ; Full-time enrollment: 4,061)
Century College (about 5 miles; White Bear Lake, MN ; FT enrollment: 7,393)
University of Northwestern-St Paul (about 5 miles; Saint Paul, MN ; FT enrollment: 2,680)
Metropolitan State University (about 8 miles; Saint Paul, MN ; FT enrollment: 6,159)
Hamline University (about 8 miles; Saint Paul, MN ; FT enrollment: 3,818)
Saint Paul College (about 8 miles; Saint Paul, MN ; FT enrollment: 4,778)
Concordia University-Saint Paul (about 9 miles; Saint Paul, MN ; FT enrollment: 2,501)
Public high schools in Vadnais Heights: AFSA HIGH SCHOOL Location: 100 VADNAIS BLVD, Grades: 7-12, Charter school )
WELS NORTH Location: 4225 WHITE BEAR PKWY, Grades: 10-12)See full list of schools located in Vadnais Heights
Notable locations in Vadnais Heights: (A) , Vadnais Heights City Hall (B) . Display/hide their locations on the map
Shopping Centers: (1) , Vadnais Heights Plaza Shopping Center (2) , Vadnais Square Shopping Center (3) . Display/hide their locations on the map
Lakes: (A) , Vadnais Lake (B) , Sucker Lake (C) . Display/hide their locations on the map
Parks in Vadnais Heights include: (1) , Berwood Park (2) , Heritage Park (3) , Bridgewood Park (4) , Oak Creek Park (5) , Morningside Park (6) , Westfield Park (7) , Community Park (8) . Display/hide their locations on the map
Birthplace of: Justin Braun (ice hockey) - Ice hockey player, Justin Bostrom - Ice hockey player.
Ramsey County has a predicted average indoor radon screening level greater than 4 pCi/L (pico curies per liter) - Highest Potential Average household size: This city:
2.4 peopleMinnesota:
2.5 people
Percentage of family households: This city:
65.9%Whole state:
64.6%
Percentage of households with unmarried partners: This city:
6.4%Whole state:
6.9%
Likely homosexual households (counted as self-reported same-sex unmarried-partner households)
Lesbian couples: 0.3% of all households Gay men: 0.2% of all households
People in group quarters in Vadnais Heights in 2010:
41 people in group homes intended for adults
12 people in nursing facilities/skilled-nursing facilities
5 people in workers' group living quarters and job corps centers
4 people in residential treatment centers for adults
people in homes for the mentally retarded in 2000people in homes for the physically handicapped in 2000Banks with branches in Vadnais Heights (2011 data):
Wells Fargo Bank, National Association: Vadnais Heights Branch at 955 East County Road East, branch established on 2000/02/29. Info updated 2011/04/05: Bank assets: $1,161,490.0 mil, Deposits: $905,653.0 mil, headquarters in Sioux Falls, SD, positive income , 6395 total offices , Holding Company: Wells Fargo & Company
Farmers & Merchants Savings Bank: Vadnais Heights Branch at 845 East County Road 32, branch established on 1998/12/07. Info updated 2011/01/06: Bank assets: $336.5 mil, Deposits: $278.7 mil, headquarters in Manchester, IA, positive income , Commercial Lending Specialization, 6 total offices , Holding Company: Dunn Investment Co.
For population 15 years and over in Vadnais Heights:
Never married: 27.7%Now married: 55.8%Separated: 0.7%Widowed: 5.6%Divorced: 10.2% For population 25 years and over in Vadnais Heights:
High school or higher: 96.1%Bachelor's degree or higher: 44.0%Graduate or professional degree: 16.9%Unemployed: 2.9%Mean travel time to work (commute): 18.7 minutes
Education Gini index (Inequality in education) Here:
10.3Minnesota average:
10.9
Religion statistics for Vadnais Heights, MN (based on Ramsey County data)
Religion Adherents Congregations Catholic 124,823 44 Mainline Protestant 64,738 123 Evangelical Protestant 42,137 154 Other 17,440 38 Black Protestant 5,032 13 Orthodox 2,070 9 None 252,400 -
Source: Clifford Grammich, Kirk Hadaway, Richard Houseal, Dale E.Jones, Alexei Krindatch, Richie Stanley and Richard H.Taylor. 2012. 2010 U.S.Religion Census: Religious Congregations & Membership Study. Association of Statisticians of American Religious Bodies. Jones, Dale E., et al. 2002. Congregations and Membership in the United States 2000. Nashville, TN: Glenmary Research Center. Graphs represent county-level data
Food Environment Statistics: Number of grocery stores : 91Ramsey County :
1.83 / 10,000 pop.Minnesota :
1.83 / 10,000 pop.
Number of supercenters and club stores : 3Ramsey County :
0.06 / 10,000 pop.Minnesota :
0.13 / 10,000 pop.
Number of convenience stores (no gas) : 27Here :
0.54 / 10,000 pop.State :
0.49 / 10,000 pop.
Number of convenience stores (with gas) : 138This county :
2.77 / 10,000 pop.State :
3.90 / 10,000 pop.
Number of full-service restaurants : 337Ramsey County :
6.76 / 10,000 pop.Minnesota :
6.98 / 10,000 pop.
Adult diabetes rate : Ramsey County :
7.3%Minnesota :
6.5%
Adult obesity rate : Ramsey County :
25.5%State :
25.9%
Low-income preschool obesity rate : Ramsey County :
14.7%State :
13.0%
Health and Nutrition: Healthy diet rate : Vadnais Heights:
52.6%State:
50.6%
Average overall health of teeth and gums : Vadnais Heights:
51.6%State:
48.4%
Average BMI : Vadnais Heights:
28.2Minnesota:
28.5
People feeling badly about themselves : Vadnais Heights:
19.6%Minnesota:
21.0%
People not drinking alcohol at all : Average hours sleeping at night : This city:
6.9Minnesota:
6.8
Overweight people : Vadnais Heights:
33.7%State:
33.5%
General health condition : This city:
59.9%Minnesota:
57.7%
Average condition of hearing : Here:
80.7%Minnesota:
79.3%
More about Health and Nutrition of Vadnais Heights, MN Residents
Local government employment and payroll (March 2022)
Function
Full-time employees
Monthly full-time payroll
Average yearly full-time wage
Part-time employees
Monthly part-time payroll
Other Government Administration
5 $49,474 $118,738 9 $12,566 Parks and Recreation
5 $35,349 $84,838 0 $0 Firefighters
4 $34,002 $102,006 41 $28,663 Other and Unallocable
3 $29,869 $119,476 4 $2,209 Water Supply
3 $18,983 $75,932 0 $0 Sewerage
2 $13,203 $79,218 0 $0 Fire - Other
1 $5,646 $67,752 0 $0 Financial Administration
1 $11,743 $140,916 1 $6,045 Streets and Highways
1 $10,987 $131,844 0 $0
Totals for Government
25 $209,256 $100,443 55 $49,483
Vadnais Heights government finances - Expenditure in 2021 (per resident):
Construction - Regular Highways: $1,999,000 ($157.24)
Current Operations - Sewerage: $1,835,000 ($144.34)
Police Protection: $1,505,000 ($118.38)Regular Highways: $1,428,000 ($112.33)Local Fire Protection: $1,198,000 ($94.23)General - Other: $1,005,000 ($79.05)Water Utilities: $942,000 ($74.10)Financial Administration: $845,000 ($66.47)Parks and Recreation: $788,000 ($61.98)Central Staff Services: $117,000 ($9.20)Solid Waste Management: $26,000 ($2.05)General - Interest on Debt: $351,000 ($27.61)
Other Capital Outlay - Sewerage: $466,000 ($36.66)
Regular Highways: $408,000 ($32.09)Parks and Recreation: $163,000 ($12.82)Water Utilities: $60,000 ($4.72)General - Other: $34,000 ($2.67)
Vadnais Heights government finances - Revenue in 2021 (per resident):
Charges - Sewerage: $2,089,000 ($164.32)
Other: $630,000 ($49.56)Regular Highways: $312,000 ($24.54)Parks and Recreation: $159,000 ($12.51)Federal Intergovernmental - Health and Hospitals: $994,000 ($78.19)
Local Intergovernmental - Other: $90,000 ($7.08)
Miscellaneous - Special Assessments: $508,000 ($39.96)
General Revenue - Other: $255,000 ($20.06)Interest Earnings: $197,000 ($15.50)Fines and Forfeits: $15,000 ($1.18)Revenue - Water Utilities: $2,290,000 ($180.13)
State Intergovernmental - Highways: $1,223,000 ($96.20)
Other: $4,000 ($0.31)Tax - Property: $4,874,000 ($383.39)
Public Utilities Sales: $414,000 ($32.57)Other License: $359,000 ($28.24)
Vadnais Heights government finances - Debt in 2021 (per resident):
Long Term Debt - Retired Unspecified Public Purpose: $5,530,000 ($434.99)
Beginning Outstanding - Unspecified Public Purpose: $5,530,000 ($434.99)Outstanding Unspecified Public Purpose: $5,380,000 ($423.19)Issue, Unspecified Public Purpose: $5,380,000 ($423.19)
Vadnais Heights government finances - Cash and Securities in 2021 (per resident):
Other Funds - Cash and Securities: $12,529,000 ($985.53)
8.61% of this county's 2021 resident taxpayers lived in other counties in 2020 ($57,378 average adjusted gross income )
Here:
8.61%Minnesota average:
7.43%
0.01% of residents moved from foreign countries ($84 average AGI )Ramsey County:
0.01%Minnesota average:
0.00%
Top counties from which taxpayers relocated into this county between 2020 and 2021:
Businesses in Vadnais Heights, MN
Name Count Name Count
Chipotle 1 Panera Bread 1 Famous Footwear 1 RadioShack 1 Fashion Bug 1 Subaru 1 FedEx 2 T-Mobile 3 GNC 1 Target 1 H&R Block 1 UPS 2 Holiday Inn 1 Walmart 1 KFC 1
Strongest AM radio stations in Vadnais Heights:
KSTP (1500 AM; 50 kW; ST. PAUL, MN; Owner: KSTP-AM, LLC (DELAWARE))
KTIS (900 AM; 25 kW; MINNEAPOLIS, MN; Owner: NORTHWESTERN COLLEGE)
WCCO (830 AM; 50 kW; MINNEAPOLIS, MN; Owner: INFINITY MEDIA CORPORATION)
WCTS (1030 AM; 50 kW; MAPLEWOOD, MN; Owner: CNTL. BAPT. THEO/AL SEMI MINNEAPOLIS)
KUOM (770 AM; daytime; 5 kW; MINNEAPOLIS, MN)
KFAN (1130 AM; 50 kW; MINNEAPOLIS, MN; Owner: AMFM RADIO LICENSES, L.L.C.)
WMGT (1220 AM; 5 kW; STILLWATER, MN; Owner: ENDURANCE BROADCASTING, LLC)
WDGY (630 AM; 8 kW; HUDSON, WI; Owner: 630 RADIO, INCORPORATED)
KDIZ (1440 AM; 5 kW; GOLDEN VALLEY, MN; Owner: KQRS, INC.)
WWTC (1280 AM; 5 kW; MINNEAPOLIS, MN; Owner: SCA LICENSE CORPORATION)
KLBP (1470 AM; 5 kW; BROOKLYN PARK, MN; Owner: 1400, INC.)
WMNN (1330 AM; 10 kW; MINNEAPOLIS, MN; Owner: MINNESOTA PUBLIC RADIO.)
KKMS (980 AM; 5 kW; RICHFIELD, MN)
Strongest FM radio stations in Vadnais Heights:
KEEY-FM (102.1 FM; ST. PAUL, MN; Owner: AMFM RADIO LICENSES, L.L.C.)
KTIS-FM (98.5 FM; MINNEAPOLIS, MN; Owner: NORTHWESTERN COLLEGE)
KDWB-FM (101.3 FM; RICHFIELD, MN; Owner: AMFM RADIO LICENSES, L.L.C.)
KQRS-FM (92.5 FM; GOLDEN VALLEY, MN; Owner: KQRS, Inc.)
KSJN (99.5 FM; MINNEAPOLIS, MN; Owner: MINNESOTA PUBLIC RADIO)
KXXR (93.7 FM; MINNEAPOLIS, MN; Owner: KQRS, INC.)
KNOW-FM (91.1 FM; MINNEAPOLIS-ST. PAUL, MN; Owner: MINNESOTA PUBLIC RADIO)
WLTE (102.9 FM; MINNEAPOLIS, MN; Owner: INFINITY MEDIA CORPORATION)
KSTP-FM (94.5 FM; ST. PAUL, MN; Owner: KSTP-FM, LLC, A DELAWARE LLC)
KBEM-FM (88.5 FM; MINNEAPOLIS, MN; Owner: BD. OF EDUCATION, S.S.D. NO. 1)
WFMP (107.1 FM; COON RAPIDS, MN; Owner: WFMP-FM, LLC)
KTCZ-FM (97.1 FM; MINNEAPOLIS, MN; Owner: AMFM RADIO LICENSES, L.L.C.)
K214DF (90.7 FM; GOLDEN VALLEY, MN; Owner: EDUCATIONAL MEDIA FOUNDATION)
WXPT (104.1 FM; ST. LOUIS PARK, MN; Owner: THE AUDIO HOUSE, INC.)
KQQL (107.9 FM; ANOKA, MN; Owner: AMFM RADIO LICENSES, L.L.C.)
KNOF (95.3 FM; ST. PAUL, MN; Owner: SELBY GOSPEL BROADCASTING CORPORATION)
KFAI (90.3 FM; MINNEAPOLIS, MN; Owner: FRESH AIR, INC.)
KJZI (100.3 FM; MINNEAPOLIS, MN; Owner: AMFM RADIO LICENSES, L.L.C.)
K294AM (106.7 FM; WEST ST. PAUL, MN; Owner: FRESH AIR, INCORPORATED)
WCAL (89.3 FM; NORTHFIELD, MN; Owner: ST. OLAF COLLEGE)
TV broadcast stations around Vadnais Heights:
KMSP-TV (Channel 9; MINNEAPOLIS, MN; Owner: FOX TELEVISION STATIONS, INC.)
KTCA-TV (Channel 2; ST. PAUL, MN; Owner: TWIN CITIES PUBLIC TELEVISION, INC.)
KTCI-TV (Channel 17; ST. PAUL, MN; Owner: TWIN CITIES PUBLIC TELEVISION, INC.)
KARE (Channel 11; MINNEAPOLIS, MN; Owner: MULTIMEDIA HOLDINGS CORPORATION)
KMWB (Channel 23; MINNEAPOLIS, MN; Owner: KLGT LICENSEE, LLC)
KSTP-TV (Channel 5; ST. PAUL, MN; Owner: HUBBARD BROADCASTING, INC.)
WFTC (Channel 29; MINNEAPOLIS, MN; Owner: FOX TELEVISION STATIONS, INC.)
WCCO-TV (Channel 4; MINNEAPOLIS, MN; Owner: CBS BROADCASTING INC.)
KSTC-TV (Channel 45; MINNEAPOLIS, MN; Owner: HUBBARD BROADCASTING, INC.)
K07UI (Channel 7; MINNEAPOLIS, ETC., MN; Owner: WORD OF GOD FELLOWSHIP, INC.)
K58BS (Channel 58; MINNEAPOLIS, MN; Owner: TRINITY BROADCASTING NETWORK)
K67HG (Channel 67; MINNEAPOLIS, MN; Owner: VENTANA TELEVISION, INC.)
K19ER (Channel 19; ST. PAUL, MN; Owner: CATHOLIC VIEWS BROADCASTS, INC.)
K14KH (Channel 14; MINNEAPOLIS, MN; Owner: THREE ANGELS BROADCASTING NETWORK)
W62BD (Channel 62; MINNEAPOLIS, MN; Owner: WORD OF GOD FELLOWSHIP, INC.)
WBWX-CA (Channel 13; MINNEAPOLIS, MN; Owner: THE BOX WORLDWIDE LLC)
KPXM (Channel 41; ST. CLOUD, MN; Owner: PAXSON MINNEAPOLIS LICENSE, INC.)
W55AP (Channel 55; RIVER FALLS, WI; Owner: STATE OF WISCONSIN - EDUCATIONAL COMMUNICATIONS BOARD)
National Bridge Inventory (NBI) Statistics 29 Number of bridges358ft / 109m Total length $114,001,000 Total costs1,136,366 Total average daily traffic60,947 Total average daily truck traffic
New bridges - historical statistics
1 1950-1959 5 1960-1969 2 1990-1999 13 2000-2009 6 2010-2019 2 2020-2022
See full National Bridge Inventory statistics for Vadnais Heights, MN
FCC Registered Antenna Towers: 5
Property Management, 3645 Centerville Rd. (Lat: 45.052472 Lon: -93.068944), Type: 27.4, Overall height: 27.4 m, Registrant: Wireless Applications Corporaiton, Fcc@wacorp.Net, , Belle-vue, Phone: (425) 643-5000 Property Management, 3645 Centerville Rd. (Lat: 45.052472 Lon: -93.068944), Type: 27.4, Overall height: 27.4 m, Registrant: Wireless Applications Corporaiton, Fcc@wacorp.Net, , Belle-vue, Phone: (425) 643-5000 Kristin A Steiner, 3645 Centerville Rd. (Lat: 45.052472 Lon: -93.068944), Type: 27.4, Overall height: 27.4 m, Registrant: Pm@mobilitie.Com, , Newpo-rt Beach, Phone: (949) 515-1500 Edward G Roach, 3645 Centerville Rd. (Lat: 45.052472 Lon: -93.068944), Type: 27.4, Overall height: 27.4 m, Registrant: Sba Monarch Towers Ii, LLC, Eroach@sbasite.Com, , Boca -Raton, Phone: (561) 995-7670 Edward G Roach, 3645 Centerville Rd. (Lat: 45.052472 Lon: -93.068944), Type: 27.4, Structure height: 27123 m, Overall height: 27.4 m, Registrant: Sba Monarch Towers Ii, LLC, Eroach@sbasite.Com, , Boca -Raton, Phone: (561) 995-7670 FCC Registered Broadcast Land Mobile Towers: 8 (
See the full list of FCC Registered Broadcast Land Mobile Towers in Vadnais Heights, MN )
FCC Registered Microwave Towers: 3
MSPCST, 390 Commerce Ct. (Lat: 45.073278 Lon: -93.084694), Type: Tank, Structure height: 36 m, Call Sign: WQJZ990, Assigned Frequencies: 17890.0 MHz, 17890.0 MHz, Grant Date: 03/03/2009, Expiration Date: 03/03/2019, Cancellation Date: 05/04/2019, Certifier: Kurt Maass, Registrant: Telecom Transport Management, Inc., 146 N. Canal Street, Suite 210, Seattle, WA 98103, Phone: (206) 816-6907, Fax: (206) 545-9585, Email:
MSPLRD, 3391 Labore Road (Lat: 45.044194 Lon: -93.057694), Type: Pole, Structure height: 22.9 m, Call Sign: WQKS463, Assigned Frequencies: 21530.0 MHz, Grant Date: 09/01/2009, Expiration Date: 09/01/2019, Cancellation Date: 11/02/2019, Certifier: Alan Macdonald, Registrant: Telecom Transport Management, Inc., 146 N. Canal Street, Suite 210, Seattle, WA 98103, Phone: (206) 816-6907, Fax: (206) 545-9585, Email:
MN-MSP0024B, 969 Labore Industrial Court (Lat: 45.039750 Lon: -93.060028), Type: Pole, Structure height: 24.4 m, Call Sign: WQLZ436, Assigned Frequencies: 19675.0 MHz, Grant Date: 06/30/2020, Expiration Date: 06/04/2030, Cancellation Date: 06/24/2021, Certifier: Nadja S Sodos-Wallace, Registrant: Sprint Corporation, 12502 Sunrise Valley Drive, M/S: Varesa0209, Reston, VA 20196, Phone: (800) 572-8256, Fax: (703) 433-4483, Email:
FCC Registered Amateur Radio Licenses: 39 (
See the full list of FCC Registered Amateur Radio Licenses in Vadnais Heights )
FAA Registered Aircraft: 10 (
See the full list of FAA Registered Aircraft in Vadnais Heights )
Home Mortgage Disclosure Act Aggregated Statistics For Year 2009(Based on 2 full tracts) A) FHA, FSA/RHS & VA B) Conventional C) Refinancings D) Home Improvement Loans E) Loans on Dwellings For 5+ Families F) Non-occupant Loans on G) Loans On Manufactured Number Average Value Number Average Value Number Average Value Number Average Value Number Average Value Number Average Value Number Average Value
LOANS ORIGINATED 67 $152,797 74 $187,579 368 $192,439 19 $60,807 1 $4,650,000 13 $128,110 1 $37,690 APPLICATIONS APPROVED, NOT ACCEPTED 1 $309,000 8 $259,815 41 $202,188 5 $17,074 0 $0 1 $204,330 1 $120,000 APPLICATIONS DENIED 3 $131,253 13 $157,497 80 $175,241 7 $36,461 0 $0 3 $106,903 1 $57,000 APPLICATIONS WITHDRAWN 1 $105,000 8 $186,429 72 $218,262 2 $190,500 0 $0 1 $94,230 0 $0 FILES CLOSED FOR INCOMPLETENESS 2 $144,815 2 $41,395 34 $178,855 4 $37,722 0 $0 0 $0 0 $0
Aggregated Statistics For Year 2008(Based on 2 full tracts) A) FHA, FSA/RHS & VA B) Conventional C) Refinancings D) Home Improvement Loans F) Non-occupant Loans on G) Loans On Manufactured Number Average Value Number Average Value Number Average Value Number Average Value Number Average Value Number Average Value
LOANS ORIGINATED 47 $184,487 79 $192,791 147 $176,031 34 $54,514 16 $231,264 2 $24,795 APPLICATIONS APPROVED, NOT ACCEPTED 3 $156,043 12 $246,758 20 $146,186 4 $25,642 2 $240,535 3 $37,827 APPLICATIONS DENIED 3 $166,613 19 $158,596 73 $190,308 10 $169,415 4 $134,705 8 $36,268 APPLICATIONS WITHDRAWN 2 $108,500 8 $178,271 40 $184,410 3 $96,850 1 $275,000 0 $0 FILES CLOSED FOR INCOMPLETENESS 0 $0 1 $269,800 13 $192,097 4 $32,420 1 $269,800 0 $0
Aggregated Statistics For Year 2007(Based on 2 full tracts) A) FHA, FSA/RHS & VA B) Conventional C) Refinancings D) Home Improvement Loans E) Loans on Dwellings For 5+ Families F) Non-occupant Loans on G) Loans On Manufactured Number Average Value Number Average Value Number Average Value Number Average Value Number Average Value Number Average Value Number Average Value
LOANS ORIGINATED 7 $153,926 123 $167,062 185 $158,167 46 $57,542 1 $243,020 23 $177,997 2 $30,255 APPLICATIONS APPROVED, NOT ACCEPTED 1 $165,650 12 $166,649 39 $176,537 7 $60,190 0 $0 1 $135,000 3 $41,000 APPLICATIONS DENIED 0 $0 32 $158,265 98 $183,316 12 $77,567 0 $0 9 $204,821 9 $46,068 APPLICATIONS WITHDRAWN 0 $0 14 $216,061 42 $177,103 5 $132,850 0 $0 3 $241,000 0 $0 FILES CLOSED FOR INCOMPLETENESS 0 $0 3 $172,367 18 $210,602 2 $39,695 0 $0 1 $150,000 0 $0
Aggregated Statistics For Year 2006(Based on 2 full tracts) A) FHA, FSA/RHS & VA B) Conventional C) Refinancings D) Home Improvement Loans E) Loans on Dwellings For 5+ Families F) Non-occupant Loans on G) Loans On Manufactured Number Average Value Number Average Value Number Average Value Number Average Value Number Average Value Number Average Value Number Average Value
LOANS ORIGINATED 10 $167,657 214 $164,196 213 $163,040 57 $58,672 1 $44,640 14 $150,633 2 $35,210 APPLICATIONS APPROVED, NOT ACCEPTED 1 $202,350 24 $188,688 49 $145,706 9 $47,078 0 $0 3 $281,333 3 $33,063 APPLICATIONS DENIED 0 $0 41 $171,844 120 $192,056 10 $83,682 0 $0 9 $125,530 4 $34,965 APPLICATIONS WITHDRAWN 1 $191,440 24 $164,547 90 $184,953 11 $66,057 0 $0 3 $113,237 0 $0 FILES CLOSED FOR INCOMPLETENESS 0 $0 4 $107,372 19 $153,343 2 $79,350 0 $0 3 $92,577 0 $0
Aggregated Statistics For Year 2005(Based on 2 full tracts) A) FHA, FSA/RHS & VA B) Conventional C) Refinancings D) Home Improvement Loans E) Loans on Dwellings For 5+ Families F) Non-occupant Loans on G) Loans On Manufactured Number Average Value Number Average Value Number Average Value Number Average Value Number Average Value Number Average Value Number Average Value
LOANS ORIGINATED 18 $146,131 249 $183,555 359 $173,654 47 $45,182 2 $73,400 33 $166,252 3 $28,197 APPLICATIONS APPROVED, NOT ACCEPTED 0 $0 22 $187,230 49 $140,579 7 $27,611 0 $0 2 $174,605 1 $23,000 APPLICATIONS DENIED 0 $0 50 $111,156 125 $168,918 13 $51,748 0 $0 11 $113,708 14 $42,864 APPLICATIONS WITHDRAWN 3 $171,787 27 $154,670 119 $203,544 18 $107,964 0 $0 3 $195,453 0 $0 FILES CLOSED FOR INCOMPLETENESS 1 $148,790 8 $184,516 29 $175,120 6 $54,607 0 $0 3 $128,997 0 $0
Aggregated Statistics For Year 2004(Based on 2 full tracts) A) FHA, FSA/RHS & VA B) Conventional C) Refinancings D) Home Improvement Loans F) Non-occupant Loans on G) Loans On Manufactured Number Average Value Number Average Value Number Average Value Number Average Value Number Average Value Number Average Value
LOANS ORIGINATED 21 $147,569 246 $169,886 387 $166,804 54 $56,848 17 $148,368 7 $38,826 APPLICATIONS APPROVED, NOT ACCEPTED 0 $0 16 $203,232 61 $147,255 7 $121,274 2 $123,770 2 $33,230 APPLICATIONS DENIED 1 $195,400 24 $113,887 106 $152,911 12 $54,066 4 $93,128 11 $34,897 APPLICATIONS WITHDRAWN 0 $0 18 $170,538 111 $172,963 9 $65,193 5 $103,156 1 $24,800 FILES CLOSED FOR INCOMPLETENESS 1 $182,000 2 $129,000 25 $193,521 4 $87,250 0 $0 0 $0
Aggregated Statistics For Year 2003(Based on 2 full tracts) A) FHA, FSA/RHS & VA B) Conventional C) Refinancings D) Home Improvement Loans E) Loans on Dwellings For 5+ Families F) Non-occupant Loans on Number Average Value Number Average Value Number Average Value Number Average Value Number Average Value Number Average Value
LOANS ORIGINATED 62 $153,464 284 $172,290 1,284 $147,633 44 $44,455 2 $405,190 33 $150,206 APPLICATIONS APPROVED, NOT ACCEPTED 4 $146,208 20 $119,054 105 $149,508 5 $24,744 0 $0 5 $147,672 APPLICATIONS DENIED 2 $208,815 32 $99,414 127 $150,645 17 $20,246 0 $0 1 $52,570 APPLICATIONS WITHDRAWN 1 $168,000 21 $171,451 183 $145,239 6 $29,133 2 $214,000 4 $213,518 FILES CLOSED FOR INCOMPLETENESS 0 $0 6 $259,180 29 $140,419 0 $0 0 $0 0 $0
Aggregated Statistics For Year 2002(Based on 2 full tracts) A) FHA, FSA/RHS & VA B) Conventional C) Refinancings D) Home Improvement Loans F) Non-occupant Loans on Number Average Value Number Average Value Number Average Value Number Average Value Number Average Value
LOANS ORIGINATED 50 $148,291 266 $171,556 916 $143,046 34 $44,676 16 $134,580 APPLICATIONS APPROVED, NOT ACCEPTED 2 $133,000 25 $95,692 90 $130,657 15 $29,521 0 $0 APPLICATIONS DENIED 1 $168,000 27 $115,588 124 $117,637 14 $25,615 3 $80,043 APPLICATIONS WITHDRAWN 3 $171,333 20 $163,218 148 $134,737 3 $80,680 0 $0 FILES CLOSED FOR INCOMPLETENESS 0 $0 3 $163,333 34 $142,979 1 $9,920 2 $74,960
Aggregated Statistics For Year 2001(Based on 2 full tracts) A) FHA, FSA/RHS & VA B) Conventional C) Refinancings D) Home Improvement Loans F) Non-occupant Loans on Number Average Value Number Average Value Number Average Value Number Average Value Number Average Value
LOANS ORIGINATED 58 $140,889 266 $142,095 695 $129,288 51 $32,531 17 $117,796 APPLICATIONS APPROVED, NOT ACCEPTED 0 $0 14 $158,479 70 $102,274 9 $38,770 3 $154,407 APPLICATIONS DENIED 1 $153,000 28 $66,630 106 $120,613 8 $19,905 4 $202,305 APPLICATIONS WITHDRAWN 1 $132,000 12 $188,987 108 $115,299 8 $25,419 3 $90,667 FILES CLOSED FOR INCOMPLETENESS 0 $0 3 $152,860 20 $129,740 4 $15,500 0 $0
Aggregated Statistics For Year 2000(Based on 2 full tracts) A) FHA, FSA/RHS & VA B) Conventional C) Refinancings D) Home Improvement Loans F) Non-occupant Loans on Number Average Value Number Average Value Number Average Value Number Average Value Number Average Value
LOANS ORIGINATED 62 $119,465 237 $139,174 150 $92,343 60 $27,808 13 $129,230 APPLICATIONS APPROVED, NOT ACCEPTED 1 $125,970 17 $101,052 21 $55,944 15 $21,438 1 $8,930 APPLICATIONS DENIED 1 $130,000 45 $64,487 66 $78,973 31 $15,022 2 $189,950 APPLICATIONS WITHDRAWN 1 $97,210 13 $86,724 46 $93,131 6 $69,187 1 $15,000 FILES CLOSED FOR INCOMPLETENESS 0 $0 3 $181,347 15 $147,586 2 $23,350 0 $0
Aggregated Statistics For Year 1999(Based on 2 full tracts) A) FHA, FSA/RHS & VA B) Conventional C) Refinancings D) Home Improvement Loans E) Loans on Dwellings For 5+ Families F) Non-occupant Loans on Number Average Value Number Average Value Number Average Value Number Average Value Number Average Value Number Average Value
LOANS ORIGINATED 62 $112,218 248 $132,428 309 $103,759 64 $19,725 2 $559,020 7 $107,791 APPLICATIONS APPROVED, NOT ACCEPTED 1 $161,840 9 $113,892 51 $85,607 9 $41,512 0 $0 0 $0 APPLICATIONS DENIED 1 $99,670 30 $41,245 67 $81,158 20 $15,853 0 $0 0 $0 APPLICATIONS WITHDRAWN 1 $103,660 12 $135,599 61 $98,007 5 $45,142 0 $0 2 $74,505 FILES CLOSED FOR INCOMPLETENESS 0 $0 6 $146,822 24 $102,715 2 $29,900 0 $0 0 $0
Detailed HMDA statistics for the following Tracts:
0406.03
, 0406.04
Private Mortgage Insurance Companies Aggregated Statistics For Year 2009(Based on 2 full tracts) A) Conventional B) Refinancings Number Average Value Number Average Value
LOANS ORIGINATED 18 $176,284 5 $233,594 APPLICATIONS APPROVED, NOT ACCEPTED 4 $136,058 4 $201,358 APPLICATIONS DENIED 0 $0 1 $204,330 APPLICATIONS WITHDRAWN 0 $0 2 $156,225 FILES CLOSED FOR INCOMPLETENESS 1 $212,000 0 $0
Aggregated Statistics For Year 2008(Based on 2 full tracts) A) Conventional B) Refinancings C) Non-occupant Loans on Number Average Value Number Average Value Number Average Value
LOANS ORIGINATED 22 $182,445 11 $203,140 2 $137,000 APPLICATIONS APPROVED, NOT ACCEPTED 10 $204,248 9 $276,492 2 $159,250 APPLICATIONS DENIED 1 $175,000 1 $268,000 0 $0 APPLICATIONS WITHDRAWN 0 $0 2 $197,500 1 $158,000 FILES CLOSED FOR INCOMPLETENESS 2 $172,500 1 $143,000 1 $143,000
Aggregated Statistics For Year 2007(Based on 2 full tracts) A) Conventional B) Refinancings C) Non-occupant Loans on Number Average Value Number Average Value Number Average Value
LOANS ORIGINATED 42 $198,965 29 $203,817 1 $292,000 APPLICATIONS APPROVED, NOT ACCEPTED 8 $173,715 4 $188,290 0 $0 APPLICATIONS DENIED 1 $153,740 1 $122,000 0 $0 APPLICATIONS WITHDRAWN 1 $134,000 0 $0 0 $0 FILES CLOSED FOR INCOMPLETENESS 1 $145,810 0 $0 0 $0
Aggregated Statistics For Year 2006(Based on 2 full tracts) A) Conventional B) Refinancings Number Average Value Number Average Value
LOANS ORIGINATED 36 $206,572 6 $201,388 APPLICATIONS APPROVED, NOT ACCEPTED 0 $0 3 $226,760 APPLICATIONS DENIED 0 $0 1 $164,000 APPLICATIONS WITHDRAWN 1 $148,790 0 $0 FILES CLOSED FOR INCOMPLETENESS 0 $0 0 $0
Aggregated Statistics For Year 2005(Based on 2 full tracts) A) Conventional B) Refinancings C) Non-occupant Loans on Number Average Value Number Average Value Number Average Value
LOANS ORIGINATED 21 $194,377 15 $198,601 0 $0 APPLICATIONS APPROVED, NOT ACCEPTED 1 $160,690 2 $149,500 1 $160,690 APPLICATIONS DENIED 0 $0 0 $0 0 $0 APPLICATIONS WITHDRAWN 1 $181,000 4 $186,598 1 $282,690 FILES CLOSED FOR INCOMPLETENESS 0 $0 1 $144,000 0 $0
Aggregated Statistics For Year 2004(Based on 2 full tracts) A) Conventional B) Refinancings C) Non-occupant Loans on Number Average Value Number Average Value Number Average Value
LOANS ORIGINATED 42 $175,062 24 $183,671 4 $162,175 APPLICATIONS APPROVED, NOT ACCEPTED 7 $184,844 13 $182,340 2 $141,450 APPLICATIONS DENIED 0 $0 1 $108,000 0 $0 APPLICATIONS WITHDRAWN 5 $146,778 7 $184,590 4 $144,315 FILES CLOSED FOR INCOMPLETENESS 2 $142,490 0 $0 0 $0
Aggregated Statistics For Year 2003(Based on 2 full tracts) A) Conventional B) Refinancings C) Non-occupant Loans on Number Average Value Number Average Value Number Average Value
LOANS ORIGINATED 77 $184,034 72 $159,176 6 $180,257 APPLICATIONS APPROVED, NOT ACCEPTED 8 $161,064 16 $166,552 1 $120,000 APPLICATIONS DENIED 0 $0 0 $0 0 $0 APPLICATIONS WITHDRAWN 4 $145,825 4 $201,882 1 $129,940 FILES CLOSED FOR INCOMPLETENESS 1 $129,940 0 $0 1 $129,940
Aggregated Statistics For Year 2002(Based on 2 full tracts) A) Conventional B) Refinancings C) Non-occupant Loans on Number Average Value Number Average Value Number Average Value
LOANS ORIGINATED 81 $162,784 56 $167,114 4 $132,428 APPLICATIONS APPROVED, NOT ACCEPTED 5 $180,080 6 $174,482 0 $0 APPLICATIONS DENIED 0 $0 1 $110,100 0 $0 APPLICATIONS WITHDRAWN 1 $152,000 4 $207,170 1 $284,680 FILES CLOSED FOR INCOMPLETENESS 0 $0 2 $209,000 0 $0
Aggregated Statistics For Year 2001(Based on 2 full tracts) A) Conventional B) Refinancings C) Non-occupant Loans on Number Average Value Number Average Value Number Average Value
LOANS ORIGINATED 84 $144,634 38 $139,422 1 $105,000 APPLICATIONS APPROVED, NOT ACCEPTED 6 $128,518 3 $161,890 0 $0 APPLICATIONS DENIED 1 $179,000 0 $0 0 $0 APPLICATIONS WITHDRAWN 2 $145,330 1 $138,870 1 $164,660 FILES CLOSED FOR INCOMPLETENESS 0 $0 1 $172,590 0 $0
Aggregated Statistics For Year 2000(Based on 2 full tracts) A) Conventional B) Refinancings C) Non-occupant Loans on Number Average Value Number Average Value Number Average Value
LOANS ORIGINATED 74 $134,914 9 $108,553 1 $134,000 APPLICATIONS APPROVED, NOT ACCEPTED 7 $144,673 2 $122,995 0 $0 APPLICATIONS DENIED 2 $109,110 1 $149,780 0 $0 APPLICATIONS WITHDRAWN 0 $0 1 $133,910 0 $0 FILES CLOSED FOR INCOMPLETENESS 0 $0 0 $0 0 $0
Aggregated Statistics For Year 1999(Based on 2 full tracts) A) Conventional B) Refinancings C) Non-occupant Loans on Number Average Value Number Average Value Number Average Value
LOANS ORIGINATED 82 $120,655 24 $126,620 0 $0 APPLICATIONS APPROVED, NOT ACCEPTED 5 $142,430 5 $177,168 1 $133,560 APPLICATIONS DENIED 0 $0 3 $129,903 0 $0 APPLICATIONS WITHDRAWN 1 $149,510 0 $0 0 $0 FILES CLOSED FOR INCOMPLETENESS 0 $0 0 $0 0 $0
Detailed PMIC statistics for the following Tracts:
0406.03
, 0406.04 Fire-safe hotels and motels in Vadnais Heights, Minnesota:
Holiday Inn Express Hotel & Suites, 1100 E County Rd E, Vadnais Heights, Minnesota 55110 Phone: (651) 484-2400, Fax: (651) 486-0033
Country Inn & Suites, Vadnais Heights, 3505 Vadnais Center Dr, Vadnais Heights, Minnesota 55110 Phone: (651) 483-1625, Fax: (651) 483-1645
Fairfield Inn & Suites Stpaul Northeast, 1125 E County Rd E, Vadnais Heights, Minnesota 55110 Phone: (651) 797-3008
All 3 fire-safe hotels and motels in Vadnais Heights, Minnesota Vadnais Heights compared to Minnesota state average:
Unemployed percentage significantly below state average. Renting percentage below state average. Length of stay since moving in significantly above state average. Number of college students below state average. Percentage of population with a bachelor's degree or higher above state average. Vadnais Heights on our top lists :
#10 on the list of "Top 101 cities with the most residents born in Other South Central Asia (population 500+)"
#82 on the list of "Top 101 cities with the largest positive percentage difference between never married females and males (15+ years) (with at least 1,000 females never married)"
#100 (55127) on the list of "Top 101 zip codes with the largest percentage of Swedish first ancestries (pop 5,000+)"
#13 on the list of "Top 101 counties with the highest percentage of residents that exercised in the past month"
#14 on the list of "Top 101 counties with the highest carbon monoxide air pollution readings in 2012 (ppm)"
#34 on the list of "Top 101 counties with the highest percentage of residents that visited a dentist within the past year"
#34 on the list of "Top 101 counties with the largest increase in the number of births per 1000 residents 2000-2006 to 2007-2013 (pop 50,000+)"
#38 on the list of "Top 101 counties with the largest increase in the number of infant deaths per 1000 residents 2000-2006 to 2007-2013 (pop. 50,000+)"
Top Patent Applicants
Shantha Arcot-Krishnamurthy (51)
Avram Scheiner (50)
Mark Allen Gaertner (45)
Paul E. Zarembo (26)
Joseph J. Viavattine (22)
Leah Ranae Bresin Hanson (20)
Michael Charles Denoma (18)
Andrea L. Mccarthy (18)
Hyun J. Yoon (17)
Michael E. Hamerly (14)
Total of 669 patent applications in 2008-2024.
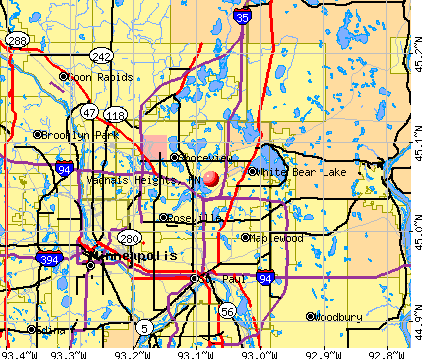


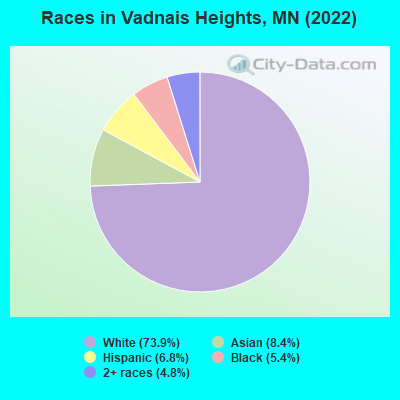
 Recent articles from our blog. Our writers, many of them Ph.D. graduates or candidates, create easy-to-read articles on a wide variety of topics.

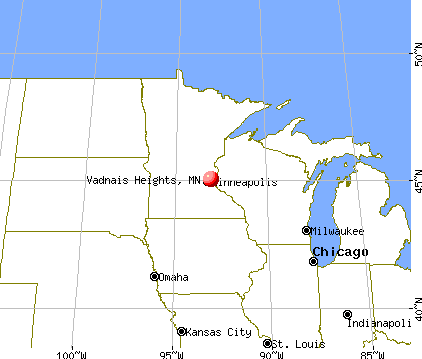
 (7.4 miles
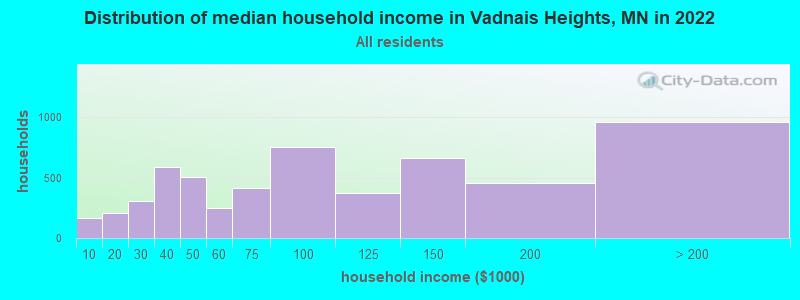
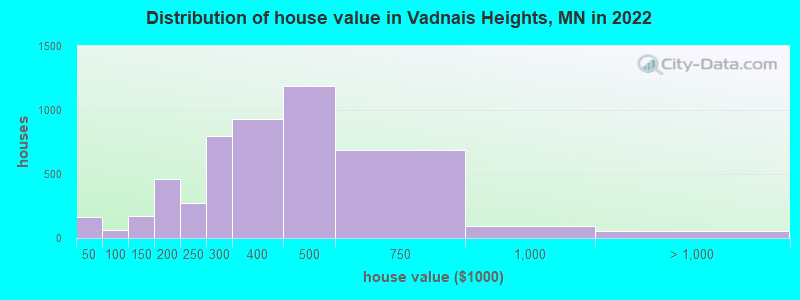
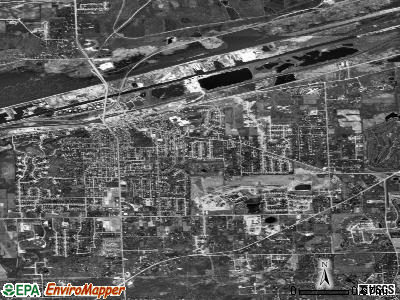
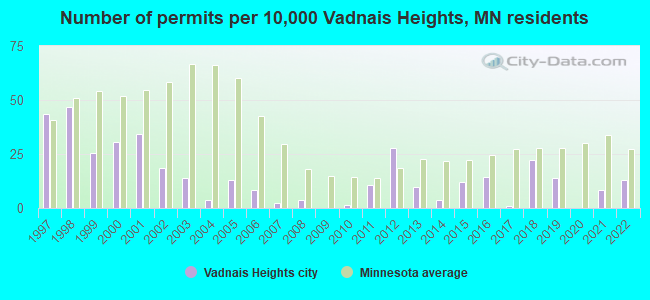
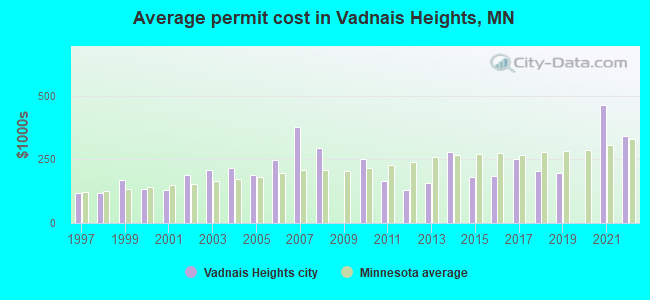
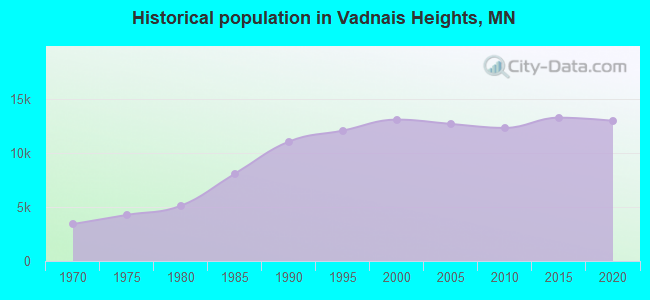
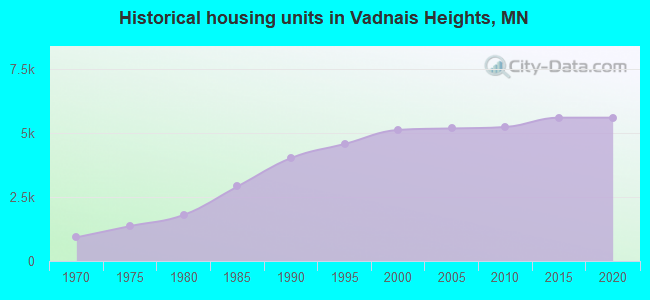
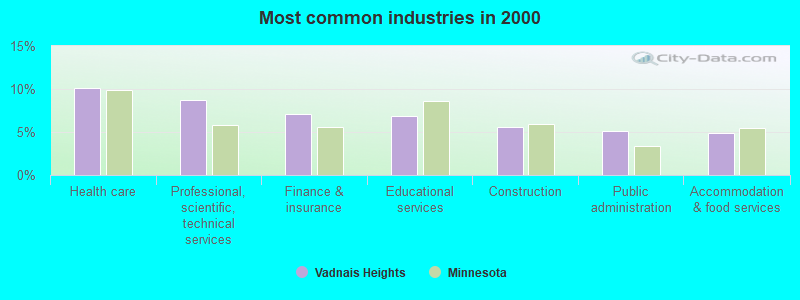
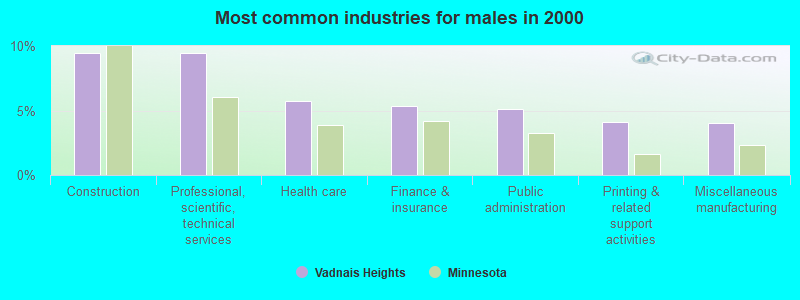
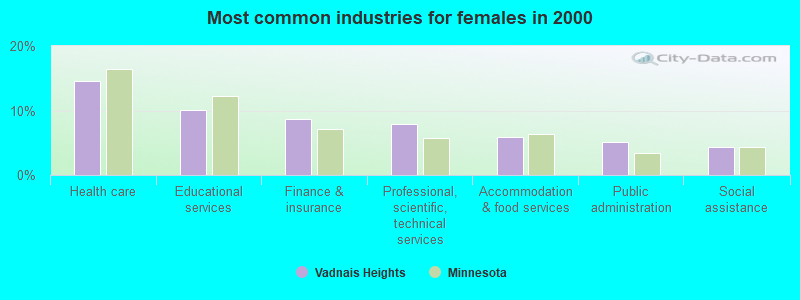
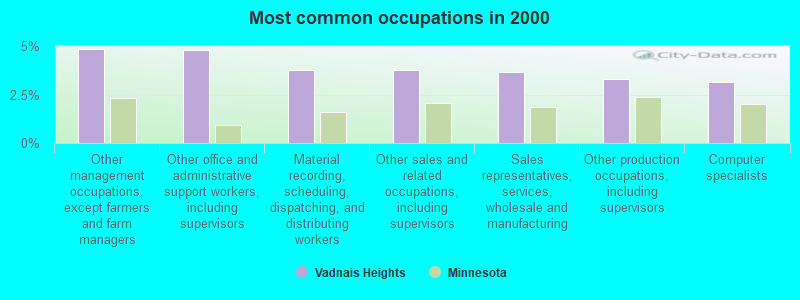
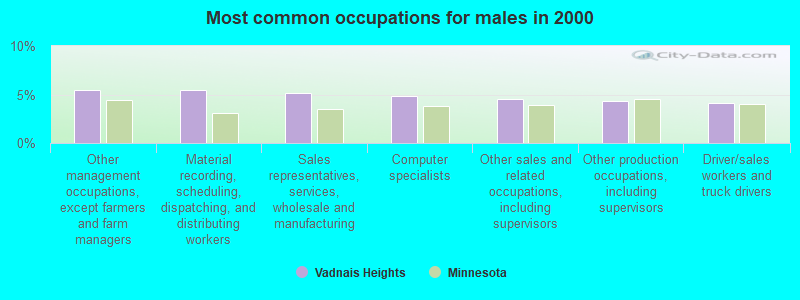
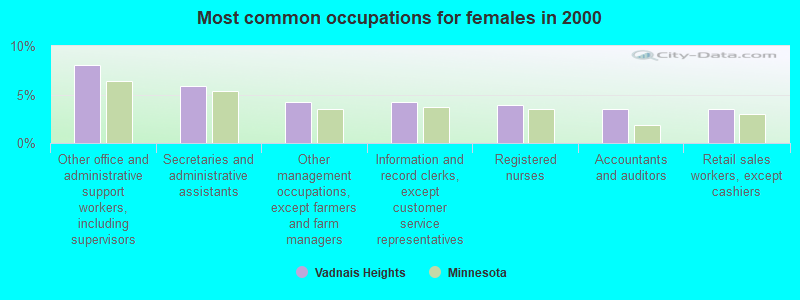
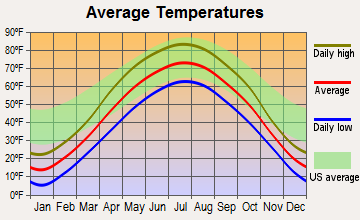
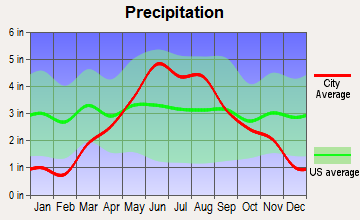
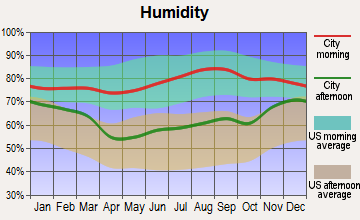
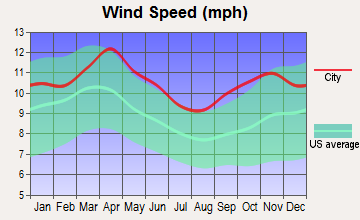
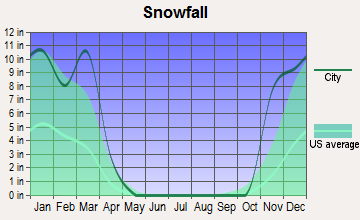
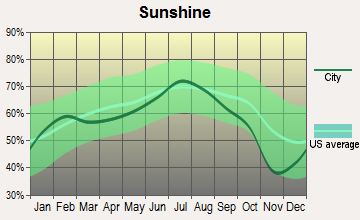
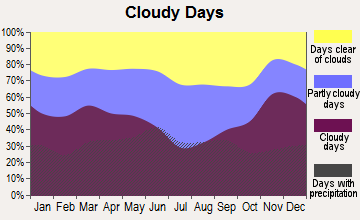
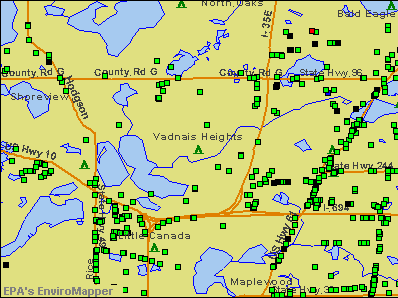

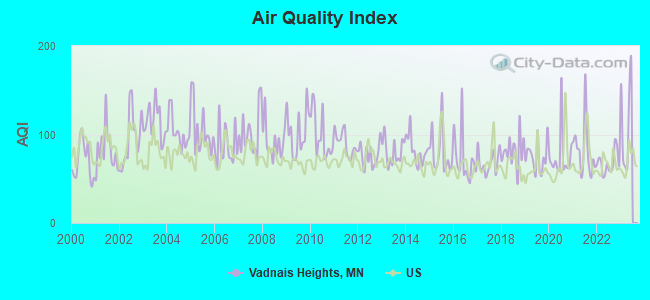
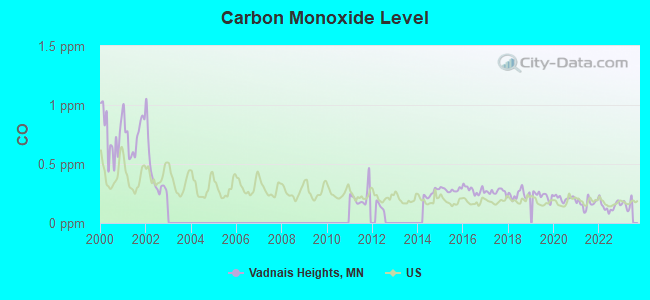
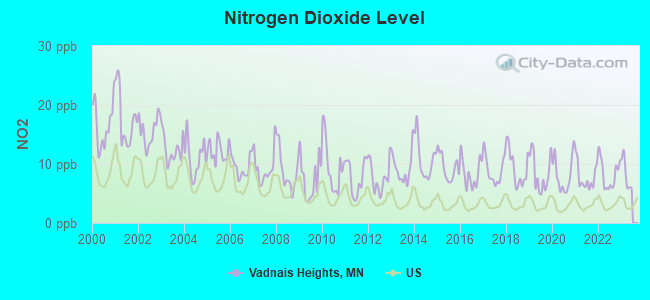
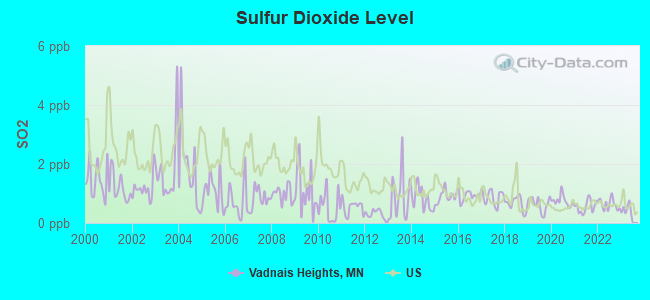
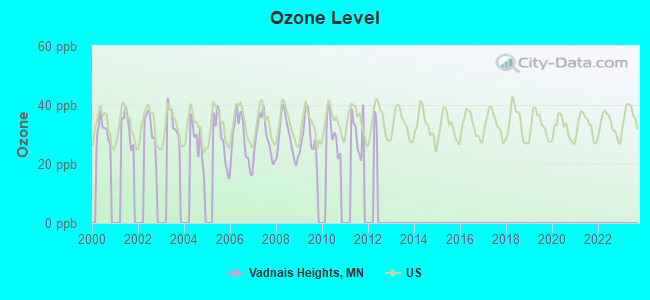
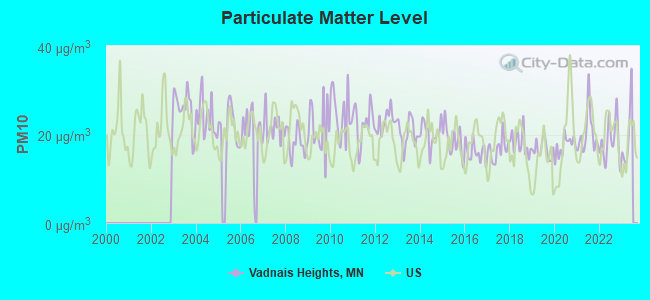
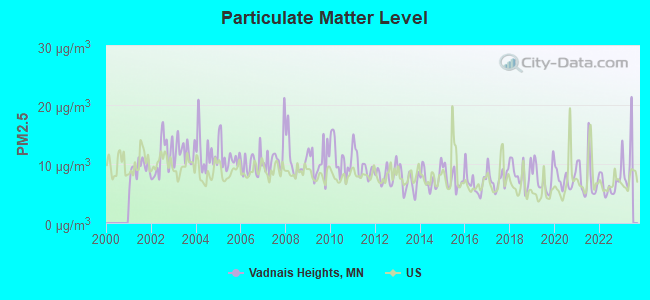
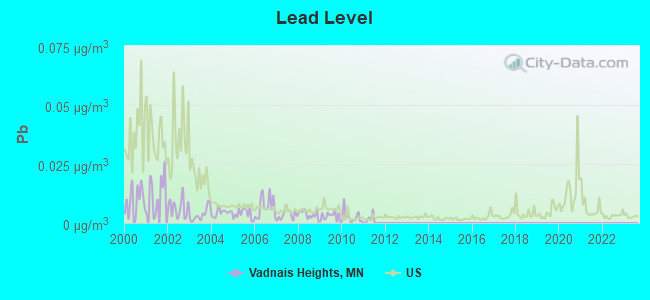
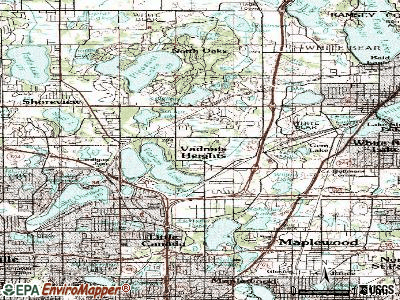
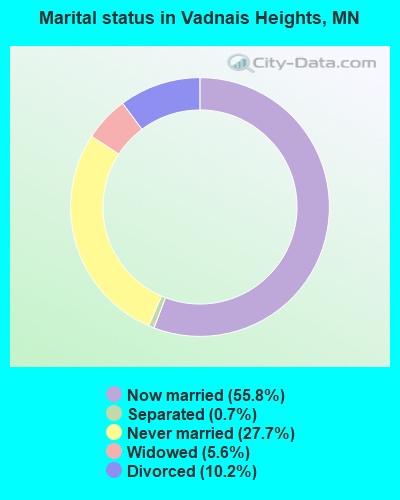
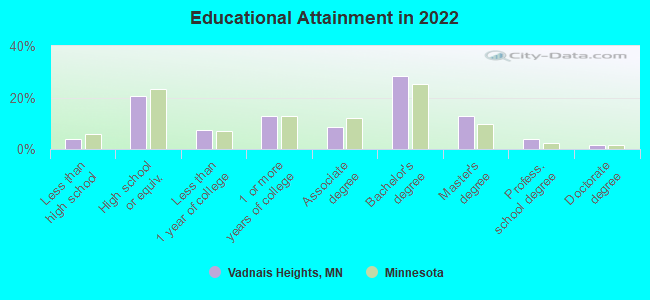
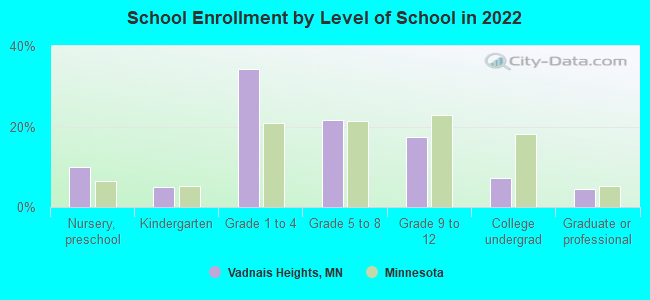
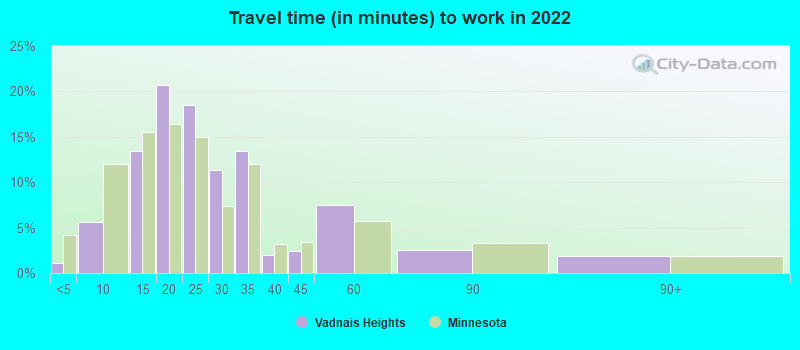
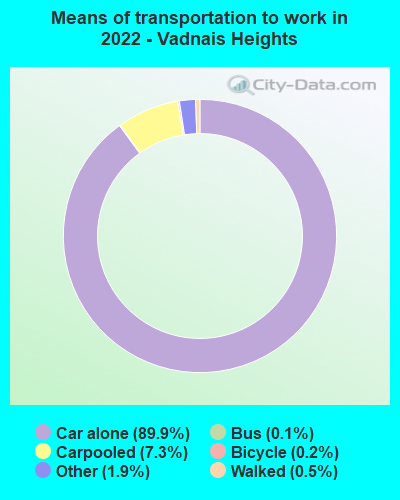
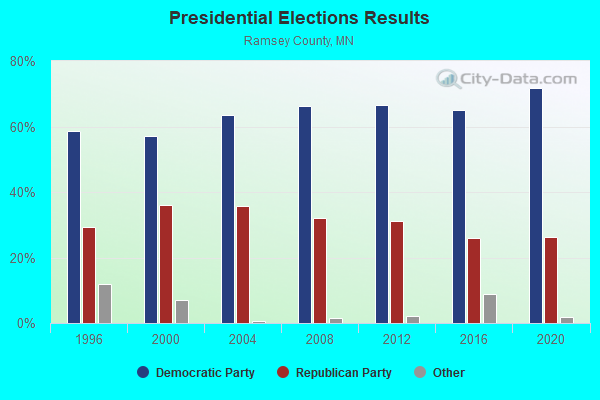
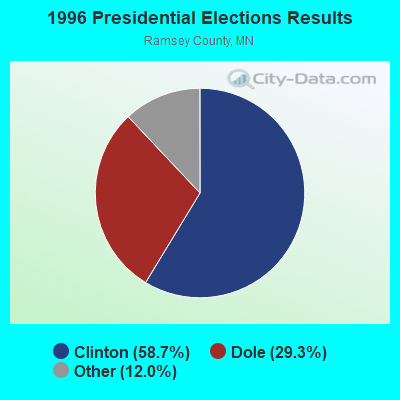
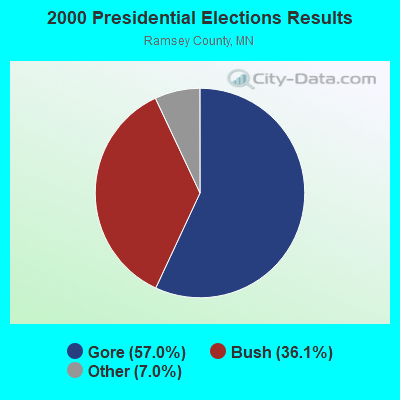
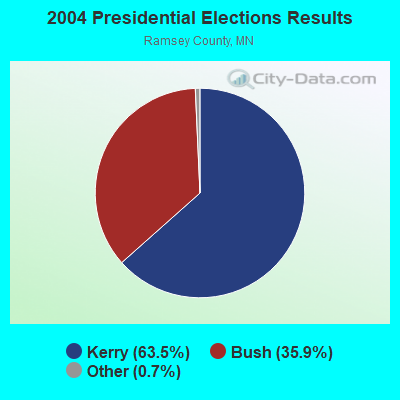
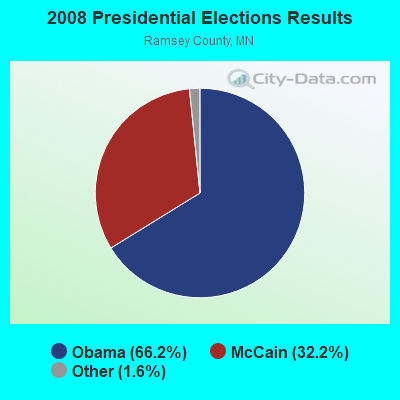
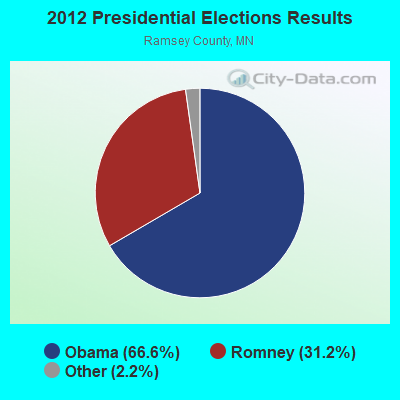
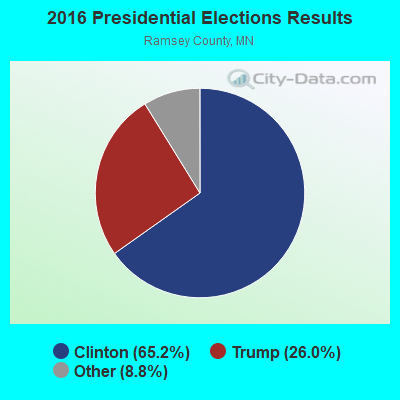
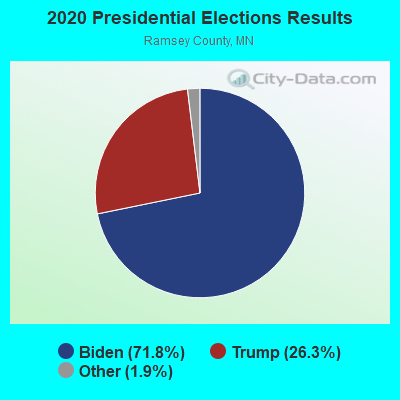
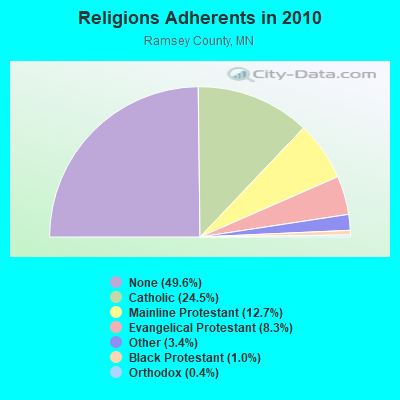
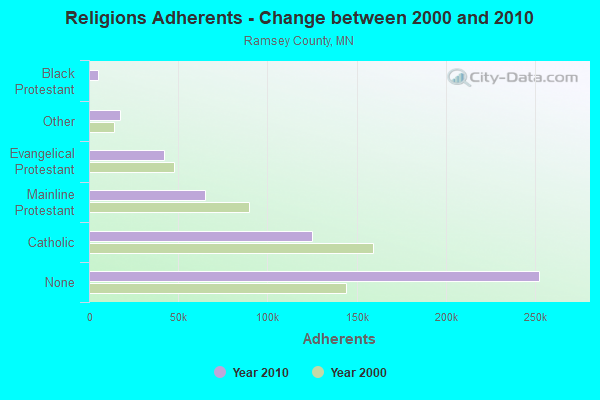
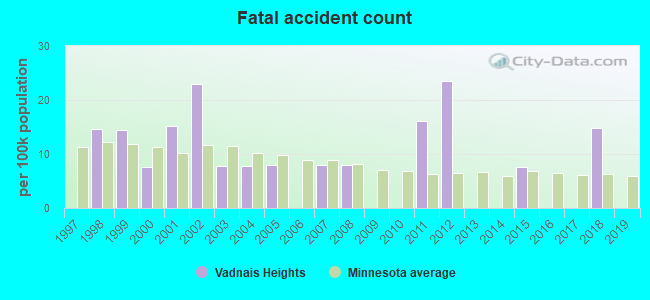
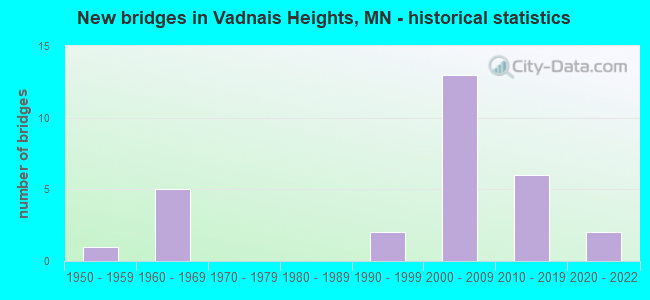
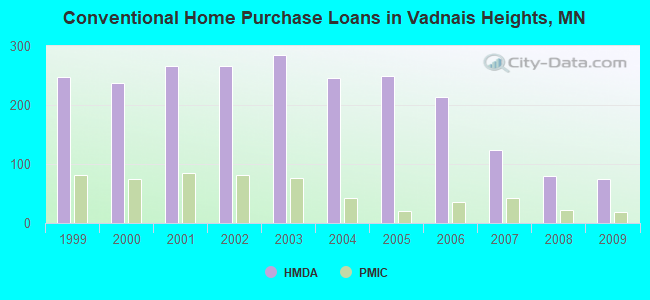
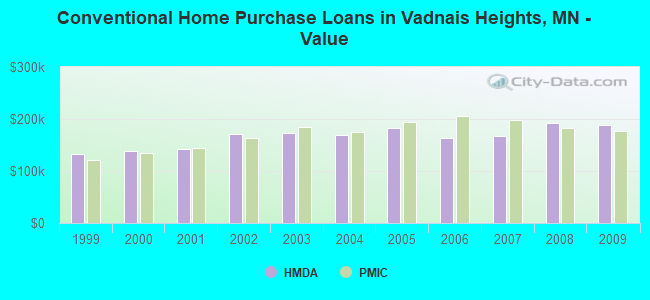
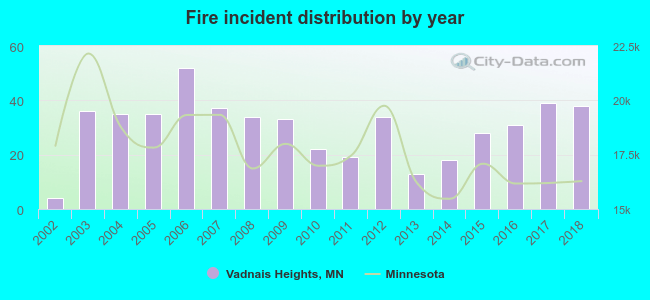 Based on the data from the years 2002 - 2018 the average number of fires per year is 30. The highest number of reported fire incidents - 52 took place in 2006, and the least - 4 in 2002. The data has a growing trend.
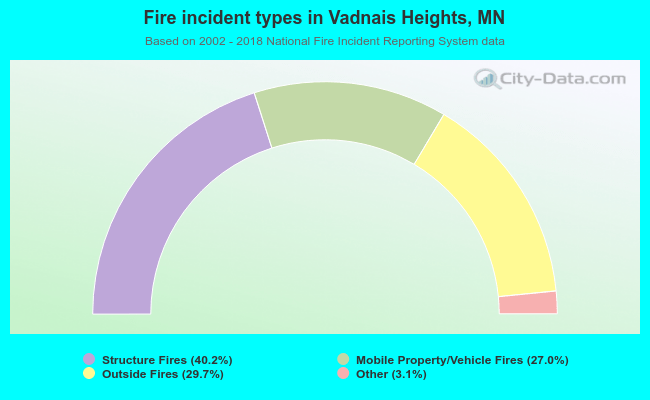 When looking into fire subcategories, the most incidents belonged to: Structure Fires (40.2%), and Outside Fires (29.7%).