Crime rate in Atlanta, Georgia (GA): murders, rapes, robberies, assaults, burglaries, thefts, auto thefts, arson, law enforcement employees, police officers, crime map
Crime rate in Atlanta, GA
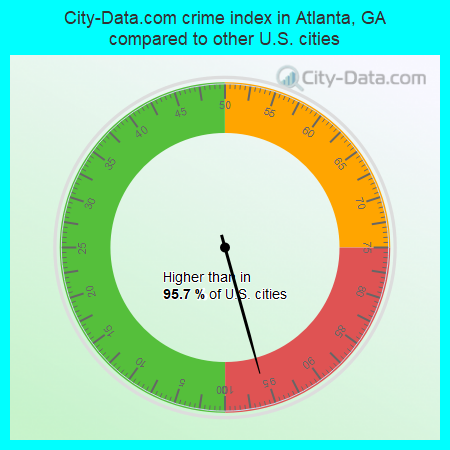
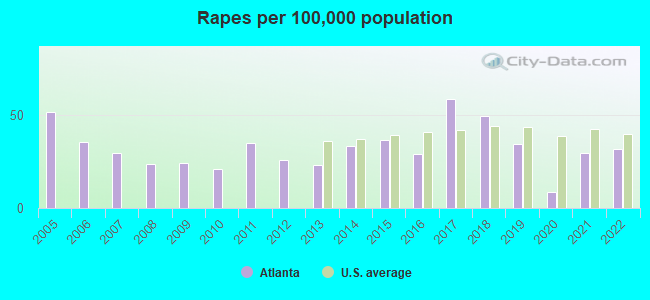
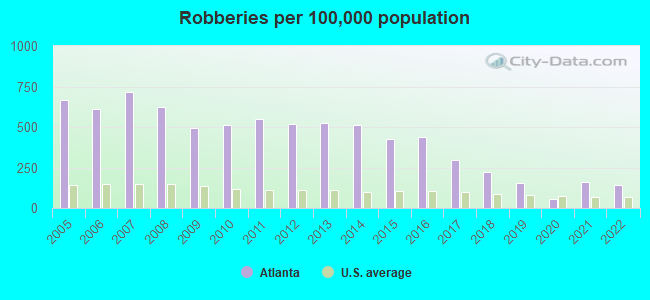
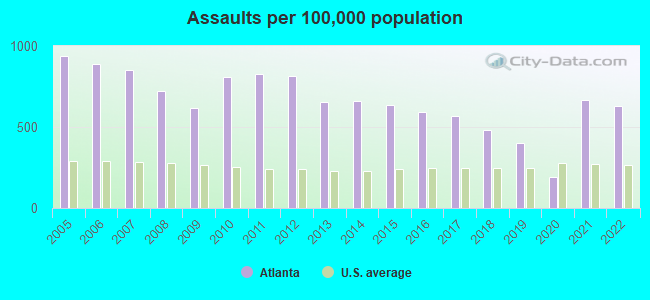
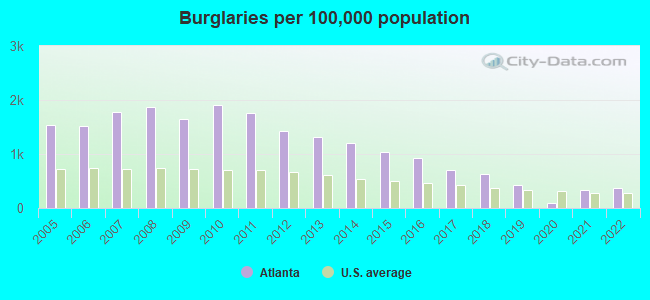
The 2022 crime rate in Atlanta, GA is 450 (City-Data.com crime index), which is 1.8 times greater than the U.S. average. It was higher than in 95.7% U.S. cities. The 2022 Atlanta crime rate rose by 1% compared to 2021. The number of homicides stood at 168 - an increase of 9 compared to 2021. In the last 5 years Atlanta has seen increasing violent crime and decline of property crime.See how dangerous Atlanta, GA is compared to the nearest cities:
(Note: Higher means more crime)
(Note: Higher means more crime)
| Atlanta: | 450.2 |
| Decatur: | 178.7 |
| East Point: | 114.2 |
| Hapeville: | 8.9 |
| Avondale Estates: | 98.1 |
| College Park: | 921.8 |
| Forest Park: | 509.5 |
| Clarkston: | 283.1 |
| Smyrna: | 196.4 |
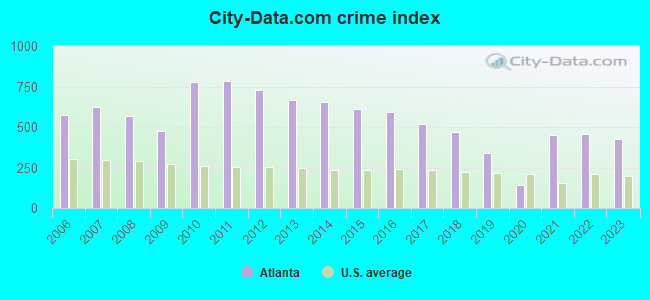
The City-Data.com crime index weighs serious crimes and violent crimes more heavily. Higher means more crime, U.S. average is 246.1. It adjusts for the number of visitors and daily workers commuting into cities.
- means the value is smaller than the state average.- means the value is about the same as the state average.
- means the value is bigger than the state average.
- means the value is much bigger than the state average.
According to our research of Georgia and other state lists, there were 1,960 registered sex offenders living in Atlanta, Georgia as of April 28, 2024.
The ratio of all residents to sex offenders in Atlanta is 241 to 1.
Violent crime rate in 2022
| Atlanta: | 487.0 |
| U.S. Average: | 219.8 |
Violent crime rate in 2021
| Atlanta: | 504.0 |
| U.S. Average: | 224.8 |
Violent crime rate in 2020
| Atlanta: | 152.5 |
| U.S. Average: | 228.2 |
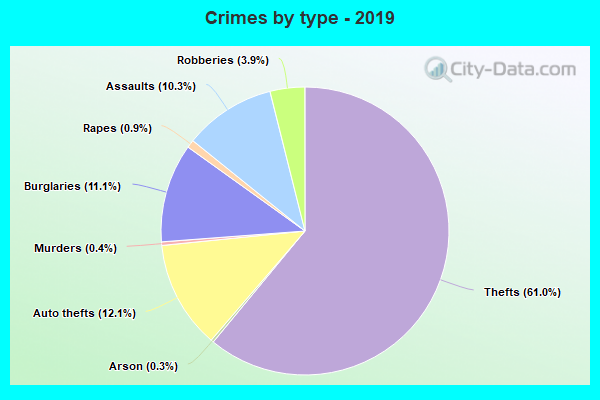
Violent crime rate in 2019
| Atlanta: | 337.7 |
| U.S. Average: | 219.9 |
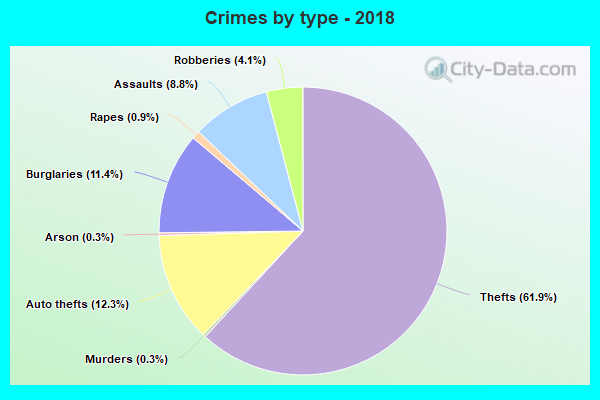
Violent crime rate in 2018
| Atlanta: | 435.7 |
| U.S. Average: | 221.2 |
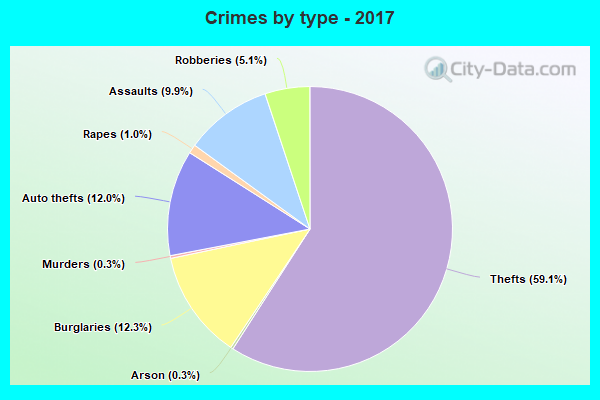
Violent crime rate in 2017
| Atlanta: | 521.8 |
| U.S. Average: | 226.2 |
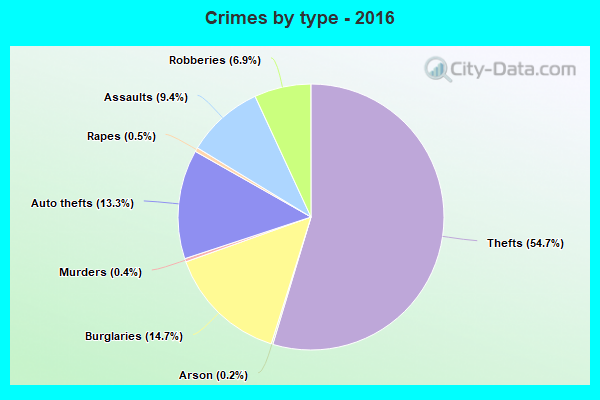
Violent crime rate in 2016
| Atlanta: | 591.4 |
| U.S. Average: | 227.3 |
Violent crime rate in 2015
| Atlanta: | 608.4 |
| U.S. Average: | 219.3 |
Violent crime rate in 2014
| Atlanta: | 661.0 |
| U.S. Average: | 211.1 |
Violent crime rate in 2013
| Atlanta: | 650.7 |
| U.S. Average: | 214.2 |
Violent crime rate in 2012
| Atlanta: | 730.9 |
| U.S. Average: | 187.4 |
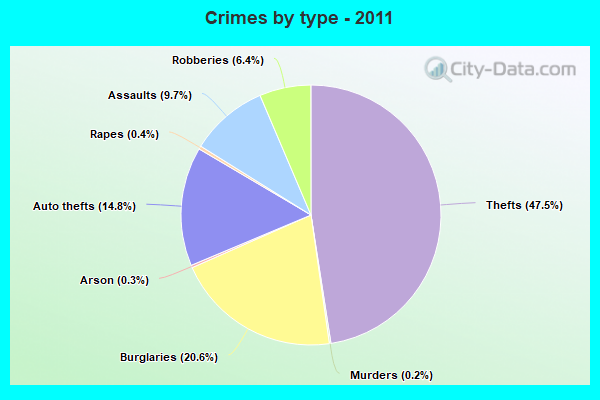
Violent crime rate in 2011
| Atlanta: | 764.8 |
| U.S. Average: | 187.1 |
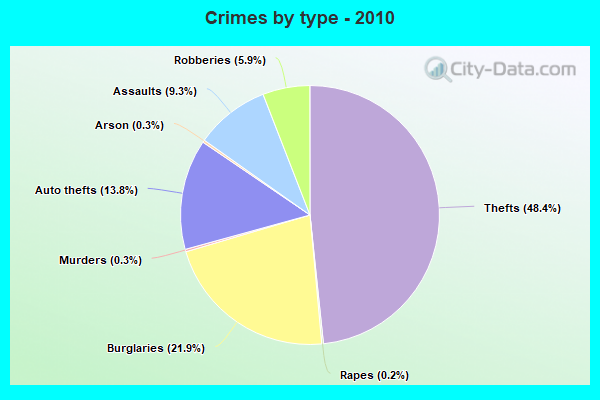
Violent crime rate in 2010
| Atlanta: | 728.2 |
| U.S. Average: | 195.7 |
Violent crime rate in 2009
| Atlanta: | 609.0 |
| U.S. Average: | 208.9 |
Violent crime rate in 2008
| Atlanta: | 735.8 |
| U.S. Average: | 222.5 |
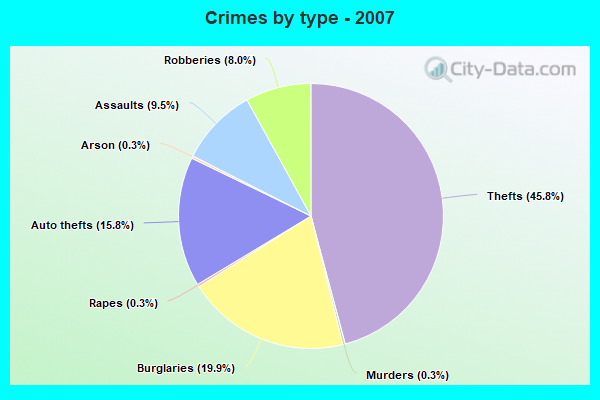
Violent crime rate in 2007
| Atlanta: | 623.2 |
| U.S. Average: | 229.1 |
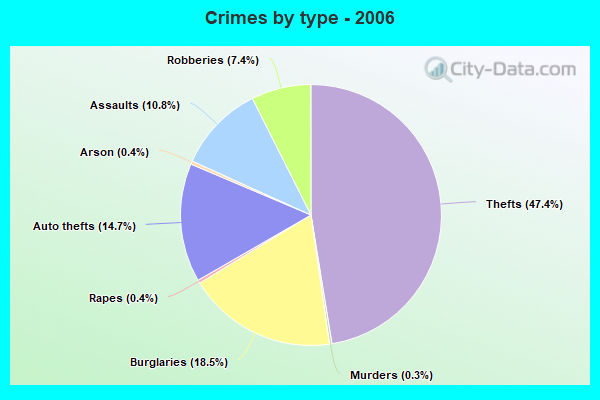
Violent crime rate in 2006
| Atlanta: | 596.4 |
| U.S. Average: | 232.6 |
Violent crime rate in 2005
| Atlanta: | 644.1 |
| U.S. Average: | 227.0 |
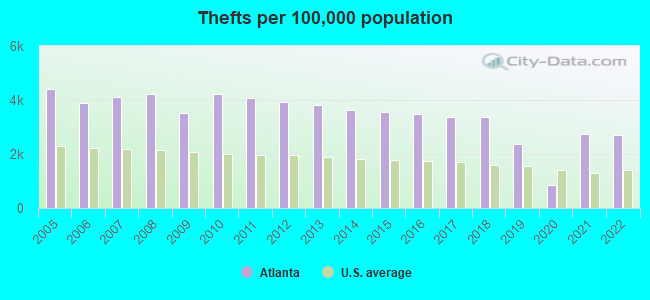
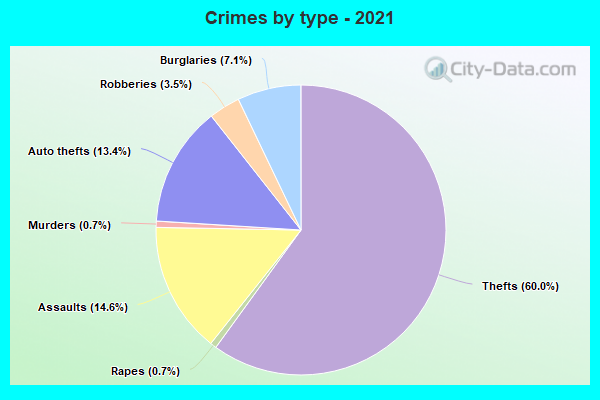
Property crime rate in 2022
| Atlanta: | 309.7 |
| U.S. Average: | 166.5 |
Property crime rate in 2021
| Atlanta: | 293.9 |
| U.S. Average: | 157.8 |
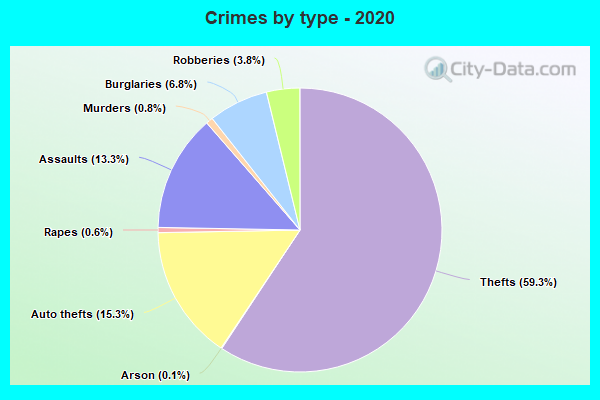
Property crime rate in 2020
| Atlanta: | 93.9 |
| U.S. Average: | 169.6 |
Property crime rate in 2019
| Atlanta: | 273.8 |
| U.S. Average: | 179.7 |
Property crime rate in 2018
| Atlanta: | 392.6 |
| U.S. Average: | 190.2 |
Property crime rate in 2017
| Atlanta: | 413.0 |
| U.S. Average: | 206.4 |
Property crime rate in 2016
| Atlanta: | 486.9 |
| U.S. Average: | 216.6 |
Property crime rate in 2015
| Atlanta: | 521.4 |
| U.S. Average: | 221.5 |
Property crime rate in 2014
| Atlanta: | 559.2 |
| U.S. Average: | 230.8 |
Property crime rate in 2013
| Atlanta: | 600.9 |
| U.S. Average: | 250.4 |
Property crime rate in 2012
| Atlanta: | 657.0 |
| U.S. Average: | 267.3 |
Property crime rate in 2011
| Atlanta: | 744.7 |
| U.S. Average: | 273.5 |
Property crime rate in 2010
| Atlanta: | 773.0 |
| U.S. Average: | 276.4 |
Property crime rate in 2009
| Atlanta: | 661.4 |
| U.S. Average: | 285.6 |
Property crime rate in 2008
| Atlanta: | 768.5 |
| U.S. Average: | 302.2 |
Property crime rate in 2007
| Atlanta: | 556.3 |
| U.S. Average: | 309.2 |
Property crime rate in 2006
| Atlanta: | 490.4 |
| U.S. Average: | 317.3 |
Property crime rate in 2005
| Atlanta: | 525.3 |
| U.S. Average: | 322.3 |

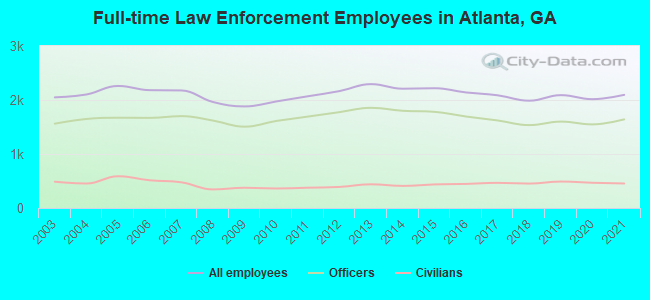
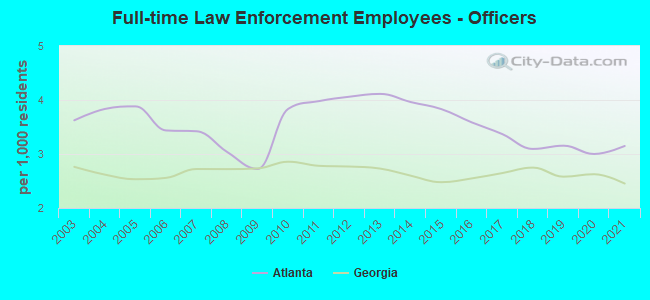
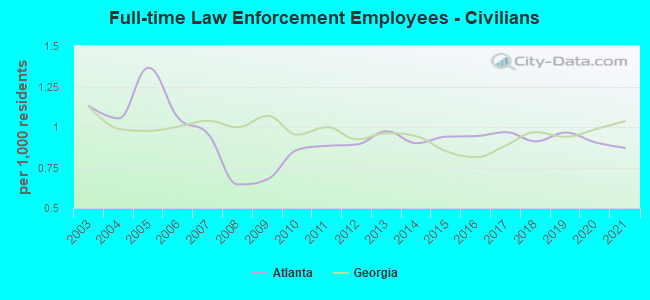
Full-time law enforcement employees in 2021, including police officers: 2,095 (1,641 officers - 1,345 male; 296 female).
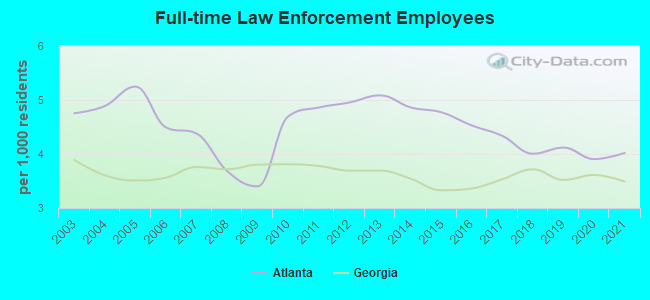
| Officers per 1,000 residents here: | 3.15 |
| Georgia average: | 2.45 |
Full-time law enforcement employees in 2020, including police officers: 2,015 (1,548 officers - 1,278 male; 270 female).
| Officers per 1,000 residents here: | 3.00 |
| Georgia average: | 2.63 |
Full-time law enforcement employees in 2019, including police officers: 2,090 (1,600 officers - 1,324 male; 276 female).
| Officers per 1,000 residents here: | 3.15 |
| Georgia average: | 2.58 |
Full-time law enforcement employees in 2018, including police officers: 1,987 (1,535 officers - 1,283 male; 252 female).
| Officers per 1,000 residents here: | 3.09 |
| Georgia average: | 2.75 |
Full-time law enforcement employees in 2017, including police officers: 2,087 (1,621 officers - 1,349 male; 272 female).
| Officers per 1,000 residents here: | 3.37 |
| Georgia average: | 2.65 |
Full-time law enforcement employees in 2016, including police officers: 2,140 (1,694 officers - 1,399 male; 295 female).
| Officers per 1,000 residents here: | 3.58 |
| Georgia average: | 2.55 |
Full-time law enforcement employees in 2015, including police officers: 2,218 (1,781 officers - 1,447 male; 334 female).
| Officers per 1,000 residents here: | 3.83 |
| Georgia average: | 2.48 |
Full-time law enforcement employees in 2014, including police officers: 2,209 (1,800 officers - 1,476 male; 324 female).
| Officers per 1,000 residents here: | 3.96 |
| Georgia average: | 2.60 |
Full-time law enforcement employees in 2013, including police officers: 2,294 (1,855 officers - 1,522 male; 333 female).
| Officers per 1,000 residents here: | 4.11 |
| Georgia average: | 2.73 |
Full-time law enforcement employees in 2012, including police officers: 2,165 (1,775 officers - 1,464 male; 311 female).
| Officers per 1,000 residents here: | 4.06 |
| Georgia average: | 2.77 |
Full-time law enforcement employees in 2011, including police officers: 2,069 (1,693 officers - 1,410 male; 283 female).
| Officers per 1,000 residents here: | 3.98 |
| Georgia average: | 2.78 |
Full-time law enforcement employees in 2010, including police officers: 1,973 (1,612 officers - 1,346 male; 266 female).
| Officers per 1,000 residents here: | 3.84 |
| Georgia average: | 2.86 |
Full-time law enforcement employees in 2009, including police officers: 1,881 (1,506 officers - 1,265 male; 241 female).
| Officers per 1,000 residents here: | 2.72 |
| Georgia average: | 2.73 |
Full-time law enforcement employees in 2008, including police officers: 1,963 (1,619 officers - 1,354 male; 265 female).
| Officers per 1,000 residents here: | 3.04 |
| Georgia average: | 2.72 |
Full-time law enforcement employees in 2007, including police officers: 2,177 (1,701 officers - 1,436 male; 265 female).
| Officers per 1,000 residents here: | 3.42 |
| Georgia average: | 2.72 |
Full-time law enforcement employees in 2006, including police officers: 2,182 (1,669 officers - 1,414 male; 255 female).
| Officers per 1,000 residents here: | 3.44 |
| Georgia average: | 2.56 |
Full-time law enforcement employees in 2005, including police officers: 2,260 (1,672 officers - 1,412 male; 260 female).
| Officers per 1,000 residents here: | 3.88 |
| Georgia average: | 2.53 |
Full-time law enforcement employees in 2004, including police officers: 2,102 (1,649 officers - 1,390 male; 259 female).
| Officers per 1,000 residents here: | 3.83 |
| Georgia average: | 2.62 |
Full-time law enforcement employees in 2003, including police officers: 2,049 (1,562 officers - 1,316 male; 246 female).
| Officers per 1,000 residents here: | 3.62 |
| Georgia average: | 2.76 |


Zip codes: 30032, 30303, 30305, 30306, 30307, 30308, 30309, 30310, 30311, 30312, 30313, 30314, 30315, 30316, 30317, 30318, 30319, 30324, 30326, 30327, 30331, 30332, 30334, 30336, 30342, 30344, 30354, 30363.