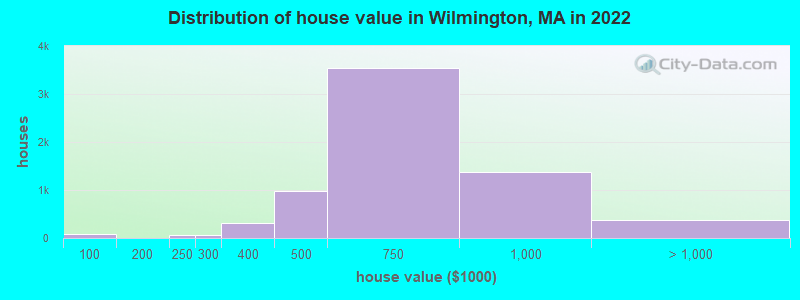
Estimated median house or condo value in 2022: $648,780 (it was $222,900 in 2000)
Wilmington:
$648,780
MA:
$534,700
Mean prices in 2022:all housing units: $678,041; detached houses: $679,552; townhouses or other attached units: $469,165; in 2-unit structures: $787,261; in 5-or-more-unit structures: $490,700
Median gross rent in 2022: $2,284.
March 2022 cost of living index in Wilmington: 134.8 (high, U.S. average is 100)
Percentage of residents living in poverty in 2022: 2.5%
(2.3% for White Non-Hispanic residents, 0.8% for Black residents, 13.1% for Hispanic or Latino residents, 4.7% for two or more races residents)
According to our research of Massachusetts and other state lists, there were 5 registered sex offenders living in Wilmington, Massachusetts as of April 27, 2024. The ratio of all residents to sex offenders in Wilmington is 4,728 to 1. The ratio of registered sex offenders to all residents in this city is much lower than the state average.
Crime rates in Wilmington by year
Type
2009
2010
2011
2012
2013
2014
2015
2016
2017
2018
2019
2020
2021
2022
Murders (per 100,000)
0 (0.0)
0 (0.0)
0 (0.0)
0 (0.0)
0 (0.0)
0 (0.0)
0 (0.0)
0 (0.0)
0 (0.0)
0 (0.0)
0 (0.0)
0 (0.0)
0 (0.0)
0 (0.0)
Rapes (per 100,000)
2 (9.1)
4 (17.9)
4 (17.8)
2 (8.8)
5 (21.6)
4 (17.1)
5 (21.2)
1 (4.2)
4 (16.8)
0 (0.0)
5 (20.9)
2 (8.5)
1 (4.2)
5 (21.9)
Robberies (per 100,000)
4 (18.2)
6 (26.9)
1 (4.5)
3 (13.2)
6 (25.9)
4 (17.1)
3 (12.7)
5 (21.1)
6 (25.2)
3 (12.5)
1 (4.2)
1 (4.3)
0 (0.0)
4 (17.5)
Assaults (per 100,000)
34 (154.3)
25 (112.0)
21 (93.5)
23 (101.1)
18 (77.6)
23 (98.2)
30 (126.9)
38 (160.6)
20 (84.1)
18 (75.0)
26 (108.7)
28 (119.5)
20 (84.9)
25 (109.5)
Burglaries (per 100,000)
76 (344.9)
105 (470.3)
77 (342.8)
58 (254.9)
65 (280.3)
37 (158.1)
31 (131.2)
27 (114.1)
26 (109.3)
16 (66.7)
15 (62.7)
16 (68.3)
15 (63.6)
19 (83.2)
Thefts (per 100,000)
206 (934.9)
213 (954.1)
218 (970.6)
213 (935.9)
182 (784.9)
204 (871.4)
140 (592.4)
138 (583.1)
141 (592.7)
100 (416.6)
125 (522.7)
125 (533.3)
129 (547.4)
164 (718.5)
Auto thefts (per 100,000)
9 (40.8)
16 (71.7)
4 (17.8)
4 (17.6)
9 (38.8)
9 (38.4)
11 (46.5)
13 (54.9)
8 (33.6)
9 (37.5)
15 (62.7)
15 (64.0)
7 (29.7)
12 (52.6)
Arson (per 100,000)
1 (4.5)
1 (4.5)
0 (0.0)
3 (13.2)
2 (8.6)
0 (0.0)
1 (4.2)
2 (8.5)
0 (0.0)
1 (4.2)
0 (0.0)
0 (0.0)
0 (0.0)
0 (0.0)
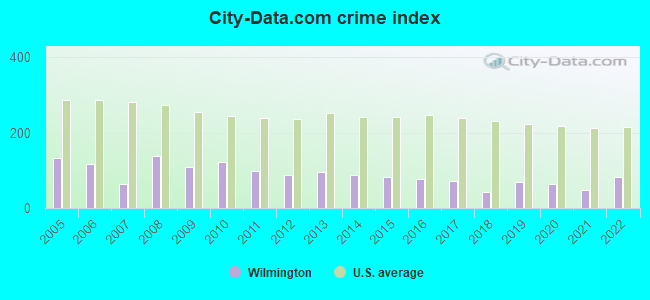
City-Data.com crime index
108.4
121.6
98.5
87.9
94.7
87.4
82.7
77.5
71.9
43.1
70.0
63.2
49.1
83.5
The City-Data.com crime index weighs serious crimes and violent crimes more heavily. Higher means more crime, U.S. average is 246.1. It adjusts for the number of visitors and daily workers commuting into cities.
Latest news from Wilmington, MA collected exclusively by city-data.com from local newspapers, TV, and radio stations
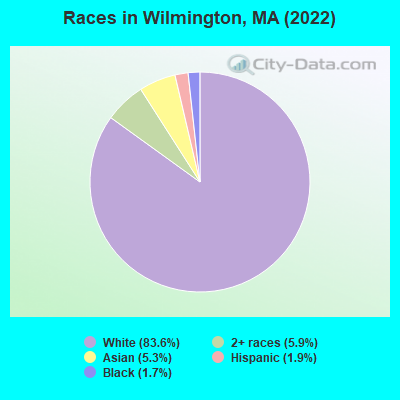
Ancestries: Irish (20.8%), Italian (15.7%), American (8.5%), English (7.5%), European (3.1%), Portuguese (3.1%).
Current Local Time: EST time zone
Incorporated in 1730
Elevation: 96 feet
Land area: 17.1 square miles.
Population density: 1,303 people per square mile (low).
1,834 residents are foreign born (3.9% Asia, 1.5% Europe, 1.1% Latin America, 0.8% North America).
This place:
7.9%
Massachusetts:
17.6%
Median real estate property taxes paid for housing units with mortgages in 2022: $6,743 (1.0%) Median real estate property taxes paid for housing units with no mortgage in 2022: $6,887 (1.1%)
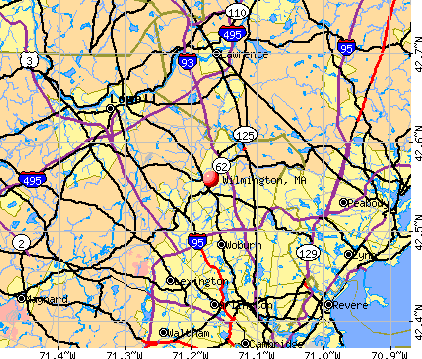
Nearest city with pop. 50,000+: Lowell, MA (9.2 miles , pop. 105,167).
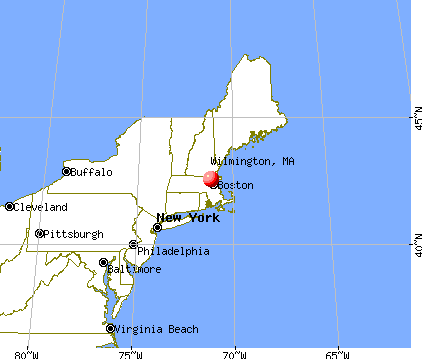
Nearest city with pop. 200,000+: Boston, MA (16.9 miles , pop. 589,141).
Nearest city with pop. 1,000,000+: Bronx, NY (183.0 miles , pop. 1,332,650).
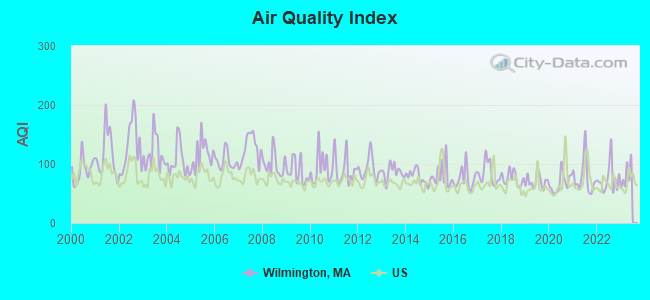
Air Quality Index (AQI) level in 2022 was 74.3. This is about average.
City:
74.3
U.S.:
72.6
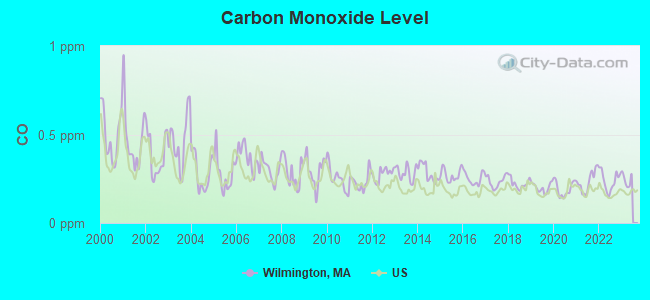
Carbon Monoxide (CO) [ppm] level in 2022 was 0.239. This is about average.Closest monitor was 4.3 miles away from the city center.
City:
0.239
U.S.:
0.251
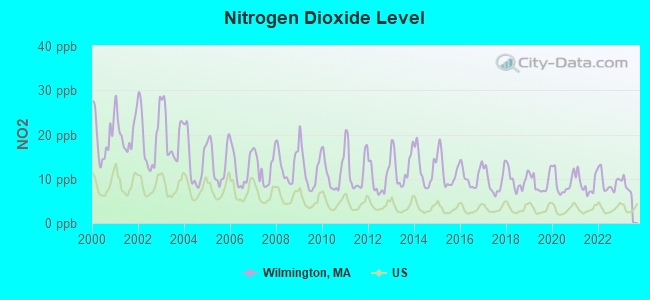
Nitrogen Dioxide (NO2) [ppb] level in 2022 was 9.18. This is significantly worse than average.Closest monitor was 5.6 miles away from the city center.
City:
9.18
U.S.:
5.11
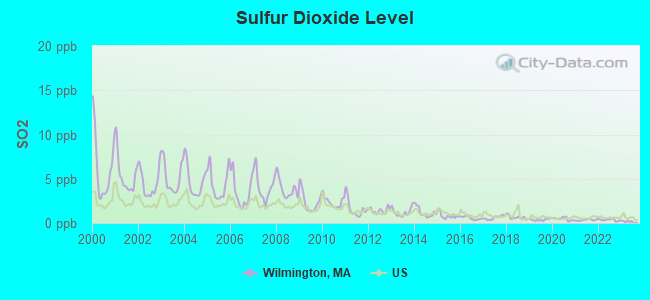
Sulfur Dioxide (SO2) [ppb] level in 2022 was 0.352. This is significantly better than average.Closest monitor was 5.4 miles away from the city center.
City:
0.352
U.S.:
1.515
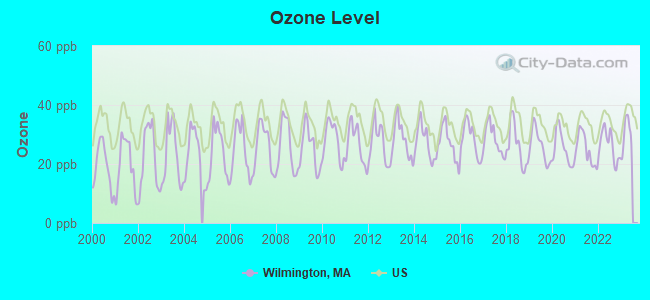
Ozone [ppb] level in 2022 was 26.3. This is better than average.Closest monitor was 4.3 miles away from the city center.
City:
26.3
U.S.:
33.3
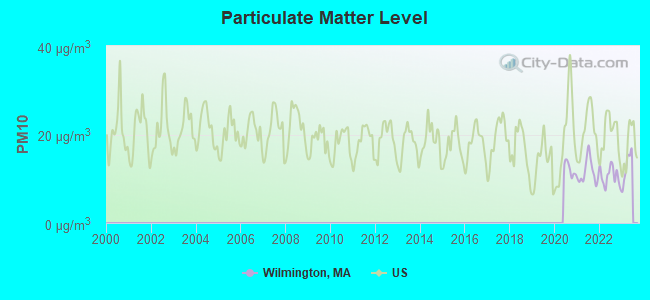
Particulate Matter (PM10) [µg/m3] level in 2022 was 10.6. This is significantly better than average.Closest monitor was 10.5 miles away from the city center.
City:
10.6
U.S.:
19.2
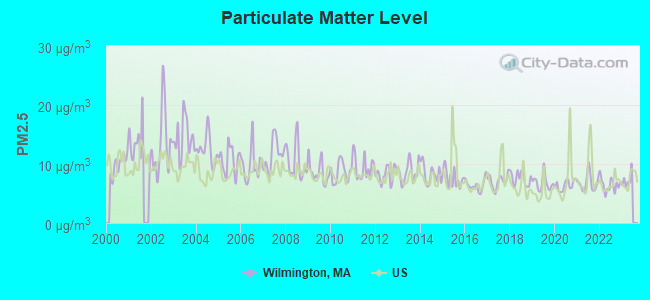
Particulate Matter (PM2.5) [µg/m3] level in 2022 was 6.48. This is better than average.Closest monitor was 7.9 miles away from the city center.
City:
6.48
U.S.:
8.11
Tornado activity:
Wilmington-area historical tornado activity is near Massachusetts state average. It is 39% smaller than the overall U.S. average.
On 6/9/1953, a category F4 (max. wind speeds 207-260 mph) tornado 25.3 miles away from the Wilmington place center killed 90 peopleand injured 1228 peopleand causedbetween $50,000,000 and $500,000,000 in damages.
On 9/29/1974, a category F3 (max. wind speeds 158-206 mph) tornado 4.2 miles away from the place center injured one personand causedbetween $50,000 and $500,000 in damages.
Earthquake activity:
Wilmington-area historical earthquake activity is significantly above Massachusetts state average. It is 73% smaller than the overall U.S. average.
On 4/20/2002 at 10:50:47, a magnitude 5.3 (5.3 ML, Depth: 3.0 mi, Class: Moderate, Intensity: VI - VII) earthquake occurred 185.2 miles away from the city center On 10/7/1983 at 10:18:46, a magnitude 5.3 (5.1 MB, 5.3 LG, 5.1 ML) earthquake occurred 186.6 miles away from Wilmington center On 1/19/1982 at 00:14:42, a magnitude 4.7 (4.5 MB, 4.7 MD, 4.5 LG, Class: Light, Intensity: IV - V) earthquake occurred 68.6 miles away from Wilmington center On 10/16/2012 at 23:12:25, a magnitude 4.7 (4.7 ML, Depth: 10.0 mi) earthquake occurred 76.4 miles away from the city center On 4/20/2002 at 10:50:47, a magnitude 5.2 (5.2 MB, 4.2 MS, 5.2 MW, 5.0 MW) earthquake occurred 184.7 miles away from the city center On 8/22/1992 at 12:20:32, a magnitude 4.8 (4.8 MB, 3.8 MS, 4.7 LG, Depth: 6.2 mi) earthquake occurred 242.9 miles away from the city center Magnitude types: regional Lg-wave magnitude (LG), body-wave magnitude (MB), duration magnitude (MD), local magnitude (ML), surface-wave magnitude (MS), moment magnitude (MW)
Natural disasters:
The number of natural disasters in Middlesex County (31) is a lot greater than the US average (15). Major Disasters (Presidential) Declared: 17 Emergencies Declared: 14
Causes of natural disasters: Floods: 12, Storms: 9, Hurricanes: 6, Snowstorms: 6, Winter Storms: 5, Blizzards: 2, Snows: 2, Explosion: 1, Heavy Rain: 1, Snowfall: 1, Water Main Break: 1, Wind: 1 (Note: some incidents may be assigned to more than one category).
Main business address for: BEACON POWER CORP (ELECTRIC SERVICES), UNIFIRST CORP (SERVICES-PERSONAL SERVICES), DUSA PHARMACEUTICALS INC (PHARMACEUTICAL PREPARATIONS), CHARLES RIVER LABORATORIES INTERNATIONAL INC (BIOLOGICAL PRODUCTS (NO DIAGNOSTIC SUBSTANCES)), MKS INSTRUMENTS INC (INDUSTRIAL INSTRUMENTS FOR MEASUREMENT, DISPLAY, AND CONTROL).
Hospitals and medical centers in Wilmington:
WILMINGTON HEALTH CARE CENTER (750 WOBURN STREET)
WILMINGTON WOODS NURSING CARE CENTER (750 WOBURN ST)
WOODBRIAR OF WILMINGTON REHABILITATION (90 WEST STREET)
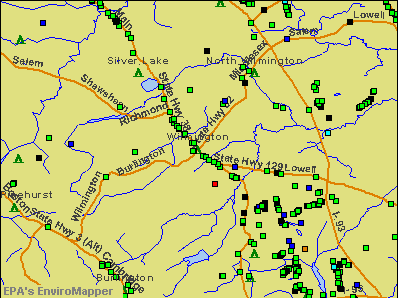
Notable locations in Wilmington: North Wilmington Station (A), Wilmington Station (B), Wilmington Junior Camp (C), Wilmington Plaza (D), East Wilmington Industrial Park (E), Southeast Wilmington Industrial Park (F), Mass EMS (G), Action Ambulance Service (H), Wilmington Fire Department (I), Wilmington Middle School Library Media Center (J), Buzzell Senior Center (K), Silver Lake Town Hall (L), Wilmington Memorial Library (M), Wilmington Chamber of Commerce (N). Display/hide their locations on the map
Main business address in Wilmington include: BEACON POWER CORP (A), UNIFIRST CORP (B), DUSA PHARMACEUTICALS INC (C), CHARLES RIVER LABORATORIES INTERNATIONAL INC (D), MKS INSTRUMENTS INC (E). Display/hide their locations on the map
Churches in Wilmington include: Full Gospel Glory Church (A), First Baptist Church of Wilmington (B), Saint Thomas of Villanova Catholic Church (C), Saint Dorothys Catholic Church (D). Display/hide their locations on the map
Hotel: Four Seasons Photography (21 Middlesex Avenue).
Birthplace of: Henry Harnden - Union Army general.
Middlesex County has a predicted average indoor radon screening level greater than 4 pCi/L (pico curies per liter) - Highest Potential
Average household size:
This place:
2.9 people
Massachusetts:
2.5 people
Percentage of family households:
This place:
79.9%
Whole state:
63.0%
Percentage of households with unmarried partners:
This place:
4.8%
Whole state:
7.0%
Likely homosexual households (counted as self-reported same-sex unmarried-partner households)
Lesbian couples: 0.5% of all households
Gay men: 0.4% of all households
People in group quarters in Wilmington in 2010:
228 people in nursing facilities/skilled-nursing facilities
17 people in group homes intended for adults
13 people in residential treatment centers for juveniles (non-correctional)
People in group quarters in Wilmington in 2000:
247 people in nursing homes
4 people in homes for the physically handicapped
3 people in homes for the mentally retarded
Banks with branches in Wilmington (2011 data):
Eastern Bank: Wilmington Branch at 370 Main Street, branch established on 1891/01/01; Wilmington Branch at 219 Lowell Street, branch established on 1974/11/01. Info updated 2011/03/30: Bank assets: $7,812.9 mil, Deposits: $6,295.8 mil, headquarters in Boston, MA, positive income, Commercial Lending Specialization, 94 total offices, Holding Company: Eastern Bank Corporation
Reading Co-operative Bank: Wilmington Branch at 352 Middlesex Avenue, branch established on 1963/12/01; Lowell Street Wilmington Branch at 230 Lowell Street, branch established on 2005/03/09. Info updated 2011/04/20: Bank assets: $347.2 mil, Deposits: $277.5 mil, headquarters in Reading, MA, positive income, Mortgage Lending Specialization, 6 total offices
People's United Bank: Main Street Branch at 275 Main Stret, branch established on 2002/01/15. Info updated 2012/02/16: Bank assets: $27,319.3 mil, Deposits: $20,835.4 mil, headquarters in Bridgeport, CT, positive income, Commercial Lending Specialization, 374 total offices
Bank of America, National Association: Wilmington Branch at 390 Main Street, branch established on 1956/05/02. Info updated 2009/11/18: Bank assets: $1,451,969.3 mil, Deposits: $1,077,176.8 mil, headquarters in Charlotte, NC, positive income, 5782 total offices, Holding Company: Bank Of America Corporation
RBS Citizens, National Association: Wilmington Branch at 240 Main Street, branch established on 1981/10/19. Info updated 2007/09/19: Bank assets: $106,940.6 mil, Deposits: $75,690.2 mil, headquarters in Providence, RI, positive income, 1135 total offices, Holding Company: Uk Financial Investments Limited
The Lowell Five Cent Savings Bank: Wilmington Branch at 270 Main Street, branch established on 1978/08/01. Info updated 2011/09/19: Bank assets: $738.4 mil, Deposits: $601.2 mil, headquarters in Lowell, MA, positive income, Mortgage Lending Specialization, 13 total offices, Holding Company: Lowell Five Bancorp Mhc
Sovereign Bank, National Association: Wilmington Plaza Branch at 280 Main Street, branch established on 1985/05/23. Info updated 2012/01/31: Bank assets: $78,146.9 mil, Deposits: $48,042.9 mil, headquarters in Wilmington, DE, positive income, Commercial Lending Specialization, 718 total offices, Holding Company: Banco Santander, S.A.
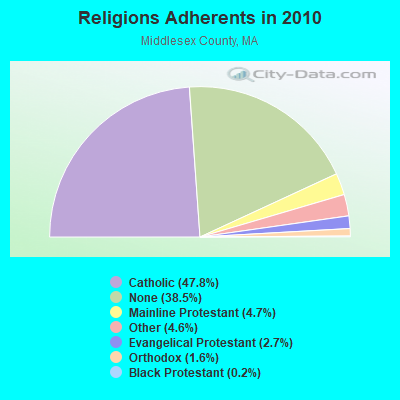
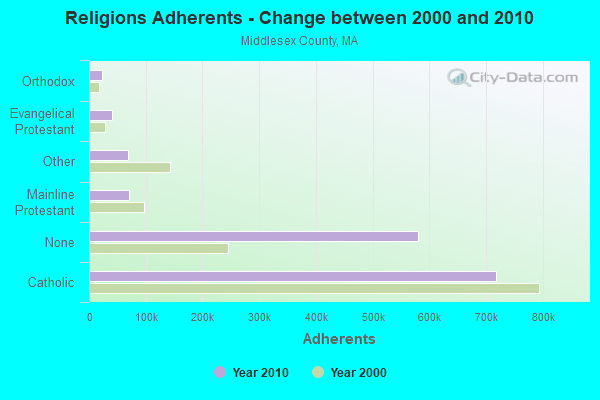
Religion statistics for Wilmington, MA (based on Middlesex County data)
Religion
Adherents
Congregations
Catholic
718,209
107
Mainline Protestant
70,053
269
Other
68,480
199
Evangelical Protestant
41,270
304
Orthodox
23,641
28
Black Protestant
2,276
8
None
579,156
-
Source: Clifford Grammich, Kirk Hadaway, Richard Houseal, Dale E.Jones, Alexei Krindatch, Richie Stanley and Richard H.Taylor. 2012. 2010 U.S.Religion Census: Religious Congregations & Membership Study. Association of Statisticians of American Religious Bodies. Jones, Dale E., et al. 2002. Congregations and Membership in the United States 2000. Nashville, TN: Glenmary Research Center. Graphs represent county-level data
Aircraft: PIPER PA-28-180 (Category: Land, Seats: 4, Weight: Up to 12,499 Pounds, Speed: 107 mph), Engine: LYCOMING O&VO-360 SER (180 HP) (Reciprocating) N-Number: 1448X, N1448X, N-1448X, Serial Number: 28-7505229, Year manufactured: 1975, Airworthiness Date: 06/05/1975, Certificate Issue Date: 01/12/1996 Registrant (Co-Owned): Robert T Mallett, 4 Jewel Dr Unit 14, Wilmington, MA 01887, Other Owners: Cheryl M Mallett
Aircraft: CESSNA 172M (Category: Land, Seats: 4, Weight: Up to 12,499 Pounds, Speed: 108 mph), Engine: LYCOMING 0-320 SERIES (180 HP) (4 Cycle) N-Number: 317AC, N317AC, N-317AC, Serial Number: 17265537, Year manufactured: 1975, Airworthiness Date: 06/30/1975, Certificate Issue Date: 05/04/1998 Registrant (Corporation): Chickenhawk Inc, 20 Auburn Ave, Wilmington, MA 01887
Aircraft: PIPER PA-23 (Category: Land, Engines: 2, Seats: 5, Weight: Up to 12,499 Pounds, Speed: 150 mph), Engine: LYCOMING 0-320 SERIES (180 HP) (Reciprocating) N-Number: 1198P, N1198P, N-1198P, Serial Number: 23-215, Year manufactured: 1955, Certificate Issue Date: 02/11/1969 Registrant (Individual): Robert F Maucher, 342 Chestnut St, Wilmington, MA 01887 Deregistered:Cancel Date: 09/06/2019
Aircraft: CESSNA 180 (Category: Land, Seats: 4, Weight: Up to 12,499 Pounds, Speed: 121 mph), Engine: CONT MOTOR O-470 SERIES (230 HP) (Reciprocating) N-Number: 2960C, N2960C, N-2960C, Serial Number: 30860, Year manufactured: 1954 Registrant (Individual): Joseph R Russell, 164 Main St, Wilmington, MA 01887 Deregistered:Cancel Date: 04/10/2018
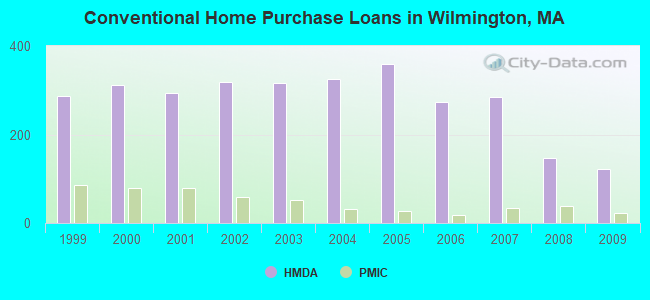
Home Mortgage Disclosure Act Aggregated Statistics For Year 2009 (Based on 4 full tracts)
A) FHA, FSA/RHS & VA Home Purchase Loans
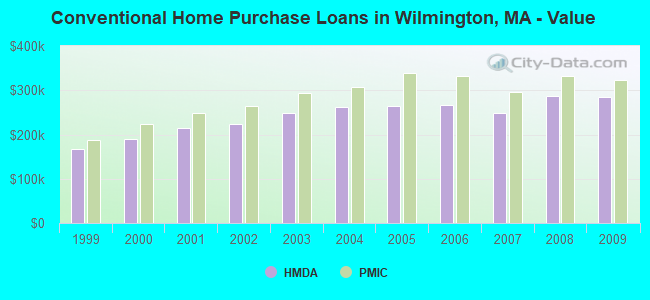
B) Conventional Home Purchase Loans
C) Refinancings
D) Home Improvement Loans
F) Non-occupant Loans on < 5 Family Dwellings (A B C & D)
Number
Average Value
Number
Average Value
Number
Average Value
Number
Average Value
Number
Average Value
LOANS ORIGINATED
60
$315,033
123
$285,179
1,045
$254,585
36
$170,667
7
$284,429
APPLICATIONS APPROVED, NOT ACCEPTED
2
$279,500
7
$309,429
63
$252,937
7
$47,571
0
$0
APPLICATIONS DENIED
10
$301,600
25
$297,400
162
$283,401
19
$141,158
2
$338,000
APPLICATIONS WITHDRAWN
4
$248,000
16
$315,062
154
$276,182
4
$51,000
2
$168,000
FILES CLOSED FOR INCOMPLETENESS
1
$286,000
2
$220,000
33
$261,848
2
$140,000
2
$193,000
Aggregated Statistics For Year 2008 (Based on 4 full tracts)
A) FHA, FSA/RHS & VA Home Purchase Loans
B) Conventional Home Purchase Loans
C) Refinancings
D) Home Improvement Loans
E) Loans on Dwellings For 5+ Families
F) Non-occupant Loans on < 5 Family Dwellings (A B C & D)
Number
Average Value
Number
Average Value
Number
Average Value
Number
Average Value
Number
Average Value
Number
Average Value
LOANS ORIGINATED
34
$309,147
147
$287,544
396
$267,836
55
$99,327
0
$0
28
$265,821
APPLICATIONS APPROVED, NOT ACCEPTED
2
$297,000
20
$238,300
60
$269,667
10
$83,700
0
$0
8
$260,625
APPLICATIONS DENIED
6
$255,167
12
$256,667
125
$282,056
28
$83,964
1
$180,000
3
$324,667
APPLICATIONS WITHDRAWN
4
$295,500
20
$249,100
54
$270,037
10
$156,400
0
$0
2
$152,500
FILES CLOSED FOR INCOMPLETENESS
1
$307,000
6
$281,167
21
$295,238
1
$35,000
0
$0
0
$0
Aggregated Statistics For Year 2007 (Based on 4 full tracts)
A) FHA, FSA/RHS & VA Home Purchase Loans
B) Conventional Home Purchase Loans
C) Refinancings
D) Home Improvement Loans
F) Non-occupant Loans on < 5 Family Dwellings (A B C & D)
G) Loans On Manufactured Home Dwelling (A B C & D)
Number
Average Value
Number
Average Value
Number
Average Value
Number
Average Value
Number
Average Value
Number
Average Value
LOANS ORIGINATED
5
$301,800
285
$248,200
450
$235,644
98
$99,378
12
$216,167
0
$0
APPLICATIONS APPROVED, NOT ACCEPTED
0
$0
30
$243,000
90
$219,611
16
$47,812
3
$154,667
0
$0
APPLICATIONS DENIED
1
$305,000
36
$264,000
209
$271,780
56
$95,286
7
$305,429
2
$125,000
APPLICATIONS WITHDRAWN
2
$283,500
41
$200,171
121
$273,570
13
$102,154
6
$270,667
0
$0
FILES CLOSED FOR INCOMPLETENESS
0
$0
5
$192,200
45
$309,778
3
$268,333
2
$348,000
0
$0
Aggregated Statistics For Year 2006 (Based on 4 full tracts)
A) FHA, FSA/RHS & VA Home Purchase Loans
B) Conventional Home Purchase Loans
C) Refinancings
D) Home Improvement Loans
E) Loans on Dwellings For 5+ Families
F) Non-occupant Loans on < 5 Family Dwellings (A B C & D)
G) Loans On Manufactured Home Dwelling (A B C & D)
Number
Average Value
Number
Average Value
Number
Average Value
Number
Average Value
Number
Average Value
Number
Average Value
Number
Average Value
LOANS ORIGINATED
2
$332,500
274
$266,558
598
$222,373
133
$107,534
1
$308,000
17
$223,824
1
$16,000
APPLICATIONS APPROVED, NOT ACCEPTED
0
$0
30
$280,900
74
$247,392
12
$80,250
0
$0
2
$303,000
0
$0
APPLICATIONS DENIED
1
$333,000
32
$259,781
232
$255,509
48
$99,417
0
$0
3
$121,667
1
$50,000
APPLICATIONS WITHDRAWN
0
$0
24
$245,292
201
$277,085
10
$157,000
0
$0
3
$242,333
0
$0
FILES CLOSED FOR INCOMPLETENESS
0
$0
4
$263,750
43
$221,140
3
$37,333
0
$0
3
$226,333
0
$0
Aggregated Statistics For Year 2005 (Based on 4 full tracts)
A) FHA, FSA/RHS & VA Home Purchase Loans
B) Conventional Home Purchase Loans
C) Refinancings
D) Home Improvement Loans
F) Non-occupant Loans on < 5 Family Dwellings (A B C & D)
G) Loans On Manufactured Home Dwelling (A B C & D)
Number
Average Value
Number
Average Value
Number
Average Value
Number
Average Value
Number
Average Value
Number
Average Value
LOANS ORIGINATED
1
$318,000
360
$264,053
746
$241,462
125
$115,272
28
$238,571
2
$93,500
APPLICATIONS APPROVED, NOT ACCEPTED
0
$0
35
$284,457
91
$237,582
15
$104,800
1
$175,000
0
$0
APPLICATIONS DENIED
1
$325,000
38
$221,658
201
$270,085
55
$110,164
9
$214,333
0
$0
APPLICATIONS WITHDRAWN
0
$0
62
$254,274
292
$269,130
20
$206,150
14
$449,929
0
$0
FILES CLOSED FOR INCOMPLETENESS
0
$0
9
$267,778
36
$270,000
2
$60,000
0
$0
0
$0
Aggregated Statistics For Year 2004 (Based on 4 full tracts)
A) FHA, FSA/RHS & VA Home Purchase Loans
B) Conventional Home Purchase Loans
C) Refinancings
D) Home Improvement Loans
E) Loans on Dwellings For 5+ Families
F) Non-occupant Loans on < 5 Family Dwellings (A B C & D)
G) Loans On Manufactured Home Dwelling (A B C & D)
Number
Average Value
Number
Average Value
Number
Average Value
Number
Average Value
Number
Average Value
Number
Average Value
Number
Average Value
LOANS ORIGINATED
8
$238,250
326
$262,347
842
$222,391
129
$117,736
0
$0
18
$211,944
1
$302,000
APPLICATIONS APPROVED, NOT ACCEPTED
0
$0
27
$248,407
96
$209,344
22
$109,273
0
$0
5
$230,400
1
$22,000
APPLICATIONS DENIED
1
$245,000
24
$281,792
205
$234,449
60
$68,350
1
$333,000
7
$217,286
0
$0
APPLICATIONS WITHDRAWN
0
$0
41
$279,512
274
$224,474
14
$87,857
0
$0
4
$197,500
2
$280,000
FILES CLOSED FOR INCOMPLETENESS
0
$0
7
$277,000
45
$227,467
5
$55,400
0
$0
2
$224,500
0
$0
Aggregated Statistics For Year 2003 (Based on 4 full tracts)
A) FHA, FSA/RHS & VA Home Purchase Loans
B) Conventional Home Purchase Loans
C) Refinancings
D) Home Improvement Loans
F) Non-occupant Loans on < 5 Family Dwellings (A B C & D)
Number
Average Value
Number
Average Value
Number
Average Value
Number
Average Value
Number
Average Value
LOANS ORIGINATED
10
$243,500
316
$249,614
2,315
$194,753
67
$83,925
28
$208,786
APPLICATIONS APPROVED, NOT ACCEPTED
0
$0
36
$245,000
225
$186,924
19
$29,211
2
$166,000
APPLICATIONS DENIED
1
$259,000
21
$243,429
291
$213,058
32
$56,375
7
$258,143
APPLICATIONS WITHDRAWN
0
$0
24
$252,458
331
$198,323
20
$53,500
2
$152,000
FILES CLOSED FOR INCOMPLETENESS
0
$0
4
$374,500
39
$211,667
1
$25,000
1
$326,000
Aggregated Statistics For Year 2002 (Based on 4 full tracts)
A) FHA, FSA/RHS & VA Home Purchase Loans
B) Conventional Home Purchase Loans
C) Refinancings
D) Home Improvement Loans
F) Non-occupant Loans on < 5 Family Dwellings (A B C & D)
Number
Average Value
Number
Average Value
Number
Average Value
Number
Average Value
Number
Average Value
LOANS ORIGINATED
9
$205,778
319
$222,987
1,629
$183,215
101
$51,426
30
$178,667
APPLICATIONS APPROVED, NOT ACCEPTED
0
$0
33
$214,606
158
$161,892
22
$47,455
0
$0
APPLICATIONS DENIED
0
$0
17
$224,000
151
$170,861
50
$53,500
5
$129,000
APPLICATIONS WITHDRAWN
0
$0
28
$246,714
210
$178,186
16
$82,375
6
$221,333
FILES CLOSED FOR INCOMPLETENESS
0
$0
3
$262,333
33
$171,606
0
$0
2
$150,500
Aggregated Statistics For Year 2001 (Based on 4 full tracts)
A) FHA, FSA/RHS & VA Home Purchase Loans
B) Conventional Home Purchase Loans
C) Refinancings
D) Home Improvement Loans
E) Loans on Dwellings For 5+ Families
F) Non-occupant Loans on < 5 Family Dwellings (A B C & D)
Number
Average Value
Number
Average Value
Number
Average Value
Number
Average Value
Number
Average Value
Number
Average Value
LOANS ORIGINATED
12
$191,750
293
$215,205
1,339
$176,427
105
$42,876
0
$0
17
$172,059
APPLICATIONS APPROVED, NOT ACCEPTED
0
$0
32
$203,000
113
$145,425
31
$49,903
0
$0
3
$170,000
APPLICATIONS DENIED
1
$169,000
25
$266,040
121
$136,298
31
$33,000
0
$0
1
$130,000
APPLICATIONS WITHDRAWN
3
$144,667
16
$229,562
202
$166,718
24
$42,333
1
$600,000
2
$165,000
FILES CLOSED FOR INCOMPLETENESS
0
$0
3
$260,000
25
$203,560
4
$67,750
0
$0
0
$0
Aggregated Statistics For Year 2000 (Based on 4 full tracts)
A) FHA, FSA/RHS & VA Home Purchase Loans
B) Conventional Home Purchase Loans
C) Refinancings
D) Home Improvement Loans
E) Loans on Dwellings For 5+ Families
F) Non-occupant Loans on < 5 Family Dwellings (A B C & D)
Number
Average Value
Number
Average Value
Number
Average Value
Number
Average Value
Number
Average Value
Number
Average Value
LOANS ORIGINATED
17
$179,941
312
$190,106
286
$127,657
96
$33,604
0
$0
10
$138,500
APPLICATIONS APPROVED, NOT ACCEPTED
3
$95,000
34
$187,412
53
$126,170
29
$40,690
0
$0
1
$96,000
APPLICATIONS DENIED
1
$223,000
23
$217,391
109
$104,862
33
$31,879
0
$0
5
$109,400
APPLICATIONS WITHDRAWN
3
$130,333
27
$168,222
77
$103,104
14
$44,643
1
$200,000
1
$120,000
FILES CLOSED FOR INCOMPLETENESS
0
$0
3
$193,667
37
$129,243
2
$41,000
0
$0
1
$152,000
Aggregated Statistics For Year 1999 (Based on 4 full tracts)
A) FHA, FSA/RHS & VA Home Purchase Loans
B) Conventional Home Purchase Loans
C) Refinancings
D) Home Improvement Loans
F) Non-occupant Loans on < 5 Family Dwellings (A B C & D)
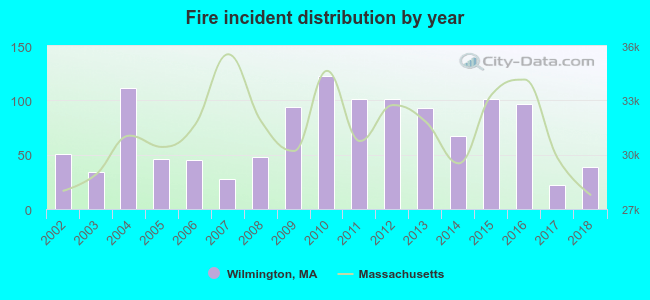
2002 - 2018 National Fire Incident Reporting System (NFIRS) incidents
According to the data from the years 2002 - 2018 the average number of fires per year is 71. The highest number of reported fires - 122 took place in 2010, and the least - 22 in 2017. The data has a dropping trend.
When looking into fire subcategories, the most incidents belonged to: Structure Fires (44.8%), and Outside Fires (29.1%).
Fire incident types reported to NFIRS in Wilmington, MA


 Recent articles from our blog. Our writers, many of them Ph.D. graduates or candidates, create easy-to-read articles on a wide variety of topics.

 (9.2 miles
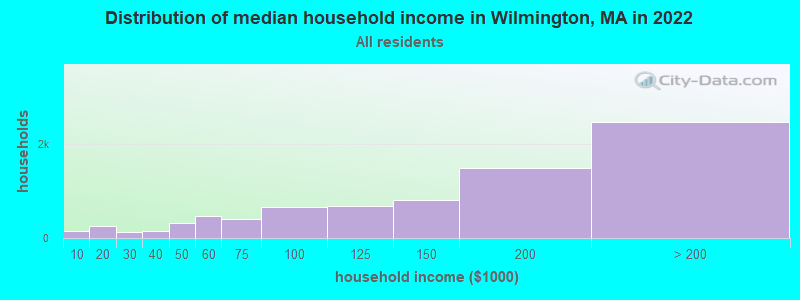


 According to the data from the years 2002 - 2018 the average number of fires per year is 71. The highest number of reported fires - 122 took place in 2010, and the least - 22 in 2017. The data has a dropping trend.
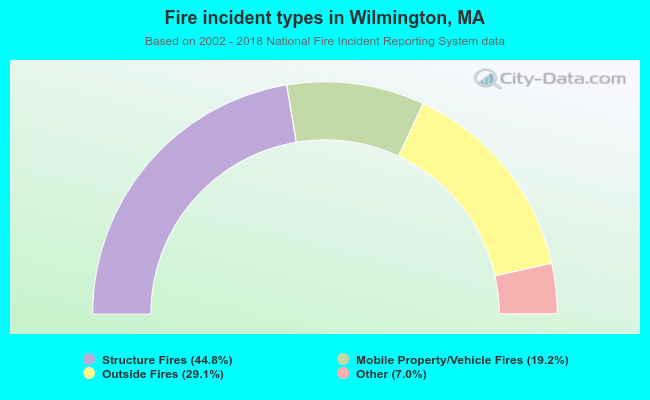 When looking into fire subcategories, the most incidents belonged to: Structure Fires (44.8%), and Outside Fires (29.1%).