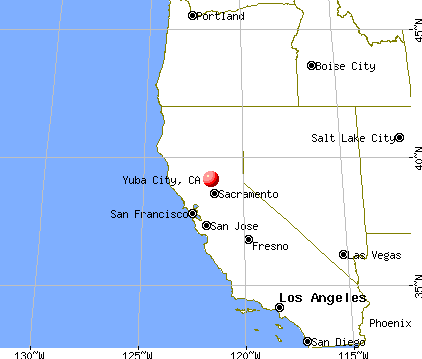
Yuba City, California
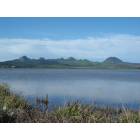
Yuba City: Sutter Buttes taken from Yuba City
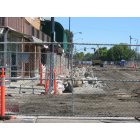
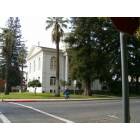
Yuba City: Third picture of plumas street facelift
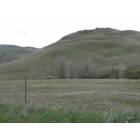
Yuba City: Sutter Buttes ( smallest mountian range) 1 of 2
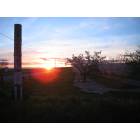
Yuba City: Sunset in Sutter County (farm lands)
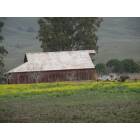
Yuba City: Old Barn in near Sutter Buttes
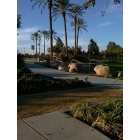
Yuba City: cache park
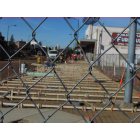
Yuba City: Plumas Street Facelift
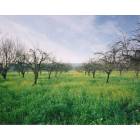
Yuba City: Farms
Yuba City: sutter county court house
- add
your
Submit your own pictures of this city and show them to the world
- OSM Map
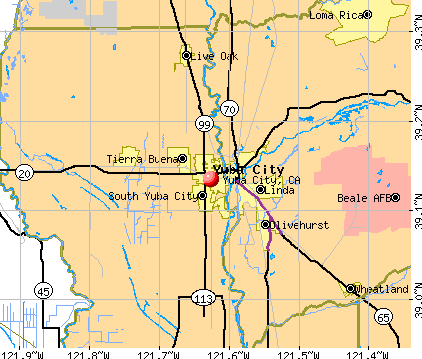
- General Map
- Google Map
- MSN Map
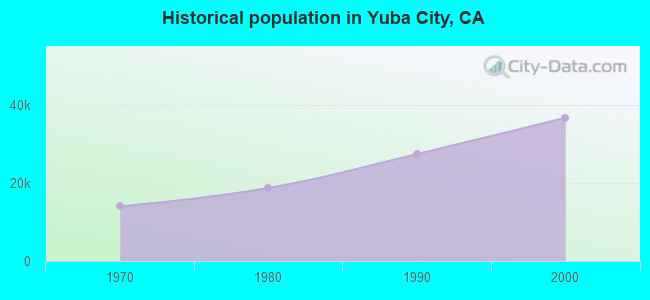
Population change since 2000: +87.8%
| Males: 35,535 | |
| Females: 33,479 |
| Median resident age: | 39.3 years |
| California median age: | 37.9 years |
Zip codes: 95991.
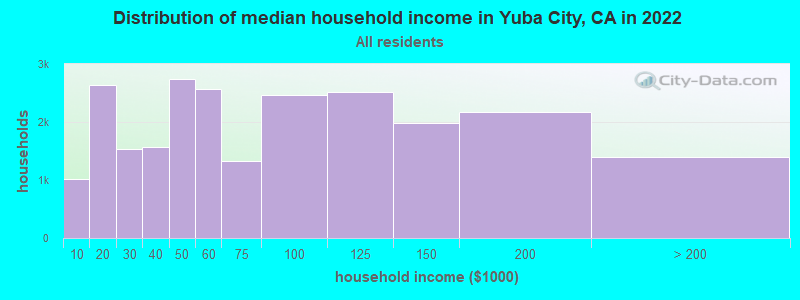
| Yuba City: | $59,588 |
| CA: | $91,551 |
Estimated per capita income in 2022: $30,331 (it was $15,928 in 2000)
Yuba City city income, earnings, and wages data
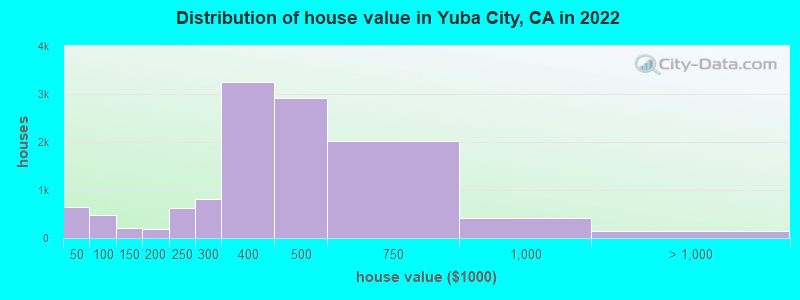
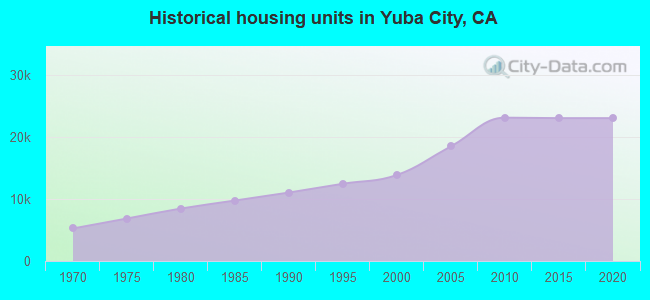
Estimated median house or condo value in 2022: $452,200 (it was $112,300 in 2000)
| Yuba City: | $452,200 |
| CA: | $715,900 |
Mean prices in 2022: all housing units: $444,206; detached houses: $469,437; townhouses or other attached units: $457,766; in 2-unit structures: $954,134; in 3-to-4-unit structures: $166,675; in 5-or-more-unit structures: $188,165; mobile homes: $82,718; occupied boats, rvs, vans, etc.: $17,910
Median gross rent in 2022: $1,448.
(11.2% for White Non-Hispanic residents, 19.7% for Black residents, 21.7% for Hispanic or Latino residents, 12.5% for American Indian residents, 7.6% for Native Hawaiian and other Pacific Islander residents, 27.1% for other race residents, 11.8% for two or more races residents)
Detailed information about poverty and poor residents in Yuba City, CA

Compare current foreclosures in Yuba City, CA:
| Photo | Address | Area | Beds / Baths | Price | Details |
|---|---|---|---|---|---|

|
#1
Chestnut St
Yuba City, CA 95991
|
640 sq. feet
|
1 baths 2 beds |
show details | |

|
#2
Colusa Hwy
Yuba City, CA 95993
|
2,586 sq. feet
|
2 baths 4 beds |
show details | |

|
#3
Oregon Way
Yuba City, CA 95991
|
- sq. feet
|
2 baths 4 beds |
show details | |

|
#4
Elmer Ave
Yuba City, CA 95993
|
- sq. feet
|
2 baths 3 beds |
show details | |

|
#5
Nand Dr
Yuba City, CA 95993
|
- sq. feet
|
2 baths 3 beds |
show details | |

|
#6
Nand Dr
Yuba City, CA 95993
|
- sq. feet
|
2 baths 4 beds |
show details | |

|
#7
Malaga Ct
Yuba City, CA 95993
|
- sq. feet
|
2 baths 4 beds |
show details | |

|
#8
Michigan Ct
Yuba City, CA 95991
|
- sq. feet
|
2 baths 4 beds |
show details | |

|
#9
Twin Rivers Dr
Yuba City, CA 95991
|
- sq. feet
|
3 baths 5 beds |
show details | |

|
#10
Michigan Ct
Yuba City, CA 95991
|
- sq. feet
|
2 baths 4 beds |
show details |
| Photo | Address | Area | Beds / Baths | Price | Details |
|---|---|---|---|---|---|

|
#11
Northfield Dr
Yuba City, CA 95993
|
- sq. feet
|
2 baths 3 beds |
show details | |

|
#12
Starlite Ln
Yuba City, CA 95991
|
- sq. feet
|
2 baths 4 beds |
show details | |

|
#13
Shelby Ct
Yuba City, CA 95991
|
- sq. feet
|
2 baths 4 beds |
show details | |

|
#14
Barrington Dr
Yuba City, CA 95993
|
- sq. feet
|
3 baths 5 beds |
show details | |

|
#15
Countryside Dr
Yuba City, CA 95993
|
- sq. feet
|
2 baths 4 beds |
show details | |

|
#16
Youngs Ln
Yuba City, CA 95991
|
- sq. feet
|
1 baths 3 beds |
show details | |

|
#17
Smith Rd
Yuba City, CA 95993
|
- sq. feet
|
2 baths 3 beds |
show details | |

|
#18
Countryside Dr
Yuba City, CA 95993
|
- sq. feet
|
2 baths 4 beds |
show details | |

|
#19
Provence Dr
Yuba City, CA 95993
|
- sq. feet
|
2 baths 3 beds |
show details | |

|
#20
Teesdale Ct
Yuba City, CA 95991
|
- sq. feet
|
2 baths 3 beds |
show details |
| Photo | Address | Area | Beds / Baths | Price | Details |
|---|---|---|---|---|---|

|
#21
Knights Row
Yuba City, CA 95991
|
- sq. feet
|
1 baths 3 beds |
show details | |

|
#22
Imperial Way
Yuba City, CA 95993
|
- sq. feet
|
2 baths 4 beds |
show details | |

|
#23
Clark Ave
Yuba City, CA 95991
|
- sq. feet
|
1 baths 1 beds |
show details | |

|
#24
Nadean Dr
Yuba City, CA 95993
|
- sq. feet
|
2 baths 4 beds |
show details | |

|
#25
Morton St
Yuba City, CA 95991
|
- sq. feet
|
2 baths 2 beds |
show details | |

|
#26
Periwinkle Ln
Yuba City, CA 95993
|
- sq. feet
|
2 baths 3 beds |
show details | |

|
#27
Claremont Way
Yuba City, CA 95991
|
- sq. feet
|
2 baths 3 beds |
show details | |

|
#28
Main St
Yuba City, CA 95991
|
- sq. feet
|
1 baths 3 beds |
show details | |

|
#29
Tiffany Way
Yuba City, CA 95991
|
- sq. feet
|
2 baths 3 beds |
show details | |

|
#30
Briarwood Ct
Yuba City, CA 95991
|
- sq. feet
|
2 baths 3 beds |
show details |
| Photo | Address | Area | Beds / Baths | Price | Details |
|---|---|---|---|---|---|

|
#31
Kensington Way
Yuba City, CA 95991
|
- sq. feet
|
3 baths 4 beds |
show details | |

|
#32
El Margarita Rd
Yuba City, CA 95993
|
- sq. feet
|
2 baths 3 beds |
show details | |

|
#33
Carmelo Way
Yuba City, CA 95991
|
- sq. feet
|
2 baths 4 beds |
show details | |

|
#34
N Woods Dr
Yuba City, CA 95991
|
- sq. feet
|
- baths - beds |
show details | |

|
#35
Stabler Ln Apt 39
Yuba City, CA 95993
|
- sq. feet
|
- baths - beds |
show details | |

|
#36
Live Oak Blvd Unit 92
Yuba City, CA 95991
|
- sq. feet
|
- baths - beds |
show details | |

|
#37
Chestnut St Apt 4
Yuba City, CA 95991
|
- sq. feet
|
- baths - beds |
show details | |

|
#38
Bancroft Ave
Yuba City, CA 95993
|
- sq. feet
|
- baths - beds |
show details | |

|
#39
Satori Way
Yuba City, CA 95993
|
- sq. feet
|
- baths - beds |
show details | |

|
#40
Reeves Ave
Yuba City, CA 95991
|
- sq. feet
|
- baths - beds |
show details |
| Photo | Address | Area | Beds / Baths | Price | Details |
|---|---|---|---|---|---|

|
#41
Bogue Rd Apt 137
Yuba City, CA 95991
|
- sq. feet
|
- baths - beds |
show details | |

|
#42
N George Washington Blvd
Yuba City, CA 95993
|
- sq. feet
|
- baths - beds |
show details | |

|
#43
Dorman Ave Apt A
Yuba City, CA 95991
|
- sq. feet
|
- baths - beds |
show details | |

|
#44
Pease Rd Unit 418
Yuba City, CA 95991
|
- sq. feet
|
- baths - beds |
show details | |

|
#45
Michelle Dr
Yuba City, CA 95993
|
- sq. feet
|
- baths - beds |
show details | |

|
#46
Brayton Loop
Yuba City, CA 95993
|
- sq. feet
|
- baths - beds |
show details | |

|
#47
Williams Way # 2
Yuba City, CA 95991
|
- sq. feet
|
- baths - beds |
show details | |

|
#48
Gray Ave Apt L
Yuba City, CA 95991
|
- sq. feet
|
- baths - beds |
show details | |

|
#49
El Margarita Rd
Yuba City, CA 95993
|
- sq. feet
|
- baths - beds |
show details | |

|
Check over 1 million property listings on Foreclosure.com!
|
browse all offers | |||


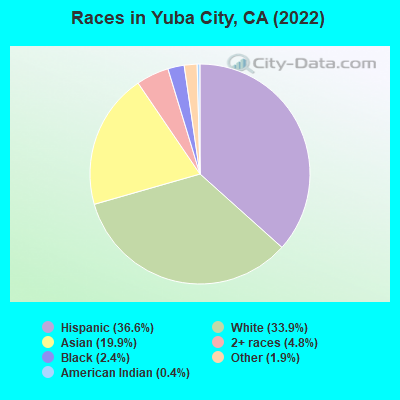
- 25,27536.6%Hispanic
- 23,39833.9%White alone
- 13,72519.9%Asian alone
- 3,3444.8%Two or more races
- 1,6782.4%Black alone
- 1,2811.9%Other race alone
- 3030.4%American Indian alone
According to our research of California and other state lists, there were 172 registered sex offenders living in Yuba City, California as of May 05, 2024.
The ratio of all residents to sex offenders in Yuba City is 389 to 1.
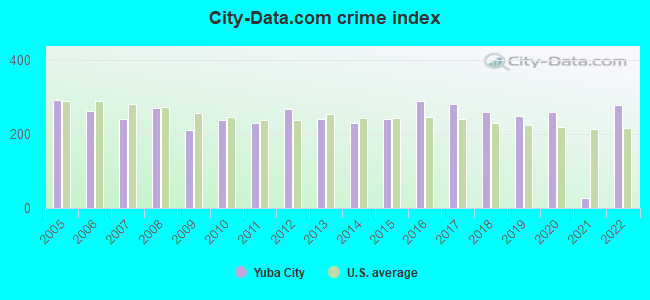
The City-Data.com crime index weighs serious crimes and violent crimes more heavily. Higher means more crime, U.S. average is 246.1. It adjusts for the number of visitors and daily workers commuting into cities.
- means the value is smaller than the state average.- means the value is about the same as the state average.
- means the value is bigger than the state average.
- means the value is much bigger than the state average.
Crime rate in Yuba City detailed stats: murders, rapes, robberies, assaults, burglaries, thefts, arson
Full-time law enforcement employees in 2021, including police officers: 85 (60 officers - 50 male; 10 female).
| Officers per 1,000 residents here: | 0.90 |
| California average: | 2.30 |
 Recent articles from our blog. Our writers, many of them Ph.D. graduates or candidates, create easy-to-read articles on a wide variety of topics.

 | Coronavirus (12544 replies) |
| Asking for a friend in california (4 replies) |
| Why does SoCal have so many Covid-19 cases vs. NorCal? (53 replies) |
| Please suggest a good community to buy a SFH for remote work (8 replies) |
| Paradise Fire/Camp Creek Fire 11/08/2018 (783 replies) |
| Best Mountain Town in CA? (79 replies) |
Latest news from Yuba City, CA collected exclusively by city-data.com from local newspapers, TV, and radio stations
Ancestries: American (4.5%), English (4.1%), German (2.1%), Irish (1.9%), Italian (1.4%), European (1.3%).
Current Local Time: PST time zone
Elevation: 59 feet
Land area: 9.37 square miles.
Population density: 7,368 people per square mile (high).
16,289 residents are foreign born (12.9% Asia, 9.3% Latin America).
| This city: | 23.6% |
| California: | 26.5% |
Median real estate property taxes paid for housing units with mortgages in 2022: $3,246 (0.7%)
Median real estate property taxes paid for housing units with no mortgage in 2022: $2,709 (0.8%)
Nearest city with pop. 50,000+: Roseville, CA  (32.1 miles , pop. 79,921).
Nearest city with pop. 200,000+: Sacramento, CA (40.9 miles , pop. 407,018).
Nearest city with pop. 1,000,000+: Los Angeles, CA (393.0 miles , pop. 3,694,820).
Nearest cities:
), ), ), )Latitude: 39.13 N, Longitude: 121.63 W
Daytime population change due to commuting: +704 (+1.0%)
Workers who live and work in this city: 12,515 (47.5%)
Area code commonly used in this area: 530
Yuba City, California accommodation & food services, waste management - Economy and Business Data
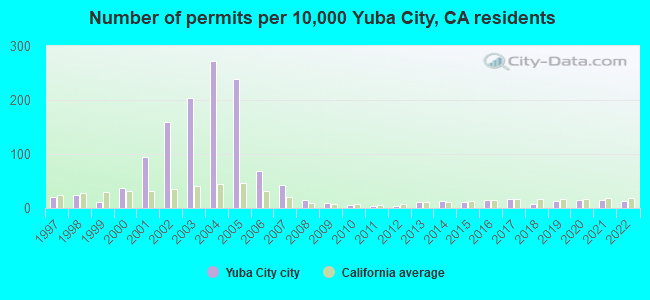
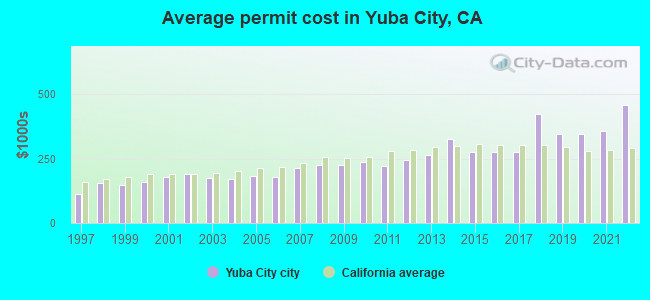
Single-family new house construction building permits:
- 2022: 48 buildings, average cost: $459,900
- 2021: 52 buildings, average cost: $359,000
- 2020: 54 buildings, average cost: $347,300
- 2019: 49 buildings, average cost: $347,300
- 2018: 28 buildings, average cost: $422,900
- 2017: 59 buildings, average cost: $274,900
- 2016: 56 buildings, average cost: $274,900
- 2015: 45 buildings, average cost: $274,900
- 2014: 47 buildings, average cost: $327,800
- 2013: 45 buildings, average cost: $266,400
- 2012: 15 buildings, average cost: $247,100
- 2011: 14 buildings, average cost: $220,700
- 2010: 20 buildings, average cost: $235,800
- 2009: 33 buildings, average cost: $226,300
- 2008: 54 buildings, average cost: $227,300
- 2007: 158 buildings, average cost: $215,000
- 2006: 254 buildings, average cost: $178,200
- 2005: 875 buildings, average cost: $183,500
- 2004: 1001 buildings, average cost: $172,400
- 2003: 750 buildings, average cost: $173,500
- 2002: 589 buildings, average cost: $188,900
- 2001: 351 buildings, average cost: $177,300
- 2000: 136 buildings, average cost: $159,100
- 1999: 44 buildings, average cost: $147,000
- 1998: 88 buildings, average cost: $156,600
- 1997: 78 buildings, average cost: $114,300
| Here: | 8.7% |
| California: | 5.1% |
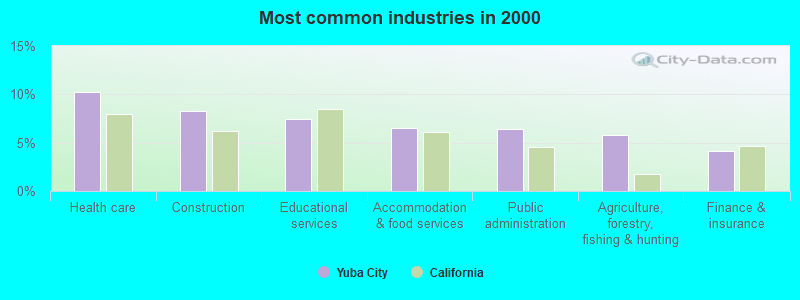
- Health care (10.2%)
- Construction (8.3%)
- Educational services (7.4%)
- Accommodation & food services (6.5%)
- Public administration (6.4%)
- Agriculture, forestry, fishing & hunting (5.8%)
- Finance & insurance (4.1%)
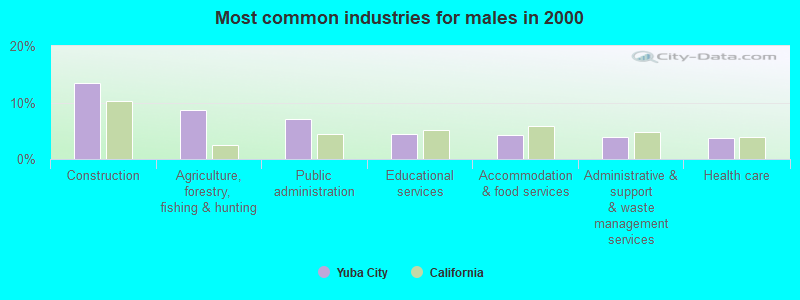
- Construction (13.4%)
- Agriculture, forestry, fishing & hunting (8.7%)
- Public administration (7.1%)
- Educational services (4.4%)
- Accommodation & food services (4.3%)
- Administrative & support & waste management services (3.9%)
- Health care (3.8%)
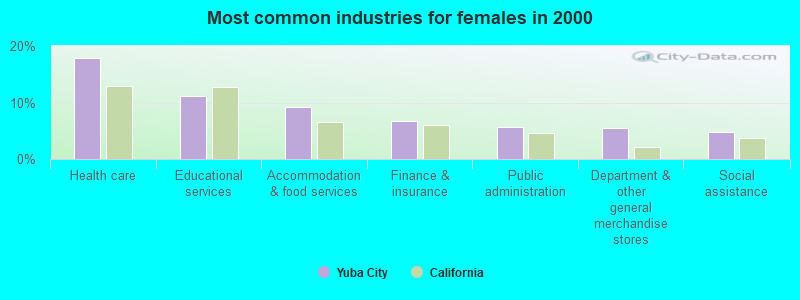
- Health care (17.9%)
- Educational services (11.1%)
- Accommodation & food services (9.2%)
- Finance & insurance (6.7%)
- Public administration (5.7%)
- Department & other general merchandise stores (5.4%)
- Social assistance (4.7%)
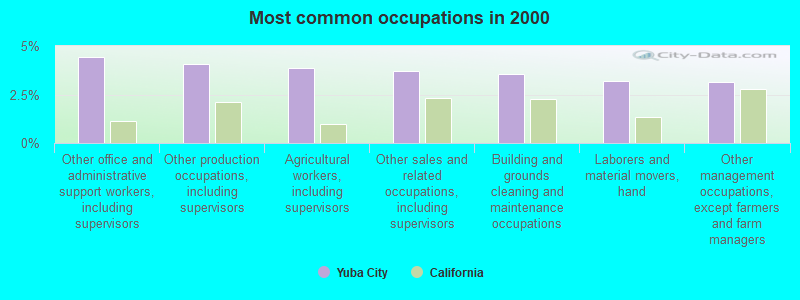
- Other office and administrative support workers, including supervisors (4.4%)
- Other production occupations, including supervisors (4.1%)
- Agricultural workers, including supervisors (3.9%)
- Other sales and related occupations, including supervisors (3.7%)
- Building and grounds cleaning and maintenance occupations (3.5%)
- Laborers and material movers, hand (3.2%)
- Other management occupations, except farmers and farm managers (3.1%)
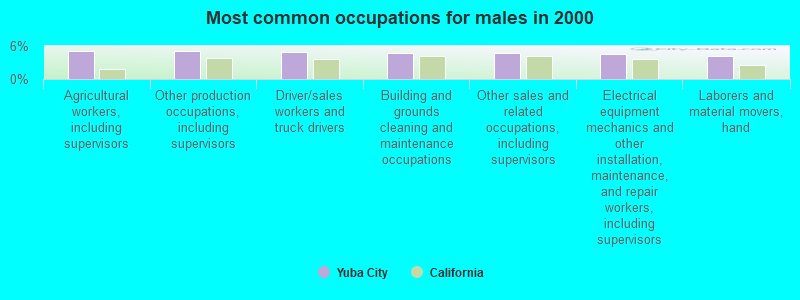
- Agricultural workers, including supervisors (5.1%)
- Other production occupations, including supervisors (5.0%)
- Driver/sales workers and truck drivers (4.9%)
- Building and grounds cleaning and maintenance occupations (4.7%)
- Other sales and related occupations, including supervisors (4.7%)
- Electrical equipment mechanics and other installation, maintenance, and repair workers, including supervisors (4.6%)
- Laborers and material movers, hand (4.1%)
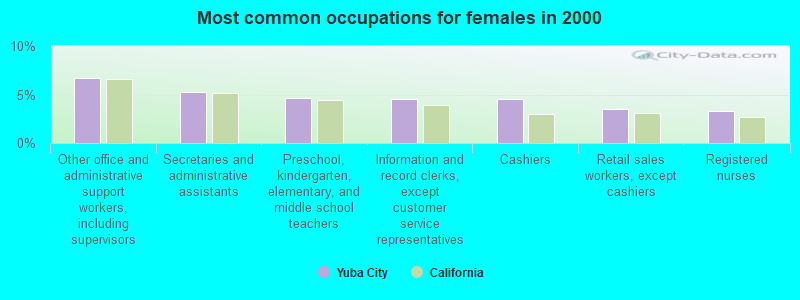
- Other office and administrative support workers, including supervisors (6.7%)
- Secretaries and administrative assistants (5.2%)
- Preschool, kindergarten, elementary, and middle school teachers (4.6%)
- Information and record clerks, except customer service representatives (4.5%)
- Cashiers (4.5%)
- Retail sales workers, except cashiers (3.5%)
- Registered nurses (3.3%)
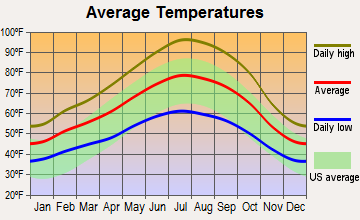
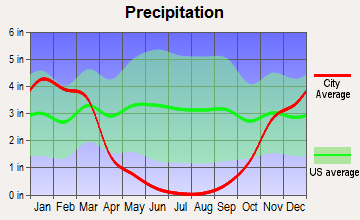
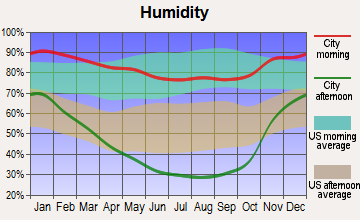
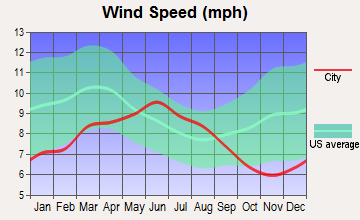
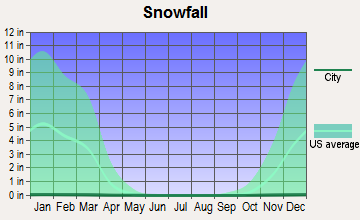
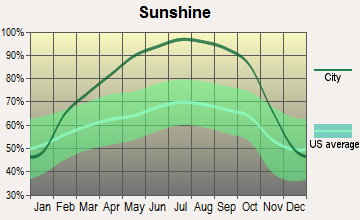
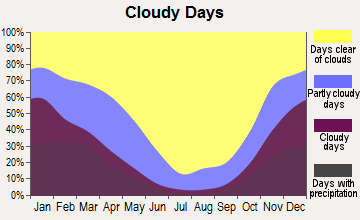
Average climate in Yuba City, California
Based on data reported by over 4,000 weather stations
|
|

(lower is better)
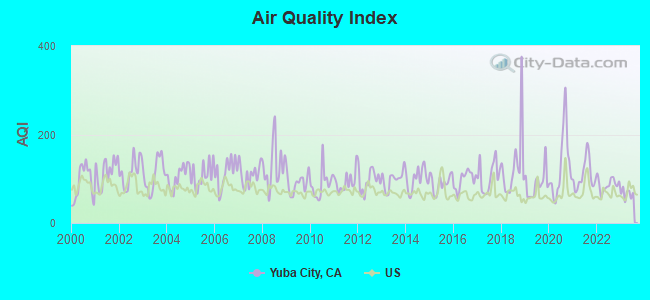
Air Quality Index (AQI) level in 2023 was 66.2. This is about average.
| City: | 66.2 |
| U.S.: | 72.6 |
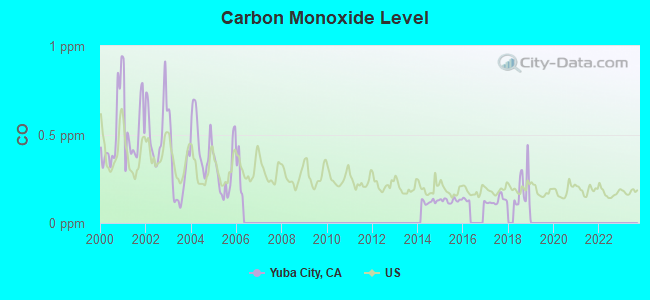
Carbon Monoxide (CO) [ppm] level in 2018 was 0.191. This is better than average. Closest monitor was 0.2 miles away from the city center.
| City: | 0.191 |
| U.S.: | 0.251 |
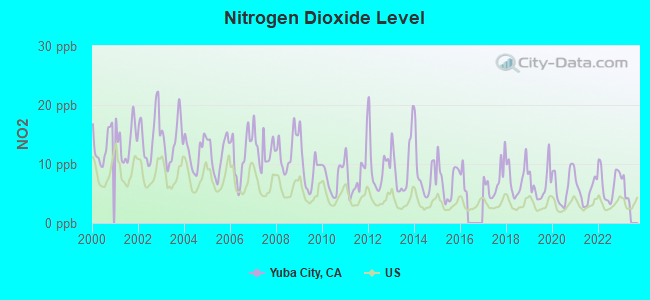
Nitrogen Dioxide (NO2) [ppb] level in 2022 was 6.65. This is worse than average. Closest monitor was 0.2 miles away from the city center.
| City: | 6.65 |
| U.S.: | 5.11 |
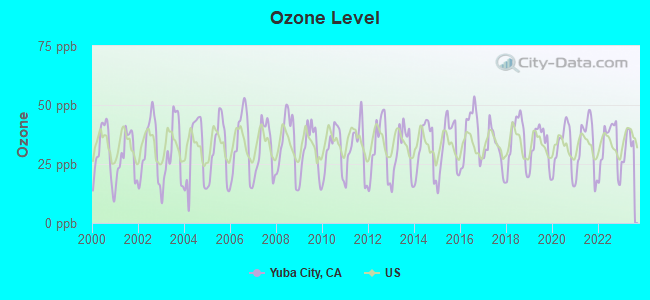
Ozone [ppb] level in 2023 was 33.0. This is about average. Closest monitor was 1.5 miles away from the city center.
| City: | 33.0 |
| U.S.: | 33.3 |
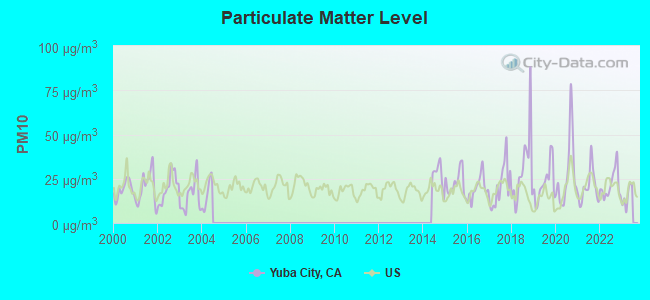
Particulate Matter (PM10) [µg/m3] level in 2022 was 21.5. This is about average. Closest monitor was 0.5 miles away from the city center.
| City: | 21.5 |
| U.S.: | 19.2 |
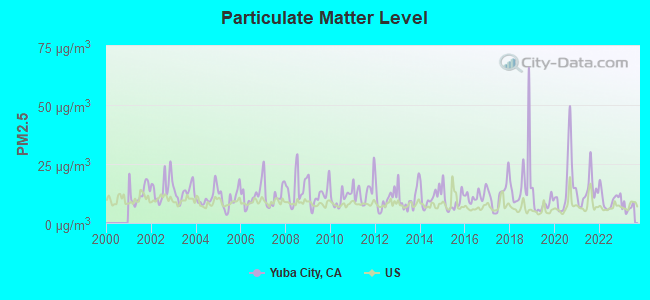
Particulate Matter (PM2.5) [µg/m3] level in 2023 was 6.57. This is better than average. Closest monitor was 0.5 miles away from the city center.
| City: | 6.57 |
| U.S.: | 8.11 |
Earthquake activity:
Yuba City-area historical earthquake activity is significantly above California state average. It is 7255% greater than the overall U.S. average.On 4/18/1906 at 13:12:21, a magnitude 7.9 (7.9 UK, Class: Major, Intensity: VIII - XII) earthquake occurred 108.1 miles away from Yuba City center, causing $524,000,000 total damage
On 1/31/1922 at 13:17:28, a magnitude 7.6 (7.6 UK) earthquake occurred 234.7 miles away from Yuba City center
On 10/3/1915 at 06:52:48, a magnitude 7.6 (7.6 UK) earthquake occurred 238.7 miles away from the city center
On 4/25/1992 at 18:06:04, a magnitude 7.2 (6.3 MB, 7.1 MS, 7.2 MW, 7.1 MW, Depth: 9.4 mi) earthquake occurred 154.7 miles away from the city center, causing $75,000,000 total damage
On 10/18/1989 at 00:04:15, a magnitude 7.1 (6.5 MB, 7.1 MS, 6.9 MW, 7.0 ML) earthquake occurred 140.3 miles away from Yuba City center, causing 62 deaths (62 shaking deaths) and 3757 injuries, causing $1,305,032,704 total damage
On 12/21/1932 at 06:10:09, a magnitude 7.2 (7.2 UK) earthquake occurred 195.7 miles away from the city center
Magnitude types: body-wave magnitude (MB), local magnitude (ML), surface-wave magnitude (MS), moment magnitude (MW)
Natural disasters:
The number of natural disasters in Sutter County (15) is near the US average (15).Major Disasters (Presidential) Declared: 10
Emergencies Declared: 2
Causes of natural disasters: Floods: 11, Storms: 5, Winter Storms: 5, Landslides: 3, Mudslides: 3, Drought: 1, Freeze: 1, Heavy Rain: 1, Hurricane: 1, Tornado: 1, Other: 1 (Note: some incidents may be assigned to more than one category).
Hospitals in Yuba City:
- FREMONT MEDICAL CENTER (provides emergency services, 970 PLUMAS ST)
- FREMONT-RIDEOUT HOME HLTH/VALLEY HOSPICE (1260 WILLIAMS WAY)
- RCCA - WHITE OAKS (1805 WHITE OAKS DRIVE)
- SIERRA VISTA ICF/DD (1251 STABLER LANE)
- SUN RIDGE HOSPITAL (1251 STABLER LANE)
- SUTTER SURGICAL HOSPITAL - NORTH VALLEY (Proprietary, 455 PLUMAS BLVD)
Nursing Homes in Yuba City:
- FOUNTAINS, THE (1260 WILLIAMS WAY)
- YUBA CITY CARE CENTER (1220 PLUMAS STREET)
- YUBA SKILLED NURSING CENTER (521 LOREL WAY)
Dialysis Facilities in Yuba City:
- PLUMAS STREET DIALYSIS CENTER (2115 EAST ONSTOTT ROAD)
- YUBA CITY DIALYSIS CENTER (1525 PLUMAS COURT SUITE A)
Home Health Centers in Yuba City:
Airports located in Yuba City:
- Sutter County Airport (O52) (Runways: 1, Air Taxi Ops: 100, Itinerant Ops: 2,500, Local Ops: 5,400)
- Vanderford Ranch Company Airport (CA73) (Runways: 1)
College/University in Yuba City:
Colleges/universities with over 2000 students nearest to Yuba City:
- Yuba College (about 5 miles; Marysville, CA; Full-time enrollment: 4,737)
- Sierra College (about 33 miles; Rocklin, CA; FT enrollment: 11,488)
- Universal Technical Institute of Northern California Inc (about 35 miles; Sacramento, CA; FT enrollment: 3,193)
- Butte College (about 36 miles; Oroville, CA; FT enrollment: 8,649)
- University of Phoenix-Sacramento Valley Campus (about 36 miles; Sacramento, CA; FT enrollment: 2,855)
- American River College (about 37 miles; Sacramento, CA; FT enrollment: 20,452)
- California State University-Sacramento (about 42 miles; Sacramento, CA; FT enrollment: 22,234)
Public high schools in Yuba City:
- RIVER VALLEY HIGH (Students: 1,222, Location: 801 EL MARGARITA RD., Grades: 9-12)
- YUBA CITY HIGH (Students: 1,174, Location: 850 B ST., Grades: 9-12)
- SUTTER COUNTY SPECIAL EDUCATION (Students: 151, Location: 970 KLAMATH LN., Grades: KG-12)
- YUBA CITY CHARTER (Students: 114, Location: 256 WILBUR AVE., Grades: KG-12, Charter school)
- ALBERT POWELL CONTINUATION (Students: 62, Location: 1875 CLARK AVE., Grades: 10-12)
- YUBA CITY UNIFIED ALTERNATIVE (Students: 58, Location: 984 B ST., Grades: KG-12)
- FEATHER RIVER ACADEMY (Students: 49, Location: 1895 LASSEN BLVD., Grades: 7-12)
- TRI-COUNTY ROP (Location: 970 KLAMATH LN., Grades: 9-12)
Private high schools in Yuba City:
Biggest public elementary/middle schools in Yuba City:
- RIVERBEND ELEMENTARY (Students: 717, Location: 301 STEWART RD., Grades: KG-8)
- BUTTE VISTA ELEMENTARY (Students: 713, Location: 2195 BLEVIN RD., Grades: KG-8)
- GRAY AVENUE MIDDLE (Students: 665, Location: 808 GRAY AVE., Grades: 6-8)
- TIERRA BUENA ELEMENTARY (Students: 572, Location: 1794 VILLA AVE., Grades: KG-8)
- BARRY ELEMENTARY (Students: 431, Location: 1255 BARRY RD., Grades: KG-8)
- LINCREST ELEMENTARY (Students: 421, Location: 1400 PHILLIPS RD., Grades: KG-5)
- ANDROS KARPEROS (Students: 389, Location: 1700 CAMINO DE FLORES, Grades: KG-8)
- PARK AVENUE ELEMENTARY (Students: 308, Location: 100 MORTON ST., Grades: KG-5)
- APRIL LANE ELEMENTARY (Students: 296, Location: 800 APRIL LN., Grades: KG-5)
- BRIDGE STREET ELEMENTARY (Students: 255, Location: 500 BRIDGE ST., Grades: KG-5)
Private elementary/middle schools in Yuba City:
User-submitted facts and corrections:
- First Lutheran School is no longer open. Twin Rivers Charter School is now there in its place. Address-840 Cooper Ave.
Points of interest:
Notable locations in Yuba City: Yuba City Womens Club (A), Yuba City City Hall (B), Sutter County Office Building (C), Sutter County Museum (D), Sutter County Law Library (E), Sutter County Jail (F), Sutter County Free Library (G), Sutter County Courthouse (H), Sutter - Yuba Mental Health Services (I), Bi - County Ambulance (J), North Valley Behavioral Health (K), Yuba City Farm Labor Center (L), Yuba City Fire Department Station 2 (M), Yuba City Fire Department Station 3 (N), Yuba City Fire Department Station 1 (O). Display/hide their locations on the map
Churches in Yuba City include: Tabernacle De La Fe (A), Saint Isidore Catholic Church (B), Reorganized Church of Jesus Christ of Latter Day Saints (C), Pentecostal Holiness Church (D), Kingdom Hall of Jehovahs Witnesses (E), First United Methodist Church (F), First Lutheran Church (G), First Church of Christ Scientist (H), Cooper Avenue Baptist Church (I). Display/hide their locations on the map
Cemetery: Yuba City Cemetery (1). Display/hide its location on the map
Parks in Yuba City include: Alta Park (1), Blackburn Talley Park (2), Gauche Park (3), Greenwood Park (4), Hillcrest Park (5), Kingwood Park (6), Maple Park (7), Morley Park (8), Sam Brannan Park (9). Display/hide their locations on the map
Tourist attraction: Creative Art Center (Art Museums; 732 Plumas Street).
Hotels: Best Western Bonanza Inn & Convention Center (1001 Clark Avenue), Best Western Bonanza Inn (1001 Clark Avenue).
Court: Sutter County - Drug Court- Adult Division- Batterer's Treatment Program- Probation Depart (595 Boyd Street).
Birthplace of: Wally Herger - Politician, Chris Petersen - College football player, Charlotte Stewart - Actor, Marcie Dodd - Female singer, Leanne Marshall - Fashion designer, Michael P. Moran - Film actor.
Drinking water stations with addresses in Yuba City and their reported violations in the past:
SHADY CREEK OUTDOOR SCHOOL (Population served: 180, Groundwater):Past health violations:PANCAKE BAY MUTUAL WATER CO. (Population served: 40, Groundwater):Past monitoring violations:
- MCL, Monthly (TCR) - In MAY-2012, Contaminant: Coliform. Follow-up actions: St Formal NOV issued (JUN-11-2012), St Tech Assistance Visit (JUN-20-2012), St Violation/Reminder Notice (AUG-31-2012)
- MCL, Monthly (TCR) - In APR-2012, Contaminant: Coliform. Follow-up actions: St Boil Water Order (APR-27-2012), St Public Notif issued (APR-27-2012), St Formal NOV issued (APR-27-2012)
- MCL, Monthly (TCR) - In MAY-2011, Contaminant: Coliform. Follow-up actions: St Public Notif issued (MAY-11-2011), St Violation/Reminder Notice (MAY-11-2011), St Boil Water Order (MAY-11-2011), St AO (w/o penalty) issued (MAY-11-2011), St Tech Assistance Visit (MAY-13-2011), St Compliance achieved (JUN-30-2011)
- MCL, Monthly (TCR) - In FEB-2011, Contaminant: Coliform. Follow-up actions: St Public Notif issued (FEB-18-2011), St Violation/Reminder Notice (FEB-18-2011), St Boil Water Order (FEB-18-2011), St AO (w/o penalty) issued (MAY-11-2011), St Compliance achieved (JUN-30-2011)
- MCL, Acute (TCR) - In OCT-2010, Contaminant: Coliform. Follow-up actions: St Boil Water Order (OCT-28-2010), St Violation/Reminder Notice (OCT-28-2010), St Public Notif issued (NOV-19-2010), St Violation/Reminder Notice (NOV-24-2010), St Public Notif issued (DEC-03-2010), St Violation/Reminder Notice (DEC-29-2010), St Compliance achieved (JAN-31-2011)
- MCL, Acute (TCR) - In APR-2010, Contaminant: Coliform. Follow-up actions: St Public Notif issued (MAY-04-2010), St Site Visit (enforcement) (MAY-05-2010), St Boil Water Order (MAY-05-2010), St Compliance achieved (JUL-22-2010)
- 2 other older health violations
- One routine major monitoring violation
Past health violations:WALNUT TREE (Population served: 25, Groundwater):Past monitoring violations:
- MCL, Monthly (TCR) - In AUG-2009, Contaminant: Coliform. Follow-up actions: St Violation/Reminder Notice (SEP-08-2009)
- MCL, Monthly (TCR) - In JUL-2008, Contaminant: Coliform. Follow-up actions: St Violation/Reminder Notice (JUL-12-2008)
- MCL, Monthly (TCR) - In JUL-2008, Contaminant: Coliform. Follow-up actions: St Violation/Reminder Notice (JUL-12-2008)
- 3 routine major monitoring violations
Past health violations:RIVER RANCH CAMP W.S. (Population served: 25, Groundwater):
- MCL, Monthly (TCR) - Between APR-2012 and JUN-2012, Contaminant: Coliform. Follow-up actions: St Formal NOV issued (JUL-03-2012), St Compliance achieved (SEP-18-2012)
Past health violations:RANCH HOUSE RESTAURANT & BAR (Population served: 25, Groundwater):Past monitoring violations:
- MCL, Monthly (TCR) - In SEP-2010, Contaminant: Coliform. Follow-up actions: St Compliance achieved (OCT-18-2010)
- One routine major monitoring violation
- 2 minor monitoring violations
Past monitoring violations:LA PORTE PINES COUNTRY CLUB (Population served: 25, Groundwater):
- 2 routine major monitoring violations
- One regular monitoring violation
Past health violations:LEXINGTON INN & SUITES (Population served: 25, Groundwater):Past monitoring violations:
- MCL, Monthly (TCR) - In SEP-2013, Contaminant: Coliform. Follow-up actions: St AO (w/o penalty) issued (2 times from AUG-27-2013 to OCT-24-2013)
- MCL, Monthly (TCR) - In JUL-2013, Contaminant: Coliform. Follow-up actions: St AO (w/o penalty) issued (2 times from JUL-21-2011 to AUG-27-2013)
- MCL, Monthly (TCR) - In JUN-2011, Contaminant: Coliform. Follow-up actions: St Violation/Reminder Notice (2 times from FEB-24-2009 to FEB-24-2009), St AO (w/o penalty) issued (JUL-21-2011)
- MCL, Monthly (TCR) - In NOV-2008, Contaminant: Coliform. Follow-up actions: St Violation/Reminder Notice (2 times from DEC-19-2006 to JAN-08-2009)
- MCL, Monthly (TCR) - In NOV-2008, Contaminant: Coliform. Follow-up actions: St Violation/Reminder Notice (JAN-08-2009)
- MCL, Monthly (TCR) - In OCT-2006, Contaminant: Coliform. Follow-up actions: St Violation/Reminder Notice (DEC-19-2006)
- 2 minor monitoring violations
Past health violations:Past monitoring violations:
- MCL, Monthly (TCR) - In SEP-2011, Contaminant: Coliform
- MCL, Monthly (TCR) - In SEP-2011, Contaminant: Coliform. Follow-up actions: St Compliance achieved (OCT-21-2011)
- 7 routine major monitoring violations
Drinking water stations with addresses in Yuba City that have no violations reported:
- SRI GURU NANAK SIKH TEMPLE (Population served: 100, Primary Water Source Type: Groundwater)
- LIVE OAK RECREATION AREA (Population served: 50, Primary Water Source Type: Groundwater)
| This city: | 3.0 people |
| California: | 2.9 people |
| This city: | 72.7% |
| Whole state: | 68.7% |
| This city: | 7.2% |
| Whole state: | 7.2% |
Likely homosexual households (counted as self-reported same-sex unmarried-partner households)
- Lesbian couples: 0.3% of all households
- Gay men: 0.2% of all households
People in group quarters in Yuba City in 2010:
- 247 people in nursing facilities/skilled-nursing facilities
- 195 people in local jails and other municipal confinement facilities
- 49 people in other noninstitutional facilities
- 27 people in group homes intended for adults
- 25 people in residential treatment centers for adults
- 24 people in workers' group living quarters and job corps centers
- 10 people in hospitals with patients who have no usual home elsewhere
- 3 people in group homes for juveniles (non-correctional)
People in group quarters in Yuba City in 2000:
- 449 people in nursing homes
- 252 people in local jails and other confinement facilities (including police lockups)
- 192 people in other noninstitutional group quarters
- 16 people in other nonhousehold living situations
- 5 people in homes for the mentally retarded
- 2 people in religious group quarters
Banks with most branches in Yuba City (2011 data):
- Tri Counties Bank: Yuba City Branch, Yuba City Onstott Branch, Yuba City Market Place. Info updated 2011/09/26: Bank assets: $2,554.4 mil, Deposits: $2,191.2 mil, headquarters in Chico, CA, positive income, Commercial Lending Specialization, 71 total offices, Holding Company: Trico Bancshares
- Wells Fargo Bank, National Association: Yuba Plaza Branch at 900 Colusa Avenue, branch established on 1963/10/28; Bel Air Yuba City Branch at 1286 Stabler Lane, branch established on 1997/12/10. Info updated 2011/04/05: Bank assets: $1,161,490.0 mil, Deposits: $905,653.0 mil, headquarters in Sioux Falls, SD, positive income, 6395 total offices, Holding Company: Wells Fargo & Company
- Bank of Feather River: Bank Of Feather River at 855 Harter Parkway, Suite 100, branch established on 2007/11/06; Bank Of Feather River Branch at 855 Harter Parkway Suite 100, branch established on 2007/11/06. Info updated 2009/06/11: Bank assets: $51.1 mil, Deposits: $43.7 mil, local headquarters, positive income, Agricultural Specialization, 2 total offices
- Umpqua Bank: Yuba City Bridge Street Branch at 1221 Bridge Street, branch established on 1982/02/01; Yuba City Hwy 20 Branch at 777 Colusa Avenue, branch established on 1977/04/06. Info updated 2011/09/02: Bank assets: $11,556.7 mil, Deposits: $9,325.3 mil, headquarters in Roseburg, OR, positive income, Commercial Lending Specialization, 193 total offices, Holding Company: Umpqua Holdings Corporation
- JPMorgan Chase Bank, National Association: Yuba City Branch at 1054 Harter Road, Suite 1, branch established on 2007/12/03; 540 Colusa Ave Branch at 540 Colusa Ave, branch established on 1889/01/01. Info updated 2011/11/10: Bank assets: $1,811,678.0 mil, Deposits: $1,190,738.0 mil, headquarters in Columbus, OH, positive income, International Specialization, 5577 total offices, Holding Company: Jpmorgan Chase & Co.
- Gold Pacific Bank, National Association: Yuba City Branch 04 at 620 N. Walton Ave, branch established on 1996/01/24. Info updated 2012/04/03: Bank assets: $130.9 mil, Deposits: $118.3 mil, headquarters in Marysville, CA, negative income in the last year, Commercial Lending Specialization, 8 total offices, Holding Company: Golden Pacific Bancorp, Inc.
- Bank of America, National Association: Yuba City Branch at 1100 Butte House Road, branch established on 1927/02/19. Info updated 2009/11/18: Bank assets: $1,451,969.3 mil, Deposits: $1,077,176.8 mil, headquarters in Charlotte, NC, positive income, 5782 total offices, Holding Company: Bank Of America Corporation
- River Valley Community Bank: at 1629 Colusa Highway, branch established on 2006/06/26. Info updated 2006/12/08: Bank assets: $139.8 mil, Deposits: $121.2 mil, local headquarters, positive income, 1 total offices
- U.S. Bank National Association: Yuba City Branch at 903 Colusa Avenue, branch established on 1974/12/02. Info updated 2012/01/30: Bank assets: $330,470.8 mil, Deposits: $236,091.5 mil, headquarters in Cincinnati, OH, positive income, 3121 total offices, Holding Company: U.S. Bancorp
- 3 other banks with 3 local branches
For population 15 years and over in Yuba City:
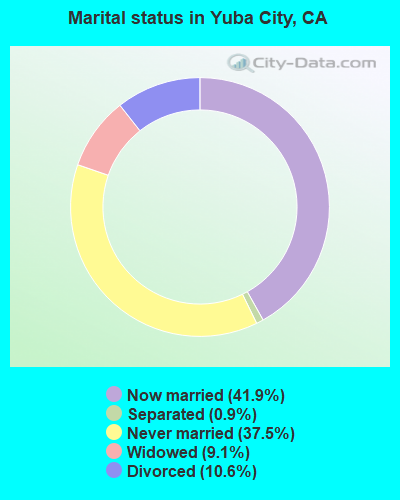
- Never married: 37.5%
- Now married: 41.9%
- Separated: 0.9%
- Widowed: 9.1%
- Divorced: 10.6%
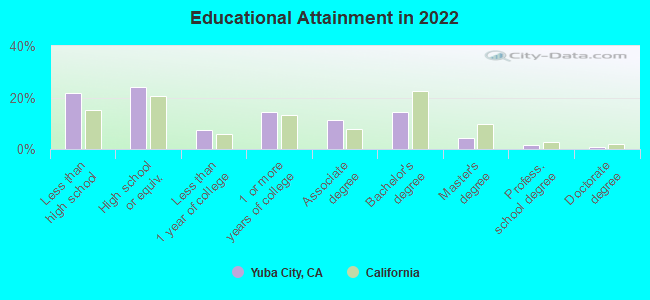
For population 25 years and over in Yuba City:
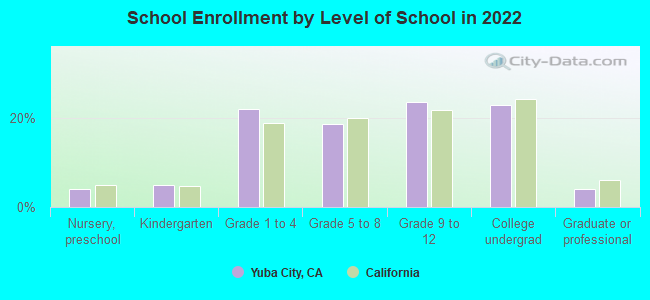
- High school or higher: 78.2%
- Bachelor's degree or higher: 21.2%
- Graduate or professional degree: 6.9%
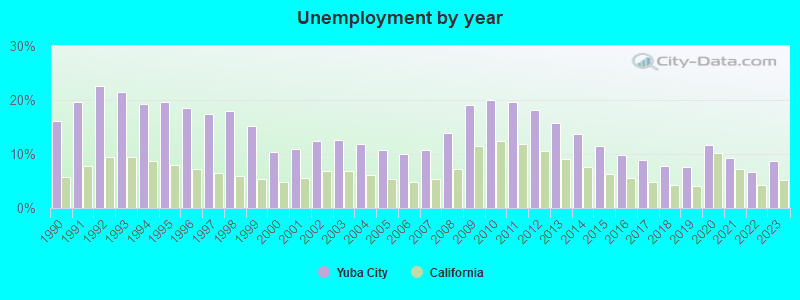
- Unemployed: 10.3%
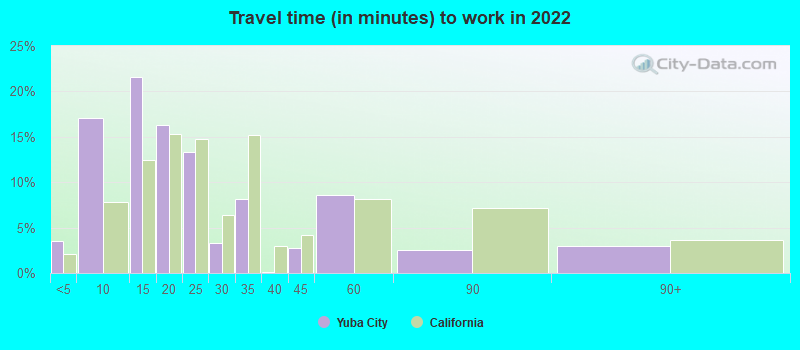
- Mean travel time to work (commute): 23.6 minutes
| Here: | 16.8 |
| California average: | 15.5 |
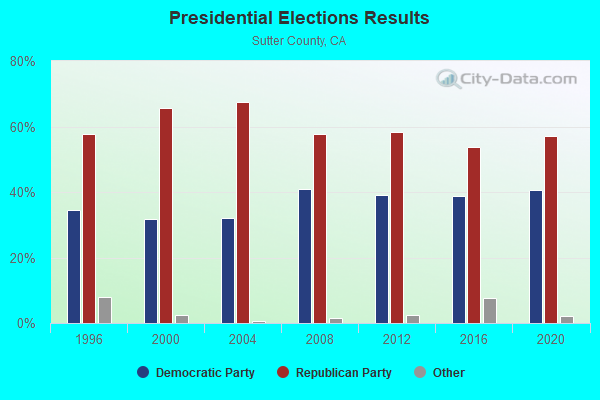
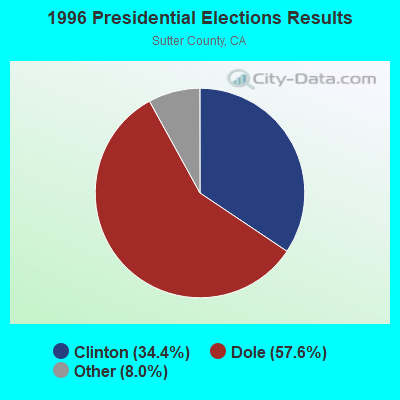
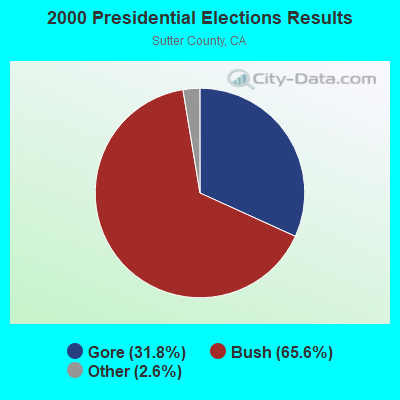
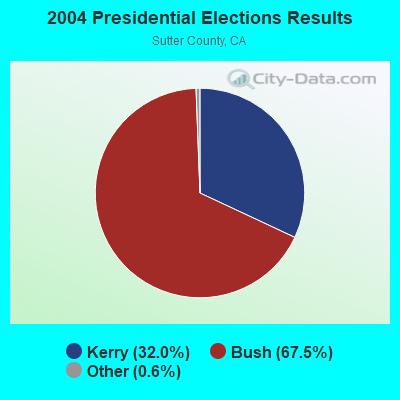
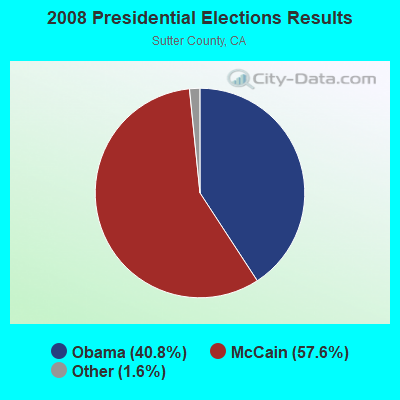
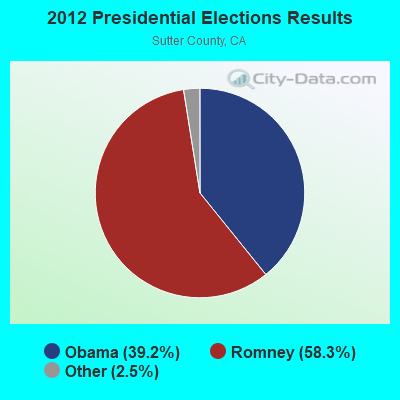
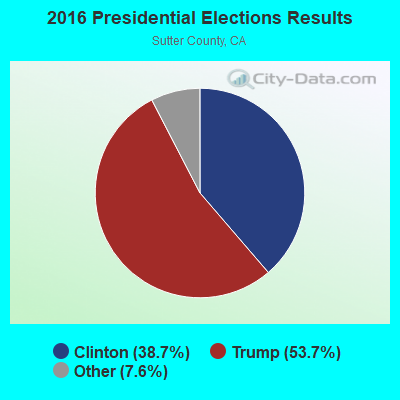
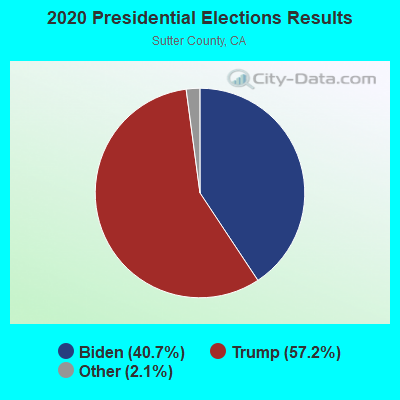
Graphs represent county-level data. Detailed 2008 Election Results
Neighborhoods in Yuba City:
(Yuba City, California Neighborhood Map)- Bay Drive Estates neighborhood
- Bogue Ranch neighborhood
- Boyd Ranch Estates neighborhood
- Bridge Street Estates neighborhood
- Bridge Street Village neighborhood
- Bryn Mawr neighborhood
- Bryn Mawr Estates neighborhood
- Buena Vista neighborhood
- Butte House neighborhood
- Butte Rancho neighborhood
- Butte View Estates neighborhood
- Changaris Heights neighborhood
- Cherry Estates neighborhood
- Civic Center Plaza neighborhood
- Conutry Aire neighborhood
- Cypress neighborhood
- Daytona Estates neighborhood
- Delmonte Ranch neighborhood
- Eadowood neighborhood
- El Margarita Estates neighborhood
- El Marguerita neighborhood
- El Marguertia neighborhood
- Franklin Acres neighborhood
- Franklin Ave Homesites neighborhood
- Franklin Road Estates neighborhood
- Franklin Terrace neighborhood
- Fuglaar neighborhood
- Hallie neighborhood
- Hampton Estates neighborhood
- Hetherington Place neighborhood
- Holly Tree Woods neighborhood
- Hunji Village neighborhood
- Inglerock Estates neighborhood
- Jodi Drive Estates neighborhood
- Karnegis Estates neighborhood
- Kira Estates neighborhood
- Kushlia Village neighborhood
- La Paloma neighborhood
- Lincoln neighborhood
- Lincoln Heights neighborhood
- Lincoln Park neighborhood
- Lincoln Pointe neighborhood
- Lincoln Village Estates neighborhood
- Loma Vista neighborhood
- Masera Ranch neighborhood
- Mc Cune Estates neighborhood
- Meadowood neighborhood
- Moore-Fuglaar neighborhood
- North South Butte Village neighborhood
- Orchard neighborhood
- Phalla Estates neighborhood
- Quail Pointe Estates neighborhood
- Rai Estates neighborhood
- Ranchero Estates neighborhood
- Rancho Cortez neighborhood
- Rancho Del Oro neighborhood
- Rancho Deroyo neighborhood
- Ravenwood neighborhood
- Richland Ranch Estates neighborhood
- River Valley Estates neighborhood
- Sanborn Estates neighborhood
- Sanborn Place South Estates neighborhood
- Sanborn Terrace neighborhood
- Sandpiper Estates neighborhood
- Shankar Village neighborhood
- Siena Estates neighborhood
- Skyview Place neighborhood
- Somerset Estates neighborhood
- Sontegate Village neighborhood
- Stonegate Village neighborhood
- Strachan Industrial neighborhood
- Suburban Acres neighborhood
- Summerfield neighborhood
- Sun Valley neighborhood
- Sunrise Village neighborhood
- Sunset Acres neighborhood
- Sutter Buttes Market Place neighborhood
- Sutter Cottages neighborhood
- Tanglewood neighborhood
- Tara Estates neighborhood
- Teal Hollow neighborhood
- Teja Buena neighborhood
- Temple Village Estates neighborhood
- Terra Buena Villa neighborhood
- Tierra Del Sol neighborhood
- Victoria Estates neighborhood
- Village West neighborhood
- Walnut Park Estates neighborhood
- Walton Ave Business Park neighborhood
- Walton Heights neighborhood
- Walton Park Estates neighborhood
- Walton Ranch neighborhood
- Walton Station neighborhood
- Warren Estates neighborhood
- Westbridge Condominiums neighborhood
- Westgate Estates neighborhood
- Westranch neighborhood
- Westridge neighborhood
- Westwind neighborhood
- Wildewood West neighborhood
- Woodridge Estates neighborhood
- Woodside Village neighborhood
- Yuba City Industrial Park neighborhood
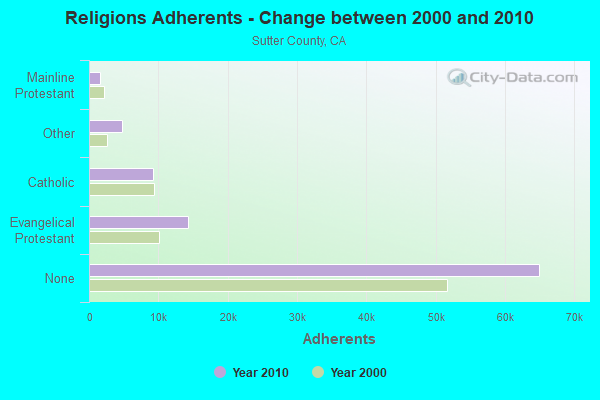
Religion statistics for Yuba City, CA (based on Sutter County data)
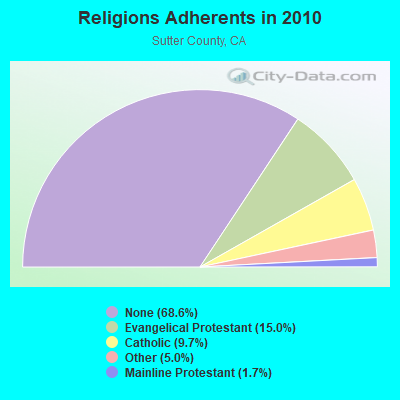
| Religion | Adherents | Congregations |
|---|---|---|
| Evangelical Protestant | 14,212 | 43 |
| Catholic | 9,181 | 3 |
| Other | 4,765 | 17 |
| Mainline Protestant | 1,624 | 7 |
| None | 64,955 | - |
Food Environment Statistics:
| Here: | 2.29 / 10,000 pop. |
| California: | 2.14 / 10,000 pop. |
| Sutter County: | 0.11 / 10,000 pop. |
| California: | 0.04 / 10,000 pop. |
| This county: | 1.42 / 10,000 pop. |
| California: | 0.62 / 10,000 pop. |
| Sutter County: | 2.08 / 10,000 pop. |
| California: | 1.49 / 10,000 pop. |
| Sutter County: | 6.66 / 10,000 pop. |
| California: | 7.42 / 10,000 pop. |
| Sutter County: | 7.4% |
| State: | 7.3% |
| Sutter County: | 24.5% |
| California: | 21.3% |
| This county: | 16.2% |
| California: | 17.9% |
Health and Nutrition:
| Yuba City: | 48.6% |
| California: | 49.4% |
| Here: | 46.3% |
| State: | 48.0% |
| Yuba City: | 28.2 |
| California: | 28.1 |
| This city: | 20.1% |
| California: | 20.2% |
| Here: | 11.4% |
| State: | 11.2% |
| Here: | 6.8 |
| California: | 6.8 |
| Yuba City: | 31.8% |
| California: | 31.5% |
| This city: | 55.6% |
| State: | 56.4% |
| Yuba City: | 79.9% |
| California: | 80.9% |
More about Health and Nutrition of Yuba City, CA Residents
| Local government employment and payroll (March 2022) | |||||
| Function | Full-time employees | Monthly full-time payroll | Average yearly full-time wage | Part-time employees | Monthly part-time payroll |
|---|---|---|---|---|---|
| Police Protection - Officers | 68 | $728,006 | $128,472 | 0 | $0 |
| Firefighters | 48 | $545,403 | $136,351 | 0 | $0 |
| Sewerage | 33 | $220,430 | $80,156 | 0 | $0 |
| Other and Unallocable | 21 | $122,875 | $70,214 | 5 | $8,771 |
| Police - Other | 20 | $131,026 | $78,616 | 3 | $8,430 |
| Streets and Highways | 19 | $116,199 | $73,389 | 3 | $11,842 |
| Water Supply | 17 | $124,819 | $88,108 | 2 | $4,931 |
| Parks and Recreation | 16 | $93,332 | $69,999 | 44 | $22,555 |
| Financial Administration | 15 | $98,547 | $78,838 | 3 | $5,340 |
| Other Government Administration | 15 | $77,852 | $62,282 | 2 | $1,574 |
| Health | 9 | $78,607 | $104,809 | 4 | $5,049 |
| Fire - Other | 3 | $18,717 | $74,868 | 0 | $0 |
| Totals for Government | 284 | $2,355,814 | $99,541 | 66 | $68,491 |
Yuba City government finances - Expenditure in 2017 (per resident):
- Construction - Sewerage: $2,442,000 ($35.38)
Housing and Community Development: $2,436,000 ($35.30)
Regular Highways: $1,731,000 ($25.08)
Water Utilities: $1,197,000 ($17.34)
General - Other: $214,000 ($3.10)
- Current Operations - Police Protection: $14,327,000 ($207.60)
Local Fire Protection: $11,185,000 ($162.07)
Sewerage: $9,003,000 ($130.45)
Water Utilities: $7,766,000 ($112.53)
Central Staff Services: $5,915,000 ($85.71)
Regular Highways: $5,562,000 ($80.59)
Parks and Recreation: $3,766,000 ($54.57)
Financial Administration: $1,498,000 ($21.71)
Protective Inspection and Regulation - Other: $1,414,000 ($20.49)
Health - Other: $701,000 ($10.16)
- General - Interest on Debt: $1,018,000 ($14.75)
- Other Capital Outlay - Sewerage: $1,987,000 ($28.79)
Water Utilities: $1,947,000 ($28.21)
Local Fire Protection: $1,001,000 ($14.50)
Parks and Recreation: $676,000 ($9.80)
General - Other: $300,000 ($4.35)
- Water Utilities - Interest on Debt: $1,105,000 ($16.01)
Yuba City government finances - Revenue in 2017 (per resident):
- Charges - Sewerage: $13,779,000 ($199.66)
Other: $3,772,000 ($54.66)
Parks and Recreation: $992,000 ($14.37)
Regular Highways: $323,000 ($4.68)
- Federal Intergovernmental - Other: $4,576,000 ($66.31)
Housing and Community Development: $893,000 ($12.94)
- Miscellaneous - General Revenue - Other: $6,950,000 ($100.70)
Special Assessments: $2,549,000 ($36.93)
Interest Earnings: $478,000 ($6.93)
Fines and Forfeits: $242,000 ($3.51)
Rents: $70,000 ($1.01)
Sale of Property: $27,000 ($0.39)
- Revenue - Water Utilities: $12,522,000 ($181.44)
- State Intergovernmental - Highways: $1,322,000 ($19.16)
Other: $769,000 ($11.14)
General Local Government Support: $85,000 ($1.23)
Water Utilities: $13,000 ($0.19)
Sewerage: $9,000 ($0.13)
- Tax - General Sales and Gross Receipts: $14,492,000 ($209.99)
Property: $11,602,000 ($168.11)
Public Utilities Sales: $2,149,000 ($31.14)
Other License: $1,364,000 ($19.76)
Other Selective Sales: $987,000 ($14.30)
Occupation and Business License - Other: $908,000 ($13.16)
Documentary and Stock Transfer: $179,000 ($2.59)
Yuba City government finances - Debt in 2017 (per resident):
- Long Term Debt - Outstanding Unspecified Public Purpose: $100,624,000 ($1458.02)
Beginning Outstanding - Unspecified Public Purpose: $90,621,000 ($1313.08)
Issue, Unspecified Public Purpose: $15,764,000 ($228.42)
Retired Unspecified Public Purpose: $5,761,000 ($83.48)
Yuba City government finances - Cash and Securities in 2017 (per resident):
- Bond Funds - Cash and Securities: $21,476,000 ($311.18)
- Other Funds - Cash and Securities: $65,397,000 ($947.59)
- Sinking Funds - Cash and Securities: $1,000 ($0.01)
| Businesses in Yuba City, CA | ||||
| Name | Count | Name | Count | |
|---|---|---|---|---|
| 7-Eleven | 5 | Kohl's | 1 | |
| 99 Cents Only Stores | 1 | Kroger | 5 | |
| AT&T | 2 | La-Z-Boy | 1 | |
| American Eagle Outfitters | 1 | Lane Furniture | 3 | |
| Applebee's | 1 | Little Caesars Pizza | 2 | |
| AutoZone | 1 | Long John Silver's | 1 | |
| Baskin-Robbins | 1 | Lowe's | 1 | |
| Bath & Body Works | 1 | Marshalls | 1 | |
| Bed Bath & Beyond | 1 | Mazda | 1 | |
| Best Western | 1 | McDonald's | 4 | |
| Blockbuster | 1 | New Balance | 1 | |
| Burger King | 2 | Nike | 8 | |
| CVS | 1 | Office Depot | 1 | |
| Carl\s Jr. | 2 | Pac Sun | 1 | |
| Chevrolet | 1 | Payless | 3 | |
| Chipotle | 1 | Penske | 1 | |
| Circle K | 2 | PetSmart | 1 | |
| Curves | 1 | Pier 1 Imports | 1 | |
| DHL | 2 | Pizza Hut | 1 | |
| Dairy Queen | 1 | Quality | 1 | |
| Days Inn | 1 | Quiznos | 2 | |
| Domino's Pizza | 1 | RadioShack | 2 | |
| Econo Lodge | 1 | Red Robin | 1 | |
| Famous Footwear | 1 | Rite Aid | 1 | |
| Fashion Bug | 1 | Rue21 | 1 | |
| FedEx | 7 | SONIC Drive-In | 1 | |
| Finish Line | 1 | Sam's Club | 1 | |
| Foot Locker | 1 | Sears | 2 | |
| Ford | 1 | Spencer Gifts | 1 | |
| Forever 21 | 1 | Sprint Nextel | 2 | |
| GNC | 1 | Staples | 1 | |
| GameStop | 2 | Starbucks | 6 | |
| Goodwill | 8 | Subway | 4 | |
| H&R Block | 1 | T-Mobile | 4 | |
| Hilton | 1 | Taco Bell | 2 | |
| Home Depot | 1 | Target | 1 | |
| HomeTown Buffet | 1 | Toyota | 1 | |
| Honda | 1 | Toys"R"Us | 1 | |
| Hot Topic | 1 | True Value | 1 | |
| IHOP | 1 | U-Haul | 2 | |
| JCPenney | 1 | UPS | 12 | |
| Jamba Juice | 1 | Vans | 3 | |
| Jones New York | 2 | Verizon Wireless | 2 | |
| Journeys | 1 | Walgreens | 3 | |
| KFC | 1 | Walmart | 1 | |
| Kmart | 1 | Wendy's | 1 | |
Strongest AM radio stations in Yuba City:
- KOBO (1450 AM; 1 kW; YUBA CITY, CA; Owner: MULTICULTURAL RADIO BROADCASTING INC)
- KUBA (1600 AM; 5 kW; YUBA CITY, CA; Owner: HARLAN COMMUNICATIONS, INC.)
- KMYC (1410 AM; 5 kW; MARYSVILLE, CA; Owner: THOMAS F. HUTH)
- KFBK (1530 AM; 50 kW; SACRAMENTO, CA; Owner: AMFM RADIO LICENSES, L.L.C.)
- KFIA (710 AM; 25 kW; CARMICHAEL, CA; Owner: VISTA BROADCASTING INC.)
- KSTE (650 AM; 25 kW; RANCHO CORDOVA, CA; Owner: AMFM RADIO LICENSES, L.L.C.)
- KHTK (1140 AM; 50 kW; SACRAMENTO, CA; Owner: INFINITY RADIO SUBSIDIARY OPERATIONS INC.)
- KCBS (740 AM; 50 kW; SAN FRANCISCO, CA; Owner: INFINITY BROADCASTING OPERATIONS, INC.)
- KAHI (950 AM; 10 kW; AUBURN, CA; Owner: IHR EDUCATIONAL BROADCASTING)
- KLIB (1110 AM; 10 kW; ROSEVILLE, CA; Owner: WAY BROADCASTING, INC.)
- KCBC (770 AM; 50 kW; RIVERBANK, CA; Owner: KIERTRON, INC.)
- KTRB (860 AM; 50 kW; MODESTO, CA; Owner: PAPPAS RADIO OF CALIFORNIA, A CALIFORNIA LIMITED PARTNERSHIP)
- KKOH (780 AM; 50 kW; RENO, NV; Owner: CITADEL BROADCASTING COMPANY)
Strongest FM radio stations in Yuba City:
- KRCX-FM (99.9 FM; MARYSVILLE, CA; Owner: ENTRAVISION HOLDINGS, LLC)
- KMJE (101.5 FM; GRIDLEY, CA; Owner: RESULTS RADIO LICENSEE, LLC)
- K213BZ (90.5 FM; RICHVALE, CA; Owner: FAMILY STATIONS, INC.)
- KXCL (103.9 FM; YUBA CITY, CA; Owner: HARLAN COMMUNICATIONS, INC.)
- KKCY (103.1 FM; COLUSA, CA; Owner: RESULTS RADIO LICENSEE, LLC)
- K258AQ (99.5 FM; YANKEE HILL, CA; Owner: CALVARY CHAPEL OF TWIN FALLS, INC.)
- KYIX (104.9 FM; SOUTH OROVILLE, CA; Owner: BUTTE BROADCASTING COMPANY, INC.)
- KHHZ (97.7 FM; OROVILLE, CA; Owner: CLEAR CHANNEL BROADCASTING LICENSES, INC.)
- KHAP (89.1 FM; CHICO, CA; Owner: FAMILY STATIONS, INC.)
- KNDL (89.9 FM; ANGWIN, CA; Owner: HOWELL MOUNTAIN BROADCASTING COMPANY)
- KLVR (91.9 FM; SANTA ROSA, CA; Owner: EDUCATIONAL MEDIA FOUNDATION)
- KXTS (100.9 FM; CALISTOGA, CA; Owner: SINCLAIR TELECABLE, INC.)
- KBBF (89.1 FM; SANTA ROSA, CA; Owner: BILINGUAL B/CING. FOUNDATION, INC.)
- K284AG (104.7 FM; WOODLAND, CA; Owner: EDUCATIONAL MEDIA FOUNDATION)
- KHGQ (100.3 FM; QUINCY, CA; Owner: KEILY MILLER)
- KVMR (89.5 FM; NEVADA CITY, CA; Owner: NEVADA CITY COMMUNITY BROADCAST GRUP)
- KUIC (95.3 FM; VACAVILLE, CA; Owner: KUIC, INC.)
- KLVS (99.3 FM; GRASS VALLEY, CA; Owner: EDUCATIONAL MEDIA FOUNDATION)
- KKFS (105.5 FM; DUNNIGAN, CA; Owner: CARON BROADCASTING, INC.)
- KNCO-FM (94.1 FM; GRASS VALLEY, CA; Owner: NEVADA COUNTY BROADCASTERS, INC.)
TV broadcast stations around Yuba City:
- KEZT-CA (Channel 23; SACRAMENTO, CA; Owner: TELEFUTURA SACRAMENTO LLC)
- KMMK-LP (Channel 14; SACRAMENTO, CA; Owner: CABALLERO TELEVISION TEXAS, L.L.C.)
- KSPX (Channel 29; SACRAMENTO, CA; Owner: PAXSON SACRAMENTO LICENSE, INC.)
- KTXL (Channel 40; SACRAMENTO, CA; Owner: CHANNEL 40, INC.)
- KOVR (Channel 13; STOCKTON, CA; Owner: SCI - SACRAMENTO LICENSEE, LLC)
- KXTV (Channel 10; SACRAMENTO, CA; Owner: KXTV, INC.)
- KQCA (Channel 58; STOCKTON, CA; Owner: KCRA HEARST-ARGYLE TELEVISION, INC.)
- KVIE (Channel 6; SACRAMENTO, CA; Owner: KVIE, INC.)
- KMAX-TV (Channel 31; SACRAMENTO, CA; Owner: UPN STATIONS GROUP INC.)
- K17EH (Channel 17; EUREKA, CA; Owner: MS COMMUNICATIONS, LLC)
- National Bridge Inventory (NBI) Statistics
- 34Number of bridges
- 928ft / 283mTotal length
- $802,000Total costs
- 479,383Total average daily traffic
- 22,090Total average daily truck traffic
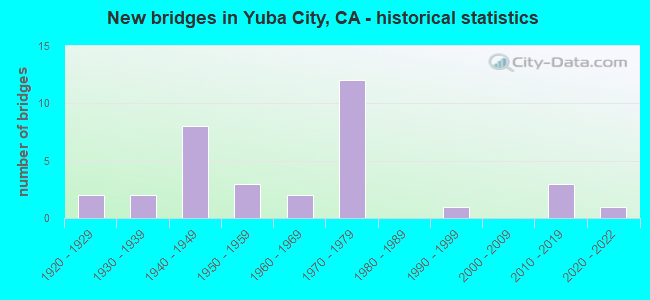
- New bridges - historical statistics
- 21920-1929
- 21930-1939
- 81940-1949
- 31950-1959
- 21960-1969
- 121970-1979
- 11990-1999
- 32010-2019
- 12020-2022
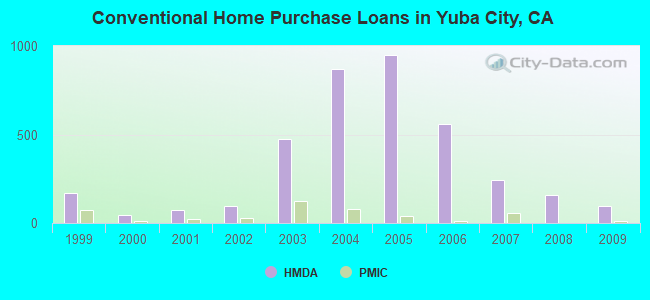
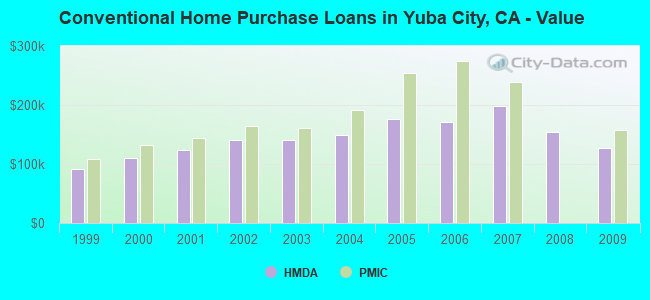
| Home Mortgage Disclosure Act Aggregated Statistics For Year 2009 (Based on 4 full and 6 partial tracts) | ||||||||||||
| A) FHA, FSA/RHS & VA Home Purchase Loans | B) Conventional Home Purchase Loans | C) Refinancings | D) Home Improvement Loans | E) Loans on Dwellings For 5+ Families | F) Non-occupant Loans on < 5 Family Dwellings (A B C & D) | |||||||
|---|---|---|---|---|---|---|---|---|---|---|---|---|
| Number | Average Value | Number | Average Value | Number | Average Value | Number | Average Value | Number | Average Value | Number | Average Value | |
| LOANS ORIGINATED | 133 | $151,697 | 97 | $127,353 | 193 | $161,495 | 10 | $154,600 | 1 | $310,000 | 56 | $94,742 |
| APPLICATIONS APPROVED, NOT ACCEPTED | 7 | $181,789 | 9 | $150,426 | 25 | $171,643 | 1 | $20,860 | 0 | $0 | 7 | $120,346 |
| APPLICATIONS DENIED | 16 | $150,716 | 15 | $136,362 | 105 | $185,232 | 7 | $63,460 | 2 | $1,700,000 | 16 | $116,365 |
| APPLICATIONS WITHDRAWN | 21 | $158,806 | 14 | $142,436 | 55 | $185,934 | 3 | $94,593 | 0 | $0 | 10 | $107,981 |
| FILES CLOSED FOR INCOMPLETENESS | 2 | $172,335 | 3 | $140,940 | 16 | $179,792 | 3 | $212,230 | 0 | $0 | 1 | $132,270 |
Detailed mortgage data for all 10 tracts in Yuba City, CA
| Private Mortgage Insurance Companies Aggregated Statistics For Year 2009 (Based on 3 full and 6 partial tracts) | ||||
| A) Conventional Home Purchase Loans | B) Refinancings | |||
|---|---|---|---|---|
| Number | Average Value | Number | Average Value | |
| LOANS ORIGINATED | 13 | $157,845 | 1 | $210,330 |
| APPLICATIONS APPROVED, NOT ACCEPTED | 5 | $136,222 | 1 | $346,830 |
| APPLICATIONS DENIED | 3 | $202,277 | 0 | $0 |
| APPLICATIONS WITHDRAWN | 1 | $157,520 | 1 | $67,930 |
| FILES CLOSED FOR INCOMPLETENESS | 0 | $0 | 0 | $0 |
2005 - 2018 National Fire Incident Reporting System (NFIRS) incidents
- Fire incident types reported to NFIRS in Yuba City, CA
- 1,89845.7%Outside Fires
- 1,41134.0%Structure Fires
- 58414.1%Mobile Property/Vehicle Fires
- 2566.2%Other
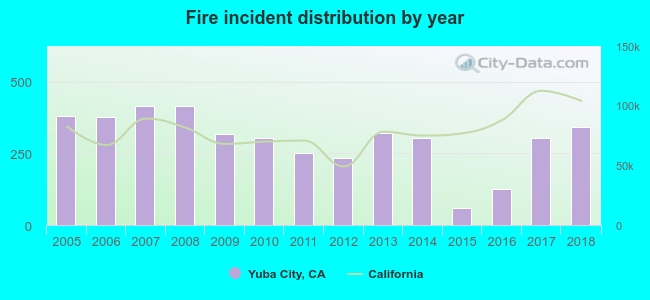 According to the data from the years 2005 - 2018 the average number of fires per year is 296. The highest number of reported fire incidents - 416 took place in 2008, and the least - 61 in 2015. The data has a dropping trend.
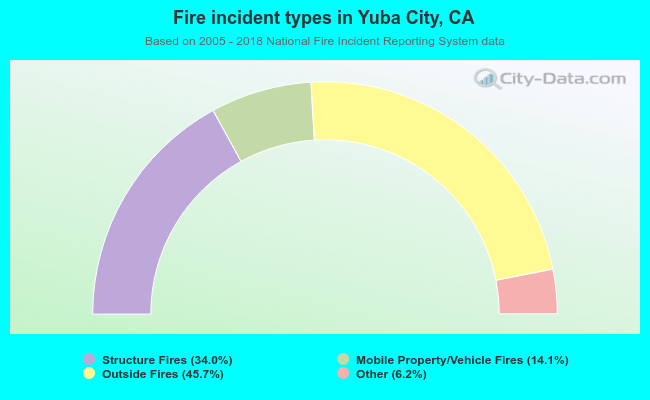 When looking into fire subcategories, the most incidents belonged to: Outside Fires (45.7%), and Structure Fires (34.0%).
Fire-safe hotels and motels in Yuba City, California:
- Bonanza Inn Magnuson Grand Hotel, Restaurant & Convention Center, 1001 Clark Ave, Yuba City, California 95991 , Phone: (530) 674-8824, Fax: (530) 674-0563
- Econo Lodge Yuba City, 730 N Palora Ave, Yuba City, California 95991 , Phone: (530) 674-1592, Fax: (530) 674-3032
- Best Western Yuba City Inn, 894 W Onstott Rd, Yuba City, California 95993 , Phone: (530) 674-1650, Fax: (916) 674-1266
- Knights Inn, 545 Colusa Ave, Yuba City, California 95991 , Phone: (530) 671-1151, Fax: (530) 673-8189
- Hampton Inn & Suites, 1375 Sunsweet Blvd, Yuba City, California 95991 , Phone: (530) 751-1714, Fax: (530) 751-2889
- Lexington Inn & Suites, 4228 South Hwy 99, Yuba City, California 95991 , Phone: (530) 674-0201, Fax: (530) 671-5758
- Travelodge, 965 Gray Ave, Yuba City, California 95991 , Phone: (530) 790-7066, Fax: (530) 673-0168
| Most common first names in Yuba City, CA among deceased individuals | ||
| Name | Count | Lived (average) |
|---|---|---|
| John | 282 | 75.2 years |
| Mary | 225 | 80.1 years |
| William | 224 | 75.5 years |
| Robert | 217 | 70.1 years |
| James | 207 | 71.3 years |
| Charles | 174 | 74.5 years |
| George | 148 | 76.4 years |
| Dorothy | 105 | 78.4 years |
| Margaret | 99 | 80.9 years |
| Ruth | 97 | 79.2 years |
| Most common last names in Yuba City, CA among deceased individuals | ||
| Last name | Count | Lived (average) |
|---|---|---|
| Smith | 121 | 75.2 years |
| Johnson | 120 | 77.6 years |
| Singh | 104 | 75.6 years |
| Williams | 74 | 74.6 years |
| Davis | 70 | 72.0 years |
| Brown | 67 | 75.9 years |
| Jones | 58 | 72.8 years |
| Kaur | 55 | 77.3 years |
| Thompson | 43 | 75.2 years |
| Anderson | 43 | 73.3 years |
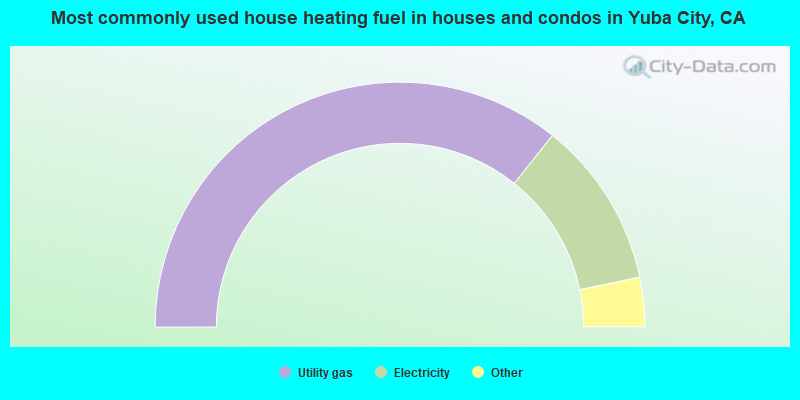
- 71.4%Utility gas
- 22.1%Electricity
- 2.4%Solar energy
- 1.8%Bottled, tank, or LP gas
- 1.2%Wood
- 0.9%No fuel used
- 0.2%Other fuel
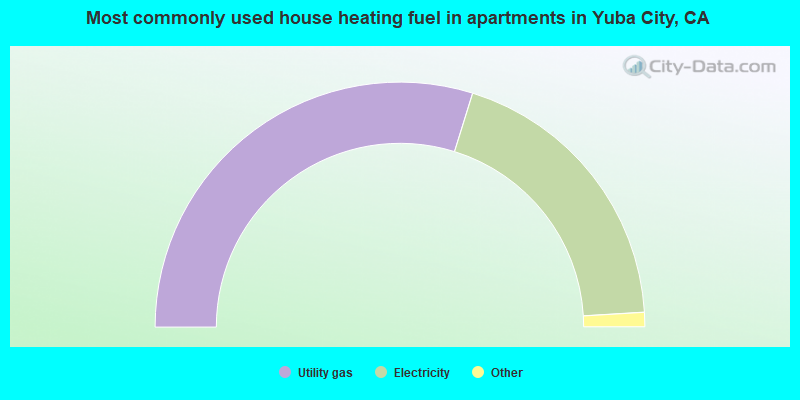
- 59.6%Utility gas
- 38.5%Electricity
- 0.6%Bottled, tank, or LP gas
- 0.6%Wood
- 0.6%No fuel used
- 0.1%Other fuel
Yuba City compared to California state average:
- Median household income below state average.
- Median house value below state average.
- Hispanic race population percentage above state average.
- Foreign-born population percentage above state average.
Yuba City on our top lists:
- #1 on the list of "Top 101 cities with largest percentage of males in occupations: healthcare support occupations (population 50,000+)"
- #8 on the list of "Top 101 cities with largest percentage of workers with very short commute times (9 minutes or less) (population 50,000+)"
- #13 on the list of "Top 101 cities with the least people having Doctorate degrees (population 50,000+)"
- #14 on the list of "Top 101 cities with largest percentage of females in occupations: farming, fishing, and forestry occupations (population 50,000+)"
- #19 on the list of "Top 101 cities with largest percentage of females in industries: agriculture, forestry, fishing and hunting (population 50,000+)"
- #23 on the list of "Top 101 cities with largest percentage of females in industries: construction (population 50,000+)"
- #24 on the list of "Top 101 cities with largest percentage of males in occupations: farming, fishing, and forestry occupations (population 50,000+)"
- #34 on the list of "Top 101 cities with largest percentage of males in industries: agriculture, forestry, fishing and hunting (population 50,000+)"
- #41 on the list of "Top 101 cities with the largest city-data.com crime index per police officer (population 50,000+)"
- #41 on the list of "Top 101 cities with the largest percentage population increase from 2000 (population 50,000+)"
- #49 on the list of "Top 101 cities with largest percentage of females in industries: administrative and support and waste management services (population 50,000+)"
- #52 on the list of "Top 101 cities with largest percentage of females in industries: other services, except public administration (population 50,000+)"
- #58 on the list of "Top 101 cities with the lowest number of police officers per 1000 residents (population 50,000+)"
- #59 on the list of "Top 101 cities with the least people having Master's or Doctorate degrees (population 50,000+)"
- #60 on the list of "Top 101 cities with largest percentage of females in occupations: education, training, and library occupations (population 50,000+)"
- #61 on the list of "Top 101 cities with the highest daily high temperatures (population 50,000+)"
- #62 on the list of "Top 101 cities with the most residents born in India (population 500+)"
- #62 on the list of "Top 100 fastest growing cities from 2000 to 2014 (pop. 50,000+)"
- #73 on the list of "Top 101 cities with largest percentage of males in industries: construction (population 50,000+)"
- #74 on the list of "Top 101 cities with largest percentage of females in occupations: production occupations (population 50,000+)"
- #3 on the list of "Top 101 counties with the highest Ozone (1-hour) air pollution readings in 2012 (ppm)"
- #34 on the list of "Top 101 counties with the highest Nitrogen Dioxide air pollution readings in 2012 (ppm)"
- #64 on the list of "Top 101 counties with the largest number of people moving out compared to moving in (pop. 50,000+)"
- #66 on the list of "Top 101 counties with the largest decrease in the number of deaths per 1000 residents 2000-2006 to 2007-2013 (pop. 50,000+)"
- #92 on the list of "Top 101 counties with the lowest Particulate Matter (PM2.5) Annual air pollution readings in 2012 (µg/m3)"

|
|
Total of 52 patent applications in 2008-2024.