Races in Akron, Ohio (OH) Detailed Stats
Data:
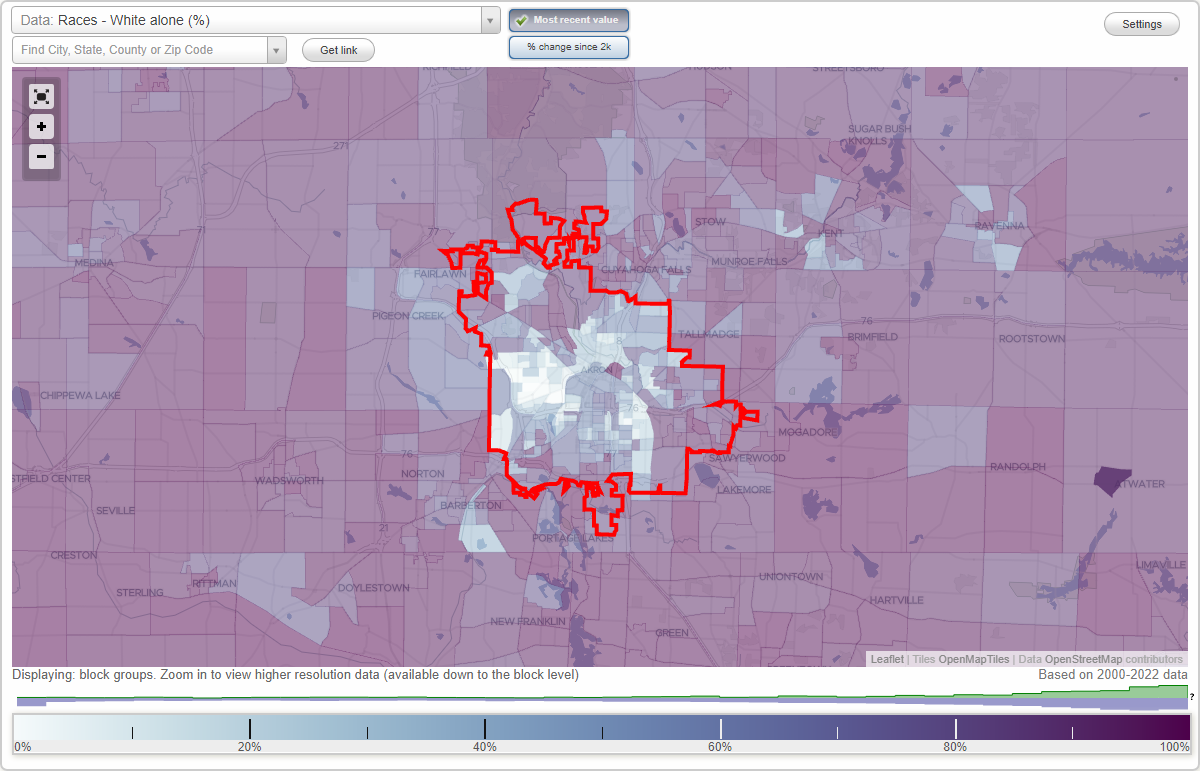
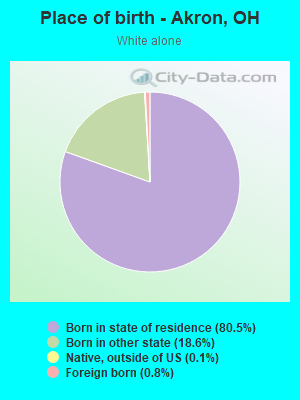
Races - White alone (%)
Races - White alone (% change since 2000)
Races - Black alone (%)
Races - Black alone (% change since 2000)
Races - American Indian alone (%)
Races - American Indian alone (% change since 2000)
Races - Asian alone (%)
Races - Asian alone (% change since 2000)
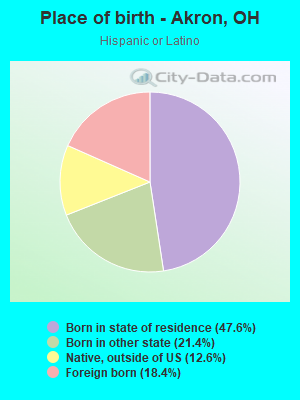
Races - Hispanic (%)
Races - Hispanic (% change since 2000)
Races - Native Hawaiian and Other Pacific Islander alone (%)
Races - Native Hawaiian and Other Pacific Islander alone (% change since 2000)
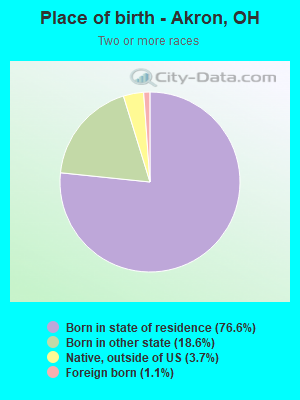
Races - Two or more races(%)
Races - Two or more races(% change since 2000)
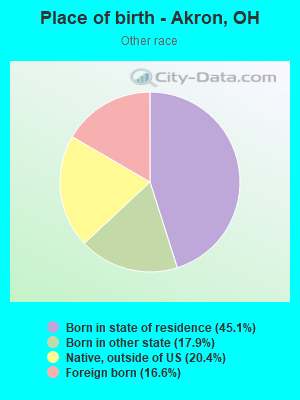
Races - Other race alone (%)
Races - Other race alone (% change since 2000)
Racial diversity
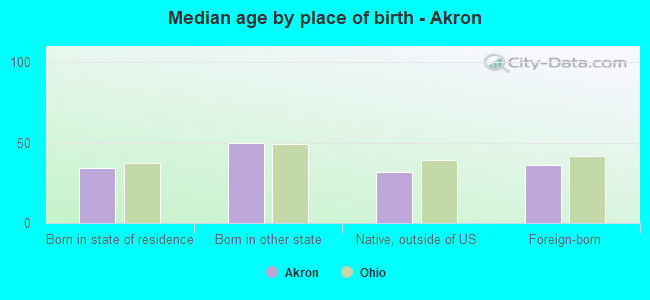
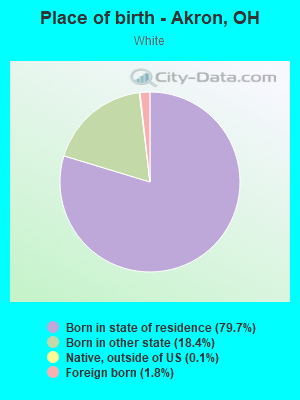
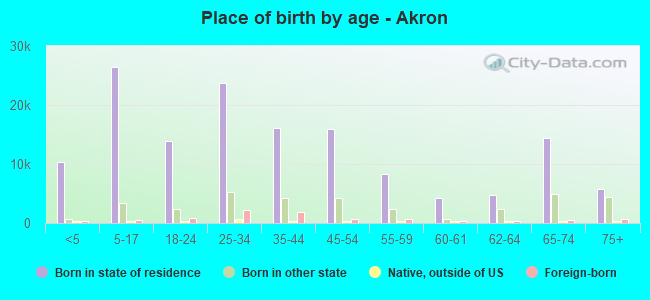
Place of birth - Born in state of residence (%)
Place of birth - Born in state of residence (%) - White
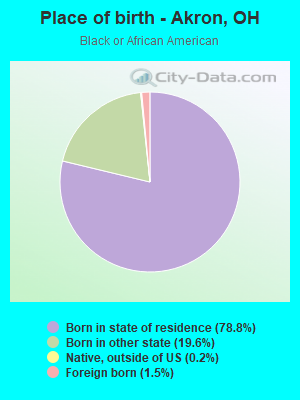
Place of birth - Born in state of residence (%) - Black or African American
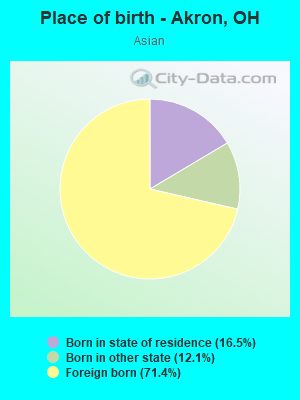
Place of birth - Born in state of residence (%) - Asian
Place of birth - Born in state of residence (%) - Hispanic or Latino
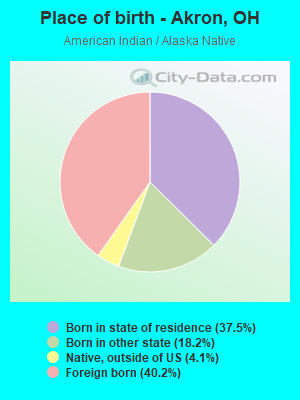
Place of birth - Born in state of residence (%) - American Indian and Alaska Native
Place of birth - Born in state of residence (%) - Multirace
Place of birth - Born in state of residence (%) - Other Race
Place of birth - Born in other state (%)
Place of birth - Born in other state (%) - White
Place of birth - Born in other state (%) - Black or African American
Place of birth - Born in other state (%) - Asian
Place of birth - Born in other state (%) - Hispanic or Latino
Place of birth - Born in other state (%) - American Indian and Alaska Native
Place of birth - Born in other state (%) - Multirace
Place of birth - Born in other state (%) - Other Race
Place of birth - Native, outside of US (%)
Place of birth - Native, outside of US (%) - White
Place of birth - Native, outside of US (%) - Black or African American
Place of birth - Native, outside of US (%) - Asian
Place of birth - Native, outside of US (%) - Hispanic or Latino
Place of birth - Native, outside of US (%) - American Indian and Alaska Native
Place of birth - Native, outside of US (%) - Multirace
Place of birth - Native, outside of US (%) - Other Race
Place of birth - Foreign born (%)
Place of birth - Foreign born (%) - White
Place of birth - Foreign born (%) - Black or African American
Place of birth - Foreign born (%) - Asian
Place of birth - Foreign born (%) - Hispanic or Latino
Place of birth - Foreign born (%) - American Indian and Alaska Native
Place of birth - Foreign born (%) - Multirace
Place of birth - Foreign born (%) - Other Race
Residents speaking English at home (%)
Residents speaking English at home - Born in the United States (%)
Residents speaking English at home - Native, born elsewhere (%)
Residents speaking English at home - Foreign born (%)
Residents speaking Spanish at home (%)
Residents speaking Spanish at home - Born in the United States (%)
Residents speaking Spanish at home - Native, born elsewhere (%)
Residents speaking Spanish at home - Foreign born (%)
Residents speaking other language at home (%)
Residents speaking other language at home - Born in the United States (%)
Residents speaking other language at home - Native, born elsewhere (%)
Residents speaking other language at home - Foreign born (%)
Marital status - Never married (%)
Marital status - Now married (%)
Marital status - Separated (%)
Marital status - Widowed (%)
Marital status - Divorced (%)
Ancestries Reported - Arab (%)
Ancestries Reported - Czech (%)
Ancestries Reported - Danish (%)
Ancestries Reported - Dutch (%)
Ancestries Reported - English (%)
Ancestries Reported - French (%)
Ancestries Reported - French Canadian (%)
Ancestries Reported - German (%)
Ancestries Reported - Greek (%)
Ancestries Reported - Hungarian (%)
Ancestries Reported - Irish (%)
Ancestries Reported - Italian (%)
Ancestries Reported - Lithuanian (%)
Ancestries Reported - Norwegian (%)
Ancestries Reported - Polish (%)
Ancestries Reported - Portuguese (%)
Ancestries Reported - Russian (%)
Ancestries Reported - Scotch-Irish (%)
Ancestries Reported - Scottish (%)
Ancestries Reported - Slovak (%)
Ancestries Reported - Subsaharan African (%)
Ancestries Reported - Swedish (%)
Ancestries Reported - Swiss (%)
Ancestries Reported - Ukrainian (%)
Ancestries Reported - United States (%)
Ancestries Reported - Welsh (%)
Ancestries Reported - West Indian (%)
Ancestries Reported - Other (%)
Geographical mobility - Same house 1 year ago (%)
Geographical mobility - Same house 1 year ago (%) - White
Geographical mobility - Same house 1 year ago (%) - Black or African American
Geographical mobility - Same house 1 year ago (%) - Asian
Geographical mobility - Same house 1 year ago (%) - Hispanic or Latino
Geographical mobility - Same house 1 year ago (%) - American Indian and Alaska Native
Geographical mobility - Same house 1 year ago (%) - Multirace
Geographical mobility - Same house 1 year ago (%) - Other Race
Geographical mobility - Moved within same county (%)
Geographical mobility - Moved within same county (%) - White
Geographical mobility - Moved within same county (%) - Black or African American
Geographical mobility - Moved within same county (%) - Asian
Geographical mobility - Moved within same county (%) - Hispanic or Latino
Geographical mobility - Moved within same county (%) - American Indian and Alaska Native
Geographical mobility - Moved within same county (%) - Multirace
Geographical mobility - Moved within same county (%) - Other Race
Geographical mobility - Moved from different county within same state (%)
Geographical mobility - Moved from different county within same state (%) - White
Geographical mobility - Moved from different county within same state (%) - Black or African American
Geographical mobility - Moved from different county within same state (%) - Asian
Geographical mobility - Moved from different county within same state (%) - Hispanic or Latino
Geographical mobility - Moved from different county within same state (%) - American Indian and Alaska Native
Geographical mobility - Moved from different county within same state (%) - Multirace
Geographical mobility - Moved from different county within same state (%) - Other Race
Geographical mobility - Moved from different state (%)
Geographical mobility - Moved from different state (%) - White
Geographical mobility - Moved from different state (%) - Black or African American
Geographical mobility - Moved from different state (%) - Asian
Geographical mobility - Moved from different state (%) - Hispanic or Latino
Geographical mobility - Moved from different state (%) - American Indian and Alaska Native
Geographical mobility - Moved from different state (%) - Multirace
Geographical mobility - Moved from different state (%) - Other Race
Geographical mobility - Moved from abroad (%)
Geographical mobility - Moved from abroad (%) - White
Geographical mobility - Moved from abroad (%) - Black or African American
Geographical mobility - Moved from abroad (%) - Asian
Geographical mobility - Moved from abroad (%) - Hispanic or Latino
Geographical mobility - Moved from abroad (%) - American Indian and Alaska Native
Geographical mobility - Moved from abroad (%) - Multirace
Geographical mobility - Moved from abroad (%) - Other Race
Place of birth for the foreign-born population - Ireland (%)
Place of birth for the foreign-born population - Denmark (%)
Place of birth for the foreign-born population - Norway (%)
Place of birth for the foreign-born population - Sweden (%)
Place of birth for the foreign-born population - United Kingdom (%)
Place of birth for the foreign-born population - England (%)
Place of birth for the foreign-born population - Scotland (%)
Place of birth for the foreign-born population - Other Northern Europe (%)
Place of birth for the foreign-born population - Austria (%)
Place of birth for the foreign-born population - Belgium (%)
Place of birth for the foreign-born population - France (%)
Place of birth for the foreign-born population - Germany (%)
Place of birth for the foreign-born population - Netherlands (%)
Place of birth for the foreign-born population - Switzerland (%)
Place of birth for the foreign-born population - Other Western Europe (%)
Place of birth for the foreign-born population - Greece (%)
Place of birth for the foreign-born population - Italy (%)
Place of birth for the foreign-born population - Portugal (%)
Place of birth for the foreign-born population - Spain (%)
Place of birth for the foreign-born population - Other Southern Europe (%)
Place of birth for the foreign-born population - Albania (%)
Place of birth for the foreign-born population - Belarus (%)
Place of birth for the foreign-born population - Bosnia and Herzegovina (%)
Place of birth for the foreign-born population - Bulgaria (%)
Place of birth for the foreign-born population - Croatia (%)
Place of birth for the foreign-born population - Czechoslovakia (%)
Place of birth for the foreign-born population - Hungary (%)
Place of birth for the foreign-born population - Latvia (%)
Place of birth for the foreign-born population - Lithuania (%)
Place of birth for the foreign-born population - North Macedonia (Macedonia) (%)
Place of birth for the foreign-born population - Moldova (%)
Place of birth for the foreign-born population - Poland (%)
Place of birth for the foreign-born population - Romania (%)
Place of birth for the foreign-born population - Russia (%)
Place of birth for the foreign-born population - Serbia (%)
Place of birth for the foreign-born population - Ukraine (%)
Place of birth for the foreign-born population - Other Eastern Europe (%)
Place of birth for the foreign-born population - China (%)
Place of birth for the foreign-born population - Hong Kong (%)
Place of birth for the foreign-born population - Taiwan (%)
Place of birth for the foreign-born population - Japan (%)
Place of birth for the foreign-born population - Korea (%)
Place of birth for the foreign-born population - Other Eastern Asia (%)
Place of birth for the foreign-born population - Afghanistan (%)
Place of birth for the foreign-born population - Bangladesh (%)
Place of birth for the foreign-born population - India (%)
Place of birth for the foreign-born population - Iran (%)
Place of birth for the foreign-born population - Kazakhstan (%)
Place of birth for the foreign-born population - Nepal (%)
Place of birth for the foreign-born population - Pakistan (%)
Place of birth for the foreign-born population - Sri Lanka (%)
Place of birth for the foreign-born population - Uzbekistan (%)
Place of birth for the foreign-born population - Other South Central Asia (%)
Place of birth for the foreign-born population - Burma (%)
Place of birth for the foreign-born population - Cambodia (%)
Place of birth for the foreign-born population - Indonesia (%)
Place of birth for the foreign-born population - Laos (%)
Place of birth for the foreign-born population - Malaysia (%)
Place of birth for the foreign-born population - Philippines (%)
Place of birth for the foreign-born population - Singapore (%)
Place of birth for the foreign-born population - Thailand (%)
Place of birth for the foreign-born population - Vietnam (%)
Place of birth for the foreign-born population - Other South Eastern Asia (%)
Place of birth for the foreign-born population - Armenia (%)
Place of birth for the foreign-born population - Iraq (%)
Place of birth for the foreign-born population - Israel (%)
Place of birth for the foreign-born population - Jordan (%)
Place of birth for the foreign-born population - Kuwait (%)
Place of birth for the foreign-born population - Lebanon (%)
Place of birth for the foreign-born population - Saudi Arabia (%)
Place of birth for the foreign-born population - Syria (%)
Place of birth for the foreign-born population - Turkey (%)
Place of birth for the foreign-born population - Yemen (%)
Place of birth for the foreign-born population - Other Western Asia (%)
Place of birth for the foreign-born population - Eritrea (%)
Place of birth for the foreign-born population - Ethiopia (%)
Place of birth for the foreign-born population - Kenya (%)
Place of birth for the foreign-born population - Somalia (%)
Place of birth for the foreign-born population - Uganda (%)
Place of birth for the foreign-born population - Zimbabwe (%)
Place of birth for the foreign-born population - Other Eastern Africa (%)
Place of birth for the foreign-born population - Cameroon (%)
Place of birth for the foreign-born population - Congo (%)
Place of birth for the foreign-born population - Democratic Republic of Congo (Zaire) (%)
Place of birth for the foreign-born population - Other Middle Africa (%)
Place of birth for the foreign-born population - Egypt (%)
Place of birth for the foreign-born population - Morocco (%)
Place of birth for the foreign-born population - Sudan (%)
Place of birth for the foreign-born population - Other Northern Africa (%)
Place of birth for the foreign-born population - South Africa (%)
Place of birth for the foreign-born population - Other Southern Africa (%)
Place of birth for the foreign-born population - Cabo Verde (%)
Place of birth for the foreign-born population - Ghana (%)
Place of birth for the foreign-born population - Liberia (%)
Place of birth for the foreign-born population - Nigeria (%)
Place of birth for the foreign-born population - Senegal (%)
Place of birth for the foreign-born population - Sierra Leone (%)
Place of birth for the foreign-born population - Other Western Africa (%)
Place of birth for the foreign-born population - Australia (%)
Place of birth for the foreign-born population - New Zealand (%)
Place of birth for the foreign-born population - Fiji (%)
Place of birth for the foreign-born population - Micronesia (%)
Place of birth for the foreign-born population - Bahamas (%)
Place of birth for the foreign-born population - Barbados (%)
Place of birth for the foreign-born population - Cuba (%)
Place of birth for the foreign-born population - Dominica (%)
Place of birth for the foreign-born population - Dominican Republic (%)
Place of birth for the foreign-born population - Grenada (%)
Place of birth for the foreign-born population - Haiti (%)
Place of birth for the foreign-born population - Jamaica (%)
Place of birth for the foreign-born population - St. Vincent and the Grenadines (%)
Place of birth for the foreign-born population - Trinidad and Tobago (%)
Place of birth for the foreign-born population - West Indies (%)
Place of birth for the foreign-born population - Other Caribbean (%)
Place of birth for the foreign-born population - Belize (%)
Place of birth for the foreign-born population - Costa Rica (%)
Place of birth for the foreign-born population - El Salvador (%)
Place of birth for the foreign-born population - Guatemala (%)
Place of birth for the foreign-born population - Honduras (%)
Place of birth for the foreign-born population - Mexico (%)
Place of birth for the foreign-born population - Nicaragua (%)
Place of birth for the foreign-born population - Panama (%)
Place of birth for the foreign-born population - Other Central America (%)
Place of birth for the foreign-born population - Argentina (%)
Place of birth for the foreign-born population - Bolivia (%)
Place of birth for the foreign-born population - Brazil (%)
Place of birth for the foreign-born population - Chile (%)
Place of birth for the foreign-born population - Colombia (%)
Place of birth for the foreign-born population - Ecuador (%)
Place of birth for the foreign-born population - Guyana (%)
Place of birth for the foreign-born population - Peru (%)
Place of birth for the foreign-born population - Uruguay (%)
Place of birth for the foreign-born population - Venezuela (%)
Place of birth for the foreign-born population - Other South America (%)
Place of birth for the foreign-born population - Canada (%)
Place of birth for the foreign-born population - Other Northern America (%)
Place of birth for the foreign-born population - Other (%)
Latest news about races in Akron, OH collected exclusively by city-data.com from local newspapers, TV, and radio stations
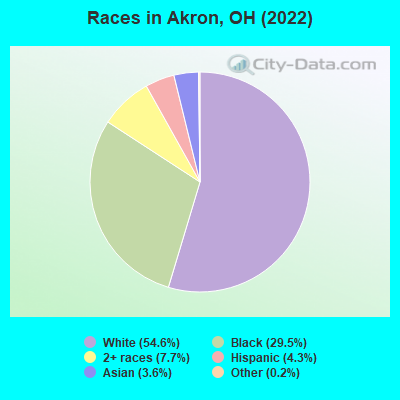
According to 2022 data, the most numerous races in Akron, OH are White alone (102,945 residents), Black alone (55,635 residents), and Two or more races (14,422 residents). 93.3% of Akron residents speak English at home. 6.4% of Akron, OH residents are foreign-born (3.6% born in Asia, 1.0% born in Latin America, 0.8% born in Africa), which is 37.3% greater than the foreign-born rate of 4.0% across the entire state of Ohio.
Race distribution in Akron
2000 2022
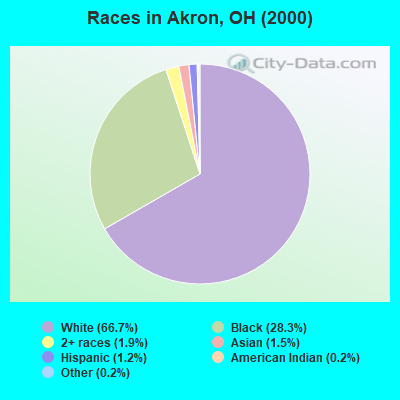
144,719 66.7% White alone 61,510 28.3% Black alone 4,169 1.9% Two or more races 3,232 1.5% Asian alone 2,513 1.2% Hispanic 365 0.2% Other race alone 526 0.2% American Indian alone 40 0.02% Native Hawaiian and Other
102,945 54.6% White alone 55,635 29.5% Black alone 14,422 7.7% Two or more races 8,052 4.3% Hispanic 6,868 3.6% Asian alone 412 0.2% Other race alone 164 0.09% American Indian alone
2000 2022
9,538,111 84.0% White alone 1,290,662 11.4% Black alone 217,123 1.9% Hispanic 137,770 1.2% Two or more races 131,670 1.2% Asian alone 21,985 0.2% American Indian alone 13,483 0.1% Other race alone 2,336 0.02% Native Hawaiian and Other
8,948,793 76.1% White alone 1,401,403 11.9% Black alone 529,291 4.5% Two or more races 517,232 4.4% Hispanic 293,387 2.5% Asian alone 52,805 0.4% Other race alone 9,785 0.08% American Indian alone 3,362 0.03% Native Hawaiian and Other
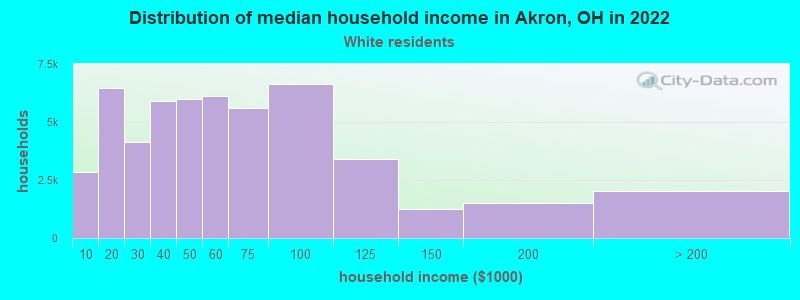
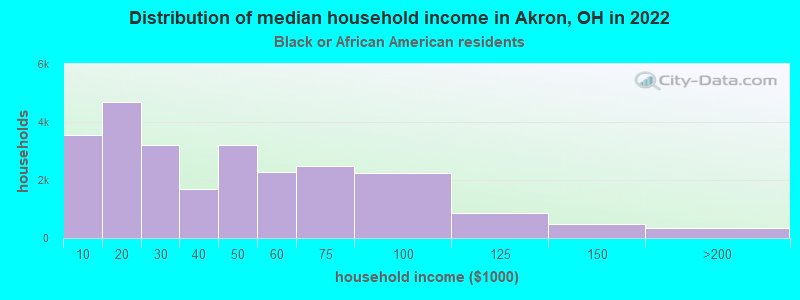
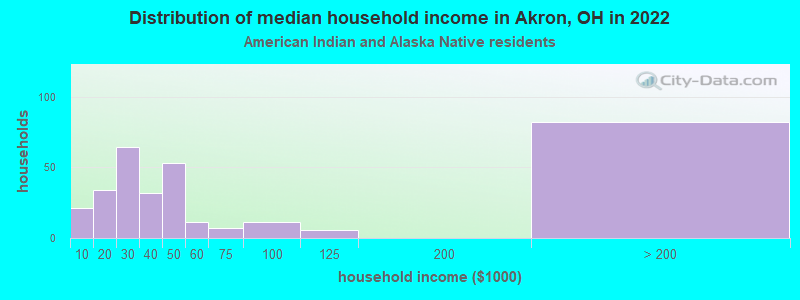
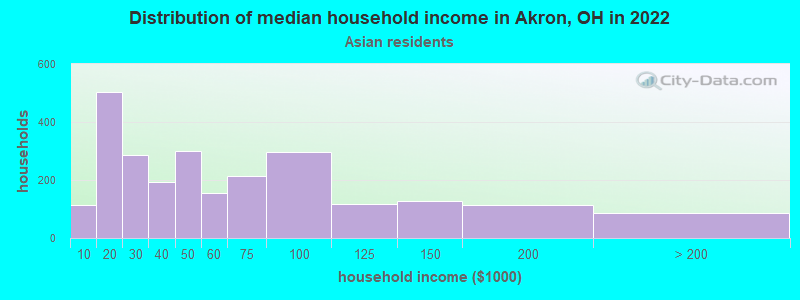
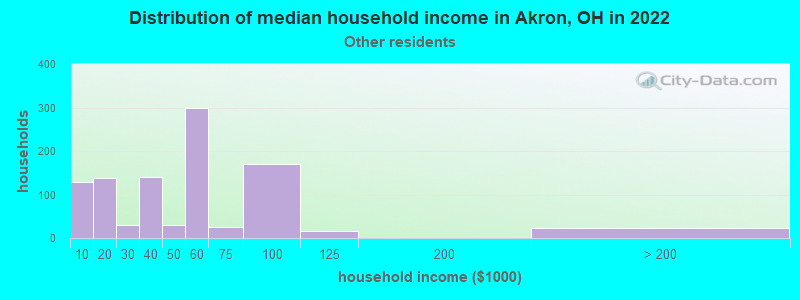
Income and house value in Akron Median household income in 2022 $50,750 White non-Hispanic householders$37,098 Black householders$26,544 American Indian and Alaska Native householders$42,644 Asian householders$41,109 Some other race householders$40,692 Two or more races householders$52,543 Hispanic or Latino race householdersMedian 2022 house value $116,928 White Non-Hispanic householders$95,575 Black or African American householders$101,613 American Indian or Alaska Native householders $138,576 Asian householders$260,365 Native Hawaiian and other Pacific Islander householders$99,846 Some other race householders$103,085 Two or more races householders$122,525 Hispanic or Latino householders
Median age by race in Akron
41.4 Median age for White residents39.5 43.9 34.2 Median age for Black or African American residents33.5 35.7 29.7 Median age for American Indian / Alaska Native residents29.6 29.8 27.8 Median age for Asian residents27.7 33.1 -666,666,666.0 Median age for Native Hawaiian / Pacific Islander residents-666,666,666.0 -666,666,666.0 31.7 Median age for Other race residents27.8 43.5 23.2 Median age for Two or more races residents22.3 23.6 42.1 Median age for White alone residents39.7 44.5 29.1 Median age for Hispanic or Latino residents26.0 29.8
Owner/renter occupied households by race in Akron
House owners and renters - White residents 32,063 61.7% Owner occupied19,915 38.3% Renter occupiedHouse owners and renters - Black or African American residents 9,277 37.0% Owner occupied15,778 63.0% Renter occupiedHouse owners and renters - American Indian / Alaska Native residents 140 50.9% Owner occupied136 49.1% Renter occupiedHouse owners and renters - Asian residents 623 29.2% Owner occupied1,509 70.8% Renter occupiedHouse owners and renters - Native Hawaiian / Pacific Islander residents 16 100.0% Renter occupiedHouse owners and renters - Other race residents 322 47.9% Owner occupied350 52.1% Renter occupiedHouse owners and renters - Two or more races residents 1,446 27.1% Owner occupied3,883 72.9% Renter occupiedHouse owners and renters - White alone residents 31,761 61.8% Owner occupied19,629 38.2% Renter occupiedHouse owners and renters - Hispanic or Latino residents 951 43.7% Owner occupied1,225 56.3% Renter occupied
Language usage in Akron
English speakers - Total 93.3% of residents of Akron speak English at home.
2.6% of residents speak Spanish at home 2,146 47.5% Speak English very well2,376 52.5% Speak English less than very well4.2% of residents speak other language at home 2,885 39.2% Speak English very well4,473 60.8% Speak English less than very well
English speakers - Born in the United States 97.2% of residents of Akron speak English at home.
2.0% of residents speak Spanish at home 579 85.1% Speak English very well101 14.9% Speak English less than very well0.8% of residents speak other language at home 82 29.5% Speak English very well196 70.5% Speak English less than very well
English speakers - Native, born elsewhere 42.2% of residents of Akron speak English at home.
57.8% of residents speak Spanish at home 275 37.8% Speak English very well452 62.2% Speak English less than very well
English speakers - Foreign-born 8.8% of residents of Akron speak English at home.
16.8% of residents speak Spanish at home 211 15.3% Speak English very well1,164 84.7% Speak English less than very well74.3% of residents speak other language at home 1,949 32.1% Speak English very well4,118 67.9% Speak English less than very well
White (Caucasian) - Speak only English Native:
98.0% (97,422)Foreign-born:
16.5% (306)
White (Caucasian) - Speak another language Native:
2.0% (1,990)Foreign-born:
83.5% (1,552)
Black or African American - Speak only English Native:
99.0% (48,266)Foreign-born:
28.2% (307)
Black or African American - Speak another language Native:
1.0% (463)Foreign-born:
71.0% (772)
American Indian / Alaska Native - Speak only English Native:
64.3% (211)Foreign-born:
5.1% (12)
American Indian / Alaska Native - Speak another language Native:
38.6% (126)Foreign-born:
92.4% (220)
Asian - Speak only English Native:
62.2% (728)Foreign-born:
0.8% (37)
Asian - Speak another language Native:
37.8% (443)Foreign-born:
99.2% (4,894)
Other race - Speak only English Native:
58.4% (885)Foreign-born:
14.9% (76)
Other race - Speak another language Native:
41.5% (628)Foreign-born:
83.2% (427)
Two or more races - Speak only English Native:
96.4% (15,554)Foreign-born:
10.1% (44)
Two or more races - Speak another language Native:
3.7% (603)Foreign-born:
93.1% (408)
White alone - Speak only English Native:
98.4% (96,697)Foreign-born:
35.9% (306)
White alone - Speak another language Native:
1.6% (1,568)Foreign-born:
64.1% (546)
Hispanic or Latino - Speak only English Native:
68.8% (3,932)Foreign-born:
7.0% (103)
Hispanic or Latino - Speak another language Native:
31.2% (1,783)Foreign-born:
93.0% (1,375)
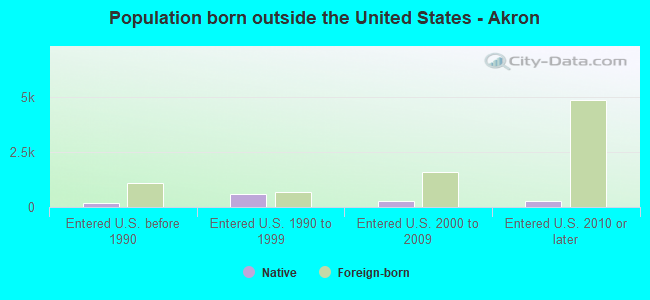
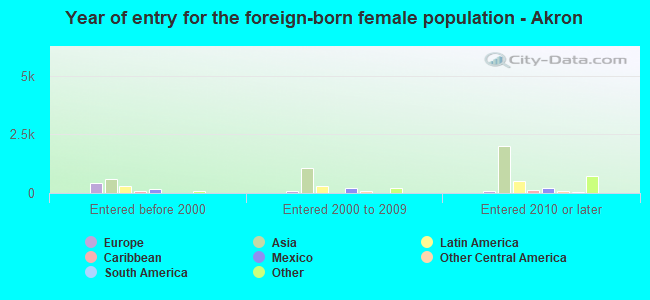
Foreign-born residents in Akron 12,065 residents are foreign born (3.6% Asia , 1.0% Latin America , 0.8% Africa ).
Marital status for residents in Akron Marital status - White (Caucasian) population 15 years and over
Males 47.0% Never married38.9% Now married0.1% Separated3.1% Widowed10.9% DivorcedFemales 33.9% Never married36.5% Now married2.1% Separated10.2% Widowed17.3% DivorcedWomen who gave birth in the past 12 months Now married:
51.5% (763)Unmarried:
48.5% (719)
Women who did not give birth in the past 12 months Now married:
33.9% (7,389)Unmarried:
66.1% (14,399)
Marital status - Black or African American population 15 years and over
Males 49.3% Never married31.0% Now married1.1% Separated2.7% Widowed15.8% DivorcedFemales 54.6% Never married18.4% Now married2.7% Separated8.4% Widowed15.8% DivorcedWomen who gave birth in the past 12 months Now married:
12.4% (230)Unmarried:
87.6% (1,622)
Women who did not give birth in the past 12 months Now married:
17.8% (2,316)Unmarried:
82.2% (10,661)
Marital status - American Indian / Alaska Native population 15 years and over
Males 64.6% Never married35.4% Now married0.0% Separated0.0% Widowed0.0% DivorcedFemales 44.7% Never married15.8% Now married0.0% Separated25.7% Widowed13.8% DivorcedWomen who gave birth in the past 12 months Now married:
0.0% (0)Unmarried:
100.0% (32)
Women who did not give birth in the past 12 months Now married:
48.3% (17)Unmarried:
51.7% (18)
Marital status - Asian population 15 years and over
Males 31.7% Never married55.4% Now married0.0% Separated0.0% Widowed12.9% DivorcedFemales 42.7% Never married44.2% Now married0.0% Separated4.6% Widowed8.6% DivorcedWomen who gave birth in the past 12 months Now married:
48.8% (111)Unmarried:
51.2% (116)
Women who did not give birth in the past 12 months Now married:
64.5% (1,756)Unmarried:
35.5% (965)
Marital status - Other race population 15 years and over
Males 45.4% Never married28.7% Now married5.9% Separated4.4% Widowed15.6% DivorcedFemales 51.6% Never married25.9% Now married0.0% Separated7.5% Widowed15.1% DivorcedWomen who gave birth in the past 12 months Now married:
0.0% (0)Unmarried:
100.0% (41)
Women who did not give birth in the past 12 months Now married:
32.9% (203)Unmarried:
67.1% (415)
Marital status - Two or more races population 15 years and over
Males 64.8% Never married18.9% Now married0.0% Separated1.6% Widowed14.8% DivorcedFemales 54.7% Never married21.2% Now married3.6% Separated8.3% Widowed12.2% DivorcedWomen who gave birth in the past 12 months Now married:
20.1% (37)Unmarried:
79.9% (148)
Women who did not give birth in the past 12 months Now married:
21.7% (965)Unmarried:
78.3% (3,492)
Marital status - White alone, not Hispanic / Latino population 15 years and over
Males 47.7% Never married38.1% Now married0.1% Separated3.1% Widowed11.0% DivorcedFemales 33.6% Never married36.2% Now married2.1% Separated10.4% Widowed17.7% DivorcedWomen who gave birth in the past 12 months Now married:
53.2% (763)Unmarried:
46.8% (672)
Women who did not give birth in the past 12 months Now married:
33.9% (7,184)Unmarried:
66.1% (14,004)
Marital status - Hispanic or Latino population 15 years and over
Males 55.3% Never married29.3% Now married4.9% Separated1.4% Widowed9.2% DivorcedFemales 46.9% Never married32.2% Now married4.7% Separated8.0% Widowed8.2% DivorcedWomen who gave birth in the past 12 months Now married:
26.3% (25)Unmarried:
73.7% (69)
Women who did not give birth in the past 12 months Now married:
32.3% (503)Unmarried:
67.7% (1,055)
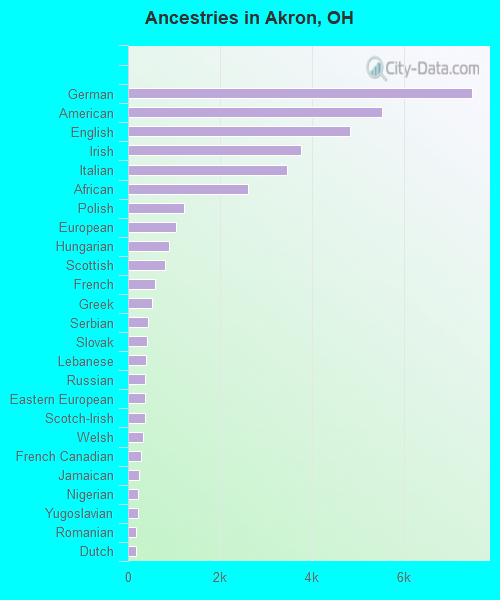
Ancestries in Akron
7,475 8.2% German5,531 6.1% American4,832 5.3% English3,769 4.1% Irish3,464 3.8% Italian2,611 2.9% African1,217 1.3% Polish1,054 1.2% European892 1.0% Hungarian799 0.9% Scottish593 0.6% French524 0.6% Greek439 0.5% Serbian414 0.5% Slovak394 0.4% Lebanese369 0.4% Russian360 0.4% Eastern European359 0.4% Scotch-Irish330 0.4% Welsh279 0.3% French Canadian243 0.3% Jamaican219 0.2% Nigerian219 0.2% Yugoslavian182 0.2% Romanian177 0.2% Dutch172 0.2% Czech141 0.2% Israeli127 0.1% Ghanaian119 0.1% Swedish111 0.1% Danish108 0.1% Canadian107 0.1% Pennsylvania German106 0.1% Sudanese98 0.1% Austrian96 0.1% Slovene94 0.1% Czechoslovakian92 0.1% Croatian80 0.09% British78 0.09% Swiss77 0.08% Ukrainian71 0.08% Norwegian65 0.07% West Indian48 0.05% Belizean47 0.05% Liberian45 0.05% Lithuanian36 0.04% Belgian34 0.04% Scandinavian31 0.03% Egyptian30 0.03% Macedonian30 0.03% Northern European27 0.03% Haitian24 0.03% Arab22 0.02% Palestinian22 0.02% Jordanian19 0.02% Soviet Union19 0.02% Moroccan16 0.02% Guyanese15 0.02% Portuguese14 0.02% Turkish12 0.01% Ugandan11 0.01% German Russian11 0.01% Armenian10 0.01% Iranian9 0.01% Cajun8 0.01% British West Indian6 0.01% Celtic
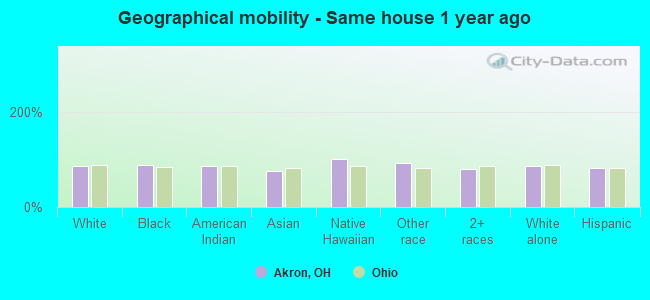
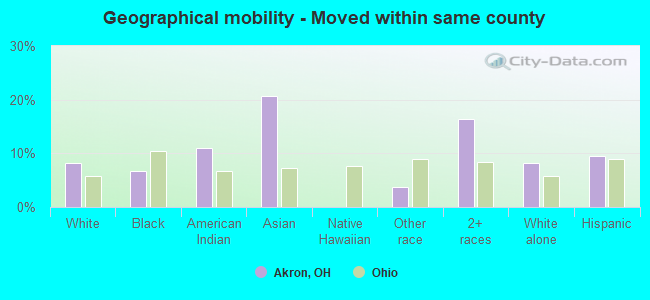
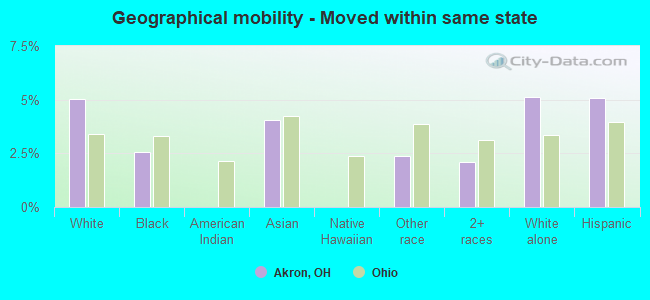
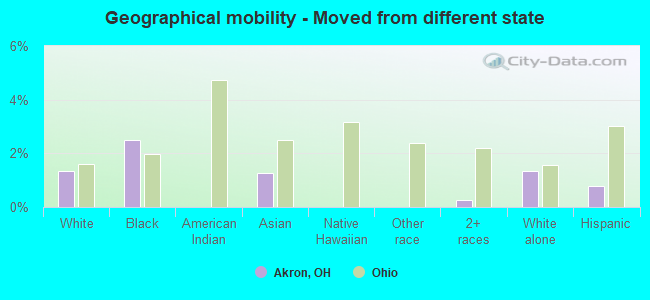
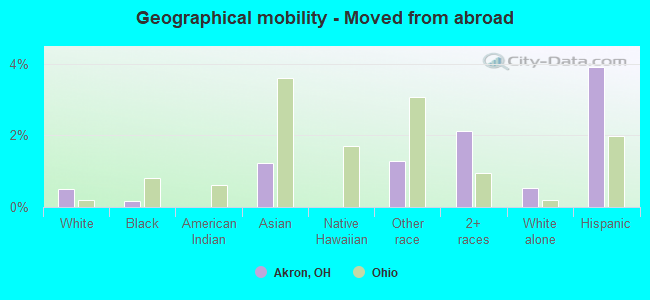
Geographical mobility in Akron Same house 1 year ago 88,857 84.9% White (Caucasian)48,054 88.2% Black or African American459 86.0% American Indian / Alaska Native7,098 75.7% Asian19 100.0% Native Hawaiian / Pacific Islander2,011 92.0% Other race13,968 79.0% Two or more races86,598 84.7% White alone, not Hispanic / Latino6,145 80.8% Hispanic or LatinoMoved within same county 8,562 8.2% White / Caucasian3,617 6.6% Black or African American59 11.0% American Indian / Alaska Native1,943 20.7% Asian81 3.7% Other race2,907 16.5% Two or more races8,468 8.3% White alone, not Hispanic / Latino718 9.4% Hispanic or LatinoMoved within same state 5,248 5.0% White / Caucasian1,388 2.5% Black or African American382 4.1% Asian52 2.4% Other race374 2.1% Two or more races5,248 5.1% White alone, not Hispanic / Latino386 5.1% Hispanic or LatinoMoved from different state 1,415 1.4% White / Caucasian1,358 2.5% Black or African American119 1.3% Asian47 0.3% Two or more races1,356 1.3% White alone, not Hispanic / Latino59 0.8% Hispanic or LatinoMoved from abroad 536 0.5% White94 0.2% Black or African American115 1.2% Asian28 1.3% Other race375 2.1% Two or more races536 0.5% White alone, not Hispanic / Latino297 3.9% Hispanic or Latino
Children Nativity (place of birth) in Akron
Children under 6 years - Living with two parents Both parents native 3,195 100.0% NativeBoth parents foreign-born 1,355 87.1% Native200 12.9% Foreign-bornOne native, one foreign-born parent 468 100.0% NativeChildren under 6 years - Living with one parent Native parent 7,451 100.0% NativeForeign-born parent 93 55.4% Native75 44.6% Foreign-bornChildren 6 to 17 years - Living with two parents Both parents native 6,624 99.0% Native67 1.0% Foreign-bornBoth parents foreign-born 997 66.4% Native505 33.6% Foreign-bornOne native, one foreign-born parent 579 100.0% NativeChildren 6 to 17 years - Living with one parent Native parent 15,747 100.0% NativeForeign-born parent 504 55.5% Native404 44.5% Foreign-born
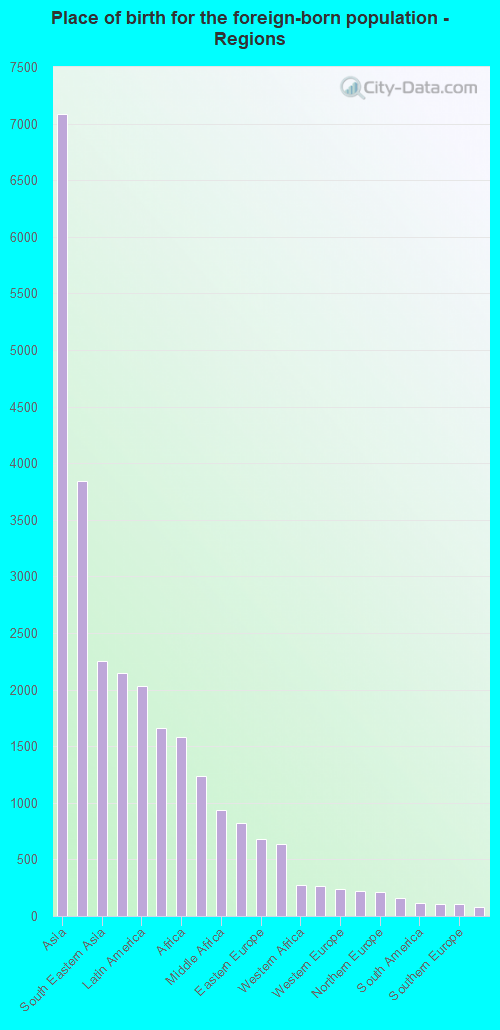
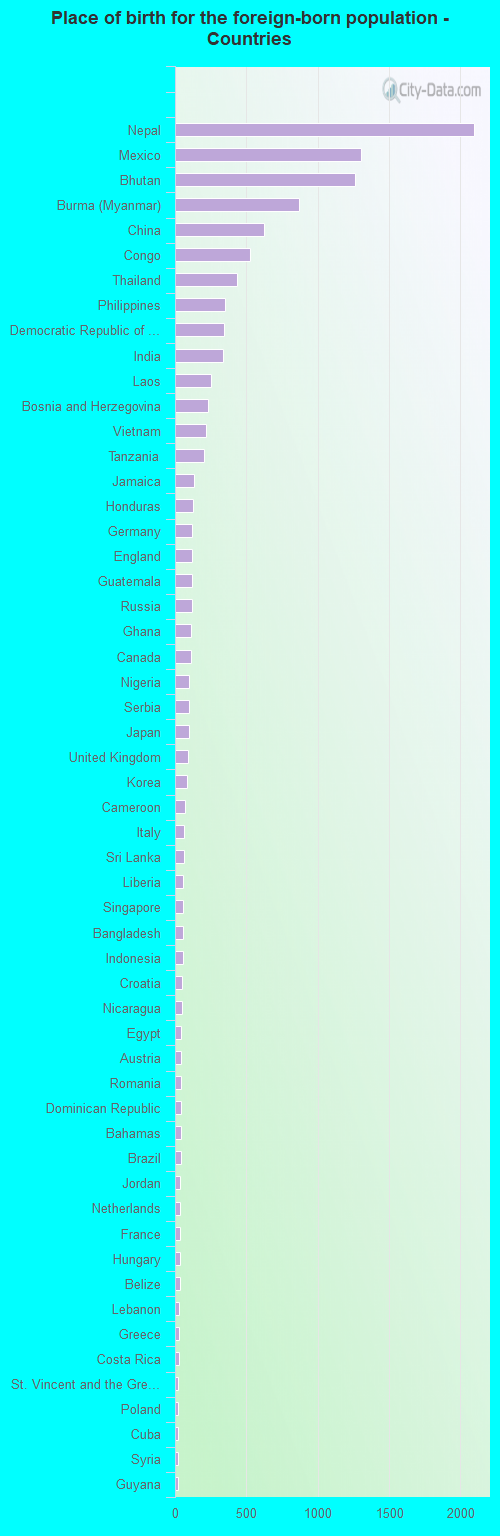
Place of birth for residents in Akron 7,084 Asia3,847 South Central Asia2,252 South Eastern Asia2,146 Americas2,036 Latin America1,661 Central America1,578 Africa1,239 Europe936 Middle Africa820 Eastern Asia679 Eastern Europe636 China272 Western Africa262 Caribbean239 Western Europe223 Eastern Africa215 Northern Europe156 Western Asia112 South America109 Northern America105 Southern Europe83 Northern Africa18 Southern Africa16 Oceania16 Australia and New Zealand Subregion2,095 Nepal1,300 Mexico1,261 Bhutan867 Burma (Myanmar)625 China523 Congo437 Thailand352 Philippines340 Democratic Republic of Congo (Zaire)334 India254 Laos229 Bosnia and Herzegovina220 Vietnam200 Tanzania133 Jamaica129 Honduras121 Germany120 England118 Guatemala117 Russia113 Ghana109 Canada100 Nigeria99 Serbia97 Japan94 United Kingdom86 Korea72 Cameroon65 Italy62 Sri Lanka58 Liberia57 Singapore56 Bangladesh55 Indonesia48 Croatia46 Nicaragua45 Egypt44 Austria44 Romania41 Dominican Republic40 Bahamas39 Brazil38 Jordan37 Netherlands35 France32 Hungary32 Belize29 Lebanon26 Greece26 Costa Rica23 St. Vincent and the Grenadines22 Poland22 Cuba22 Syria20 Guyana19 Colombia18 South Africa17 Peru16 Australia13 Czechoslovakia13 Spain13 Azerbaijan11 Pakistan11 Turkey11 Taiwan9 Iran9 Uganda8 Cambodia8 Panama8 Argentina7 Ecuador6 Kenya5 Ethiopia
Grandparents responsible for own grandchildren in Akron
Grandparents (30 to 59 years) White / Caucasian 204 38.1% Responsible for grandchildren332 61.9% Not responsible for grandchildrenBlack or African American 391 86.9% Responsible for grandchildren59 13.1% Not responsible for grandchildrenAmerican Indian / Alaska Native 5 100.0% Not responsible for grandchildrenAsian 285 100.0% Not responsible for grandchildrenTwo or more races 48 22.2% Responsible for grandchildren167 77.8% Not responsible for grandchildrenWhite alone, not Hispanic / Latino 204 38.1% Responsible for grandchildren332 61.9% Not responsible for grandchildrenHispanic or Latino 14 20.6% Responsible for grandchildren53 79.4% Not responsible for grandchildrenGrandparents (60 years and over) White / Caucasian 413 33.6% Responsible for grandchildren816 66.4% Not responsible for grandchildrenBlack or African American 479 58.7% Responsible for grandchildren337 41.3% Not responsible for grandchildrenAmerican Indian / Alaska Native 10 100.0% Not responsible for grandchildrenAsian 43 15.5% Responsible for grandchildren236 84.5% Not responsible for grandchildrenTwo or more races 25 19.6% Responsible for grandchildren103 80.4% Not responsible for grandchildrenWhite alone, not Hispanic / Latino 413 33.6% Responsible for grandchildren816 66.4% Not responsible for grandchildrenHispanic or Latino 120 100.0% Not responsible for grandchildren
Zip codes: 44203 , 44221 , 44223 , 44260 , 44278 , 44301 , 44302 , 44303 , 44304 , 44305 , 44306 , 44307 , 44308 , 44310 , 44311 , 44312 , 44313 , 44314 , 44319 , 44320 , 44333 .