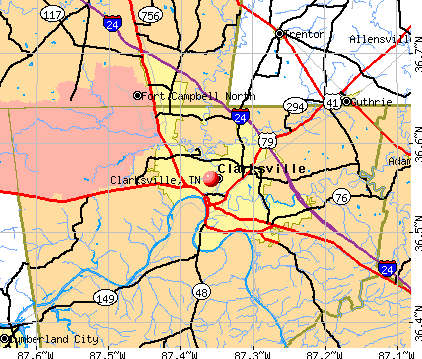
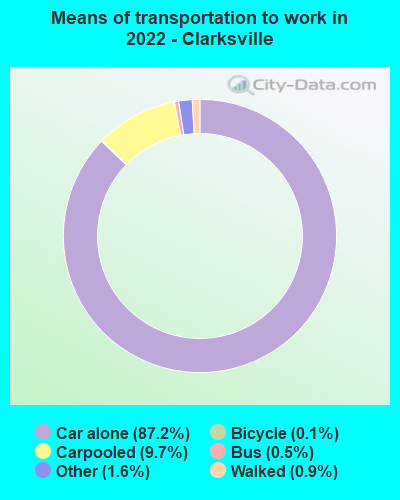
Clarksville, Tennessee
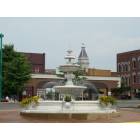
Clarksville: Public Square Fountain
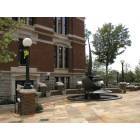
Clarksville: Downtown Clarksville - Courthouse
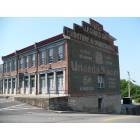
Clarksville: Clarksville, TN old building downtown
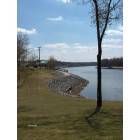
Clarksville: Cumberland River
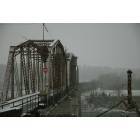
Clarksville: Bridge over Cumberland River
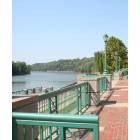
Clarksville: Cumberland River Walk
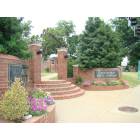
Clarksville: Anterance to Austin Peay State University
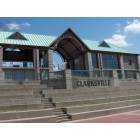
Clarksville: Clarksville Riverwalk
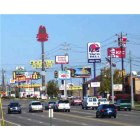
Clarksville: Wilma Rudolph Blvd
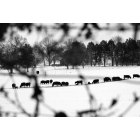
Clarksville: Hickory Hills Farm
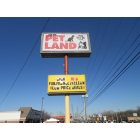
Clarksville: On Ft Campbell Blvd The Friendliest Pet Shop inn Town!
- see
19
more - add
your
Submit your own pictures of this city and show them to the world
- OSM Map
- General Map
- Google Map
- MSN Map
Population change since 2000: +71.1%
| Males: 87,647 | |
| Females: 89,327 |
| Median resident age: | 30.8 years |
| Tennessee median age: | 39.2 years |
Zip codes: 37040, 37042, 37043.
Clarksville Zip Code Map| Clarksville: | $63,723 |
| TN: | $65,254 |
Estimated per capita income in 2022: $30,147 (it was $16,686 in 2000)
Clarksville city income, earnings, and wages data
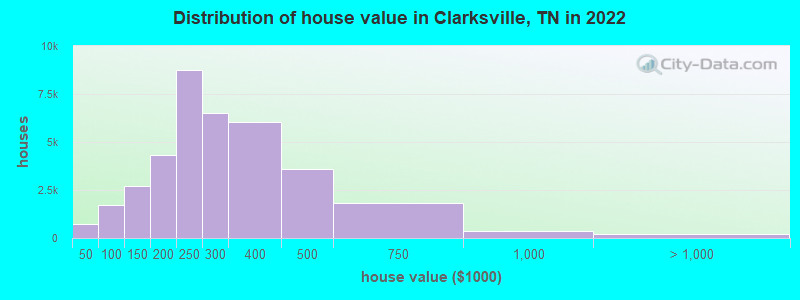
Estimated median house or condo value in 2022: $262,800 (it was $83,500 in 2000)
| Clarksville: | $262,800 |
| TN: | $284,800 |
Mean prices in 2022: all housing units: $244,039; detached houses: $247,912; townhouses or other attached units: $335,544; in 2-unit structures: $246,809; in 3-to-4-unit structures: $231,811; in 5-or-more-unit structures: $222,759; mobile homes: $62,309
Median gross rent in 2022: $1,228.
(10.4% for White Non-Hispanic residents, 18.2% for Black residents, 16.8% for Hispanic or Latino residents, 8.2% for American Indian residents, 11.5% for Native Hawaiian and other Pacific Islander residents, 19.4% for other race residents, 16.9% for two or more races residents)
Detailed information about poverty and poor residents in Clarksville, TN


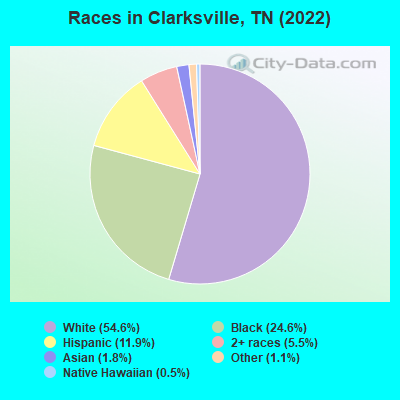
- 96,65454.6%White alone
- 43,46124.6%Black alone
- 21,06511.9%Hispanic
- 9,6495.5%Two or more races
- 3,1601.8%Asian alone
- 1,9271.1%Other race alone
- 9550.5%Native Hawaiian and Other
Pacific Islander alone - 1060.06%American Indian alone
Races in Clarksville detailed stats: ancestries, foreign born residents, place of birth
According to our research of Tennessee and other state lists, there were 362 registered sex offenders living in Clarksville, Tennessee as of April 27, 2024.
The ratio of all residents to sex offenders in Clarksville is 415 to 1.
The ratio of registered sex offenders to all residents in this city is near the state average.
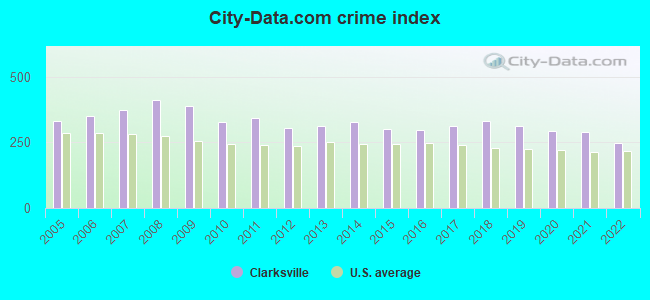
The City-Data.com crime index weighs serious crimes and violent crimes more heavily. Higher means more crime, U.S. average is 246.1. It adjusts for the number of visitors and daily workers commuting into cities.
- means the value is smaller than the state average.- means the value is about the same as the state average.
- means the value is bigger than the state average.
- means the value is much bigger than the state average.
Crime rate in Clarksville detailed stats: murders, rapes, robberies, assaults, burglaries, thefts, arson
Full-time law enforcement employees in 2021, including police officers: 378 (312 officers - 266 male; 46 female).
| Officers per 1,000 residents here: | 1.90 |
| Tennessee average: | 2.57 |
 Recent articles from our blog. Our writers, many of them Ph.D. graduates or candidates, create easy-to-read articles on a wide variety of topics.


Latest news from Clarksville, TN collected exclusively by city-data.com from local newspapers, TV, and radio stations
Ancestries: American (9.7%), German (7.0%), English (6.3%), European (6.0%), Irish (4.3%), African (3.1%).
Current Local Time: CST time zone
Incorporated in 1807
Elevation: 493 feet
Land area: 94.9 square miles.
Population density: 1,866 people per square mile (low).
11,530 residents are foreign born (2.8% Latin America, 2.0% Asia, 0.8% Europe).
| This city: | 6.5% |
| Tennessee: | 5.4% |
Median real estate property taxes paid for housing units with mortgages in 2022: $1,385 (0.5%)
Median real estate property taxes paid for housing units with no mortgage in 2022: $1,571 (0.7%)
Nearest city with pop. 200,000+: Metropolitan Government, TN  (43.2 miles , pop. 569,891).
Nearest city with pop. 1,000,000+: Chicago, IL (365.7 miles , pop. 2,896,016).
Nearest cities:
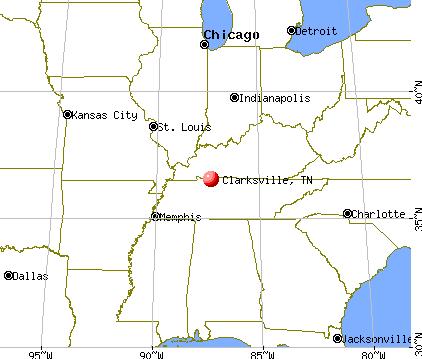
), ), ), ), ), ), Latitude: 36.56 N, Longitude: 87.36 W
Daytime population change due to commuting: -17,984 (-10.2%)
Workers who live and work in this city: 51,750 (60.3%)
Area code: 931
Clarksville tourist attractions:
Clarksville, Tennessee accommodation & food services, waste management - Economy and Business Data
Single-family new house construction building permits:
- 2022: 973 buildings, average cost: $171,100
- 2021: 1452 buildings, average cost: $151,900
- 2020: 1927 buildings, average cost: $97,900
- 2019: 1428 buildings, average cost: $102,600
- 2018: 669 buildings, average cost: $120,500
- 2017: 806 buildings, average cost: $122,200
- 2016: 788 buildings, average cost: $119,400
- 2015: 688 buildings, average cost: $117,700
- 2014: 850 buildings, average cost: $114,400
- 2013: 779 buildings, average cost: $116,400
- 2012: 937 buildings, average cost: $106,300
- 2011: 996 buildings, average cost: $108,200
- 2010: 675 buildings, average cost: $91,600
- 2009: 859 buildings, average cost: $99,300
- 2008: 635 buildings, average cost: $97,300
- 2007: 1038 buildings, average cost: $100,200
- 2006: 1437 buildings, average cost: $105,400
- 2005: 1374 buildings, average cost: $89,200
- 2004: 1550 buildings, average cost: $78,200
- 2003: 987 buildings, average cost: $70,200
- 2002: 806 buildings, average cost: $73,200
- 2001: 692 buildings, average cost: $65,800
- 2000: 628 buildings, average cost: $63,200
- 1999: 849 buildings, average cost: $67,300
- 1998: 865 buildings, average cost: $64,100
- 1997: 756 buildings, average cost: $60,500
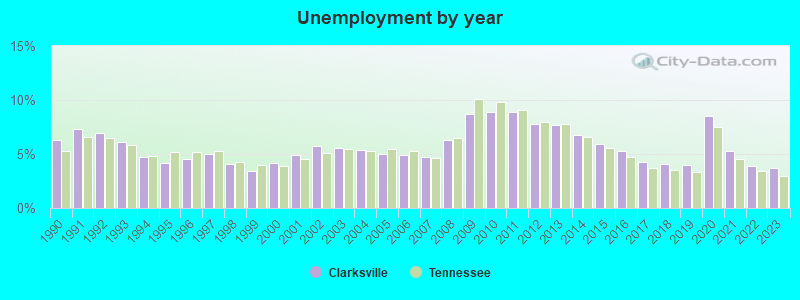
| Here: | 3.7% |
| Tennessee: | 3.0% |
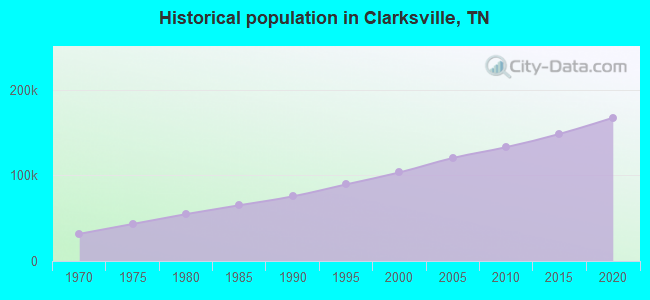
Population change in the 1990s: +25,670 (+33.0%).
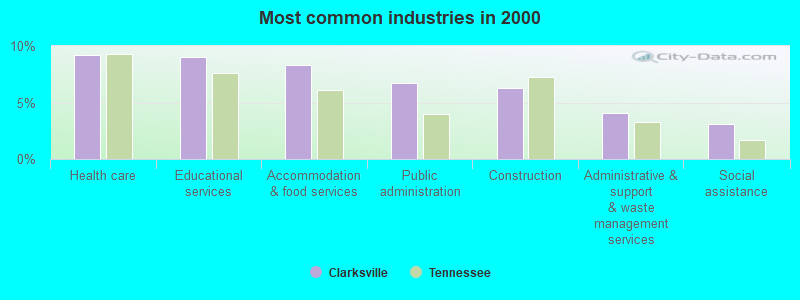
- Health care (9.2%)
- Educational services (9.0%)
- Accommodation & food services (8.3%)
- Public administration (6.7%)
- Construction (6.3%)
- Administrative & support & waste management services (4.1%)
- Social assistance (3.1%)
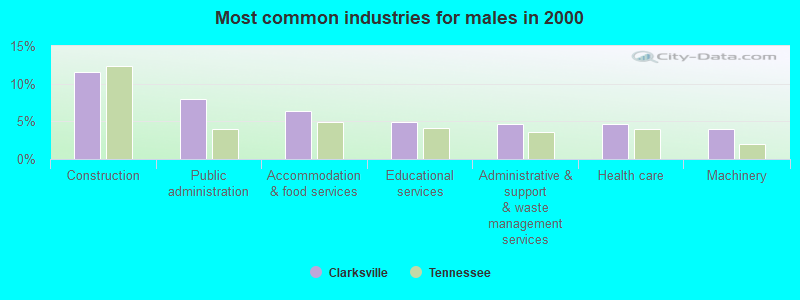
- Construction (11.6%)
- Public administration (8.0%)
- Accommodation & food services (6.4%)
- Educational services (4.9%)
- Administrative & support & waste management services (4.7%)
- Health care (4.7%)
- Machinery (3.9%)
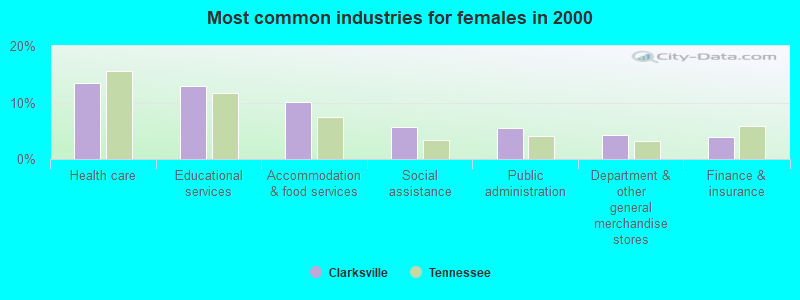
- Health care (13.5%)
- Educational services (12.9%)
- Accommodation & food services (10.1%)
- Social assistance (5.7%)
- Public administration (5.5%)
- Department & other general merchandise stores (4.2%)
- Finance & insurance (3.9%)
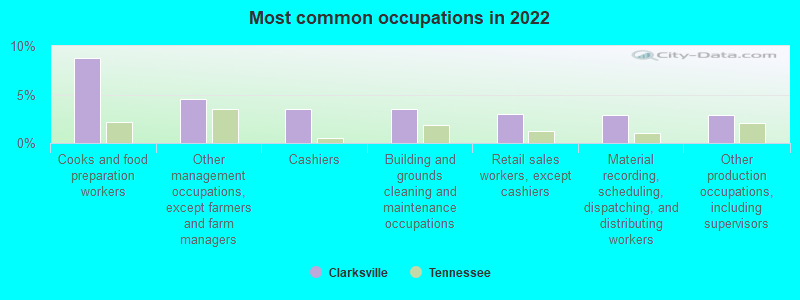
- Cooks and food preparation workers (8.8%)
- Other management occupations, except farmers and farm managers (4.5%)
- Cashiers (3.6%)
- Building and grounds cleaning and maintenance occupations (3.5%)
- Retail sales workers, except cashiers (2.9%)
- Material recording, scheduling, dispatching, and distributing workers (2.9%)
- Other production occupations, including supervisors (2.9%)
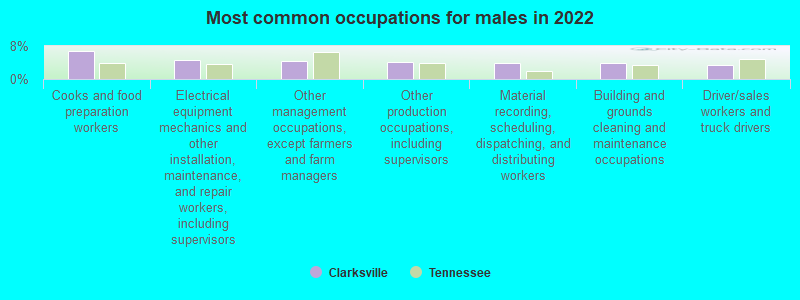
- Cooks and food preparation workers (6.9%)
- Electrical equipment mechanics and other installation, maintenance, and repair workers, including supervisors (4.5%)
- Other management occupations, except farmers and farm managers (4.3%)
- Other production occupations, including supervisors (4.1%)
- Material recording, scheduling, dispatching, and distributing workers (3.9%)
- Building and grounds cleaning and maintenance occupations (3.9%)
- Driver/sales workers and truck drivers (3.4%)
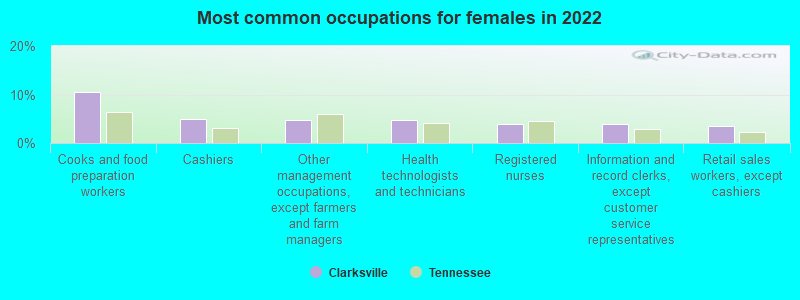
- Cooks and food preparation workers (10.6%)
- Cashiers (5.0%)
- Other management occupations, except farmers and farm managers (4.7%)
- Health technologists and technicians (4.7%)
- Registered nurses (3.9%)
- Information and record clerks, except customer service representatives (3.8%)
- Retail sales workers, except cashiers (3.5%)
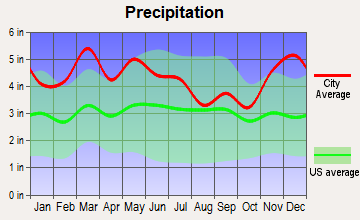
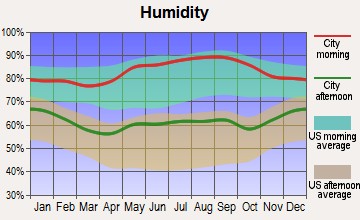
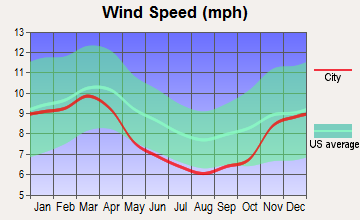
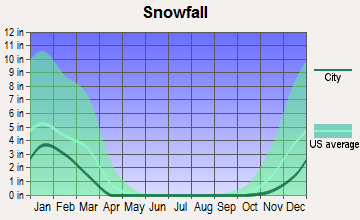
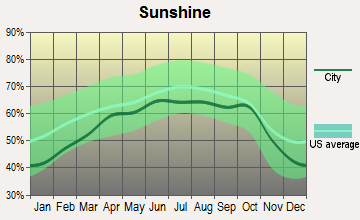
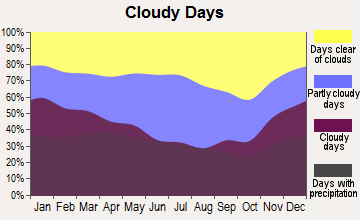
Average climate in Clarksville, Tennessee
Based on data reported by over 4,000 weather stations

|
|


(lower is better)
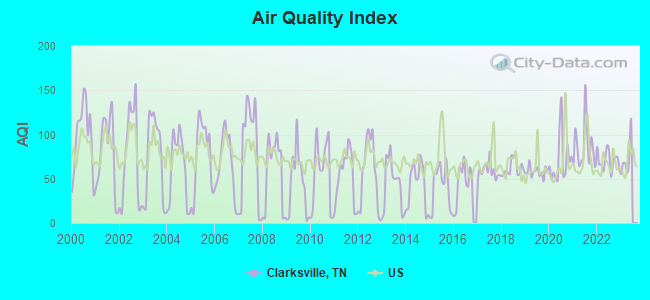
Air Quality Index (AQI) level in 2022 was 70.8. This is about average.
| City: | 70.8 |
| U.S.: | 72.6 |

Nitrogen Dioxide (NO2) [ppb] level in 2005 was 3.65. This is significantly better than average. Closest monitor was 8.8 miles away from the city center.
| City: | 3.65 |
| U.S.: | 5.11 |
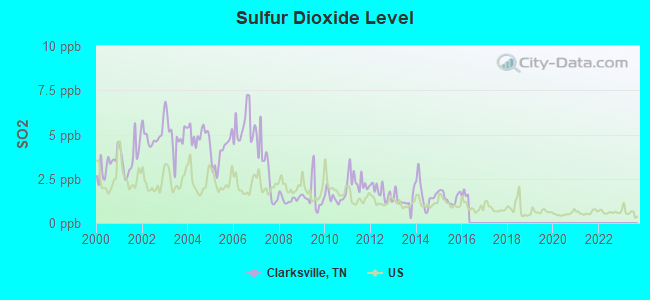
Sulfur Dioxide (SO2) [ppb] level in 2015 was 1.45. This is about average. Closest monitor was 1.4 miles away from the city center.
| City: | 1.45 |
| U.S.: | 1.51 |
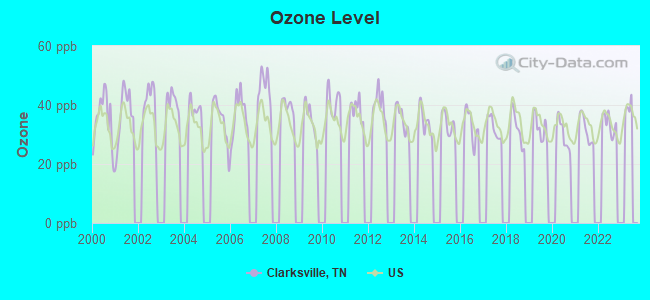
Ozone [ppb] level in 2022 was 33.7. This is about average. Closest monitor was 11.4 miles away from the city center.
| City: | 33.7 |
| U.S.: | 33.3 |
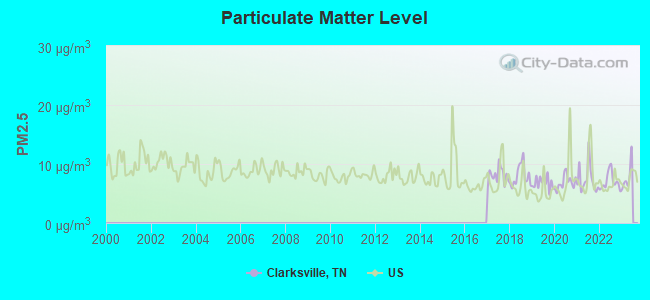
Particulate Matter (PM2.5) [µg/m3] level in 2022 was 7.02. This is about average. Closest monitor was 2.3 miles away from the city center.
| City: | 7.02 |
| U.S.: | 8.11 |
Tornado activity:
Clarksville-area historical tornado activity is slightly above Tennessee state average. It is 59% greater than the overall U.S. average.
On 4/27/1970, a category F4 (max. wind speeds 207-260 mph) tornado 14.8 miles away from the Clarksville city center killed 3 people and injured 85 people and caused between $500,000 and $5,000,000 in damages.
On 1/22/1999, a category F3 (max. wind speeds 158-206 mph) tornado 2.1 miles away from the city center injured 5 people and caused $73 million in damages.
Earthquake activity:
Clarksville-area historical earthquake activity is significantly above Tennessee state average. It is 232% greater than the overall U.S. average.On 4/18/2008 at 09:36:59, a magnitude 5.4 (5.1 MB, 4.8 MS, 5.4 MW, 5.2 MW, Class: Moderate, Intensity: VI - VII) earthquake occurred 134.1 miles away from Clarksville center
On 4/18/2008 at 09:36:59, a magnitude 5.2 (5.2 MW, Depth: 8.9 mi) earthquake occurred 134.0 miles away from Clarksville center
On 6/18/2002 at 17:37:15, a magnitude 5.0 (4.3 MB, 4.6 MW, 5.0 LG) earthquake occurred 101.4 miles away from Clarksville center
On 9/26/1990 at 13:18:51, a magnitude 5.0 (4.7 MB, 4.8 LG, 5.0 LG, Depth: 7.7 mi) earthquake occurred 127.6 miles away from Clarksville center
On 5/4/1991 at 01:18:54, a magnitude 5.0 (4.4 MB, 4.6 LG, 5.0 LG, Depth: 3.1 mi) earthquake occurred 136.9 miles away from Clarksville center
On 6/10/1987 at 23:48:54, a magnitude 5.1 (4.9 MB, 4.4 MS, 4.6 MS, 5.1 LG) earthquake occurred 159.1 miles away from Clarksville center
Magnitude types: regional Lg-wave magnitude (LG), body-wave magnitude (MB), surface-wave magnitude (MS), moment magnitude (MW)
Natural disasters:
The number of natural disasters in Montgomery County (13) is near the US average (15).Major Disasters (Presidential) Declared: 10
Emergencies Declared: 1
Causes of natural disasters: Storms: 9, Floods: 8, Tornadoes: 6, Winds: 5, Winter Storms: 2, Flash Flood: 1, Hurricane: 1, Ice Storm: 1, Other: 1 (Note: some incidents may be assigned to more than one category).
Main business address for: LEGENDS FINANCIAL HOLDINGS INC (STATE COMMERCIAL BANKS).
Hospitals in Clarksville:
- GATEWAY HOSPICE (1760 MADISON ST)
- GATEWAY MEDICAL CENTER (Government - Hospital District or Authority, provides emergency services, 651 DUNLOP LANE)
Nursing Homes in Clarksville:
- (CLOSED) GATEWAY HEALTH SYSTCU (1771 MADISON STREET)
- CLARKSVILLE NURSING AND REHABILITATION CENTER (900 PROFESSIONAL PARK DRIVE)
- GENERAL CARE CONVALESCENT CENTER ICF (111 USSERY ROAD)
- GRACE HEALTHCARE OF CLARKSVILLE (111 USSERY ROAD)
- MONTGOMERY CARE AND REHABILITATION CENTER (198 OLD FARMER ROAD)
- SPRING MEADOWS HCC (220 SR 76 I 24 CONNECTOR)
- SPRING MEADOWS HEALTH CARE CENTER (220 STATE ROUTE 76)
Dialysis Facilities in Clarksville:
- CLARKSVILLE DIALYSIS (231 HILLCREST DRIVE)
- CLARKSVILLE NORTH DIALYSIS (3071 CLAY LEWIS ROAD)
- DCI CUMBERLAND (312 LANDRUM PLACE)
Home Health Centers in Clarksville:
Airports and heliports located in Clarksville:
- Outlaw Field Airport (CKV) (Runways: 2, Air Taxi Ops: 1,000, Itinerant Ops: 11,000, Local Ops: 15,000, Military Ops: 5,475)
- Ferraraccio Field Airport (19TN) (Runways: 1)
- Parr Field Airport (TN53) (Runways: 1)
- Ruckman Field Airport (36TN) (Runways: 1)
- Titan Field Airport (TN23) (Runways: 1)
- Gateway Medical Center Heliport (TN93)
Colleges/Universities in Clarksville:
- Austin Peay State University (Full-time enrollment: 8,621; Location: 601 College St; Public; Website: www.apsu.edu; Offers Master's degree)
- Miller-Motte Technical College-Clarksville (Full-time enrollment: 556; Location: 1820 Business Park Dr; Private, for-profit; Website: www.miller-motte.edu)
- Daymar Institute-Clarksville (Full-time enrollment: 547; Location: 2691 Trenton Road; Private, for-profit; Website: www.daymarinstitute.edu)
- North Central Institute (Full-time enrollment: 163; Location: 168 Jack Miller Blvd; Private, for-profit; Website: www.nci.edu)
- Queen City College (Full-time enrollment: 148; Location: 1594 Fort Campbell Blvd; Private, for-profit; Website: www.queencitycollege.com)
Other colleges/universities with over 2000 students near Clarksville:
- Hopkinsville Community College (about 24 miles; Hopkinsville, KY; Full-time enrollment: 2,269)
- Tennessee State University (about 40 miles; Nashville, TN; FT enrollment: 7,341)
- Nashville State Community College (about 41 miles; Nashville, TN; FT enrollment: 6,436)
- Vanderbilt University (about 43 miles; Nashville, TN; FT enrollment: 10,518)
- Belmont University (about 44 miles; Nashville, TN; FT enrollment: 5,795)
- Lipscomb University (about 45 miles; Nashville, TN; FT enrollment: 3,827)
- Trevecca Nazarene University (about 45 miles; Nashville, TN; FT enrollment: 2,223)
Public high schools in Clarksville:
- ROSSVIEW HIGH SCHOOL (Students: 1,524, Location: 1237 ROSSVIEW RD, Grades: 9-12)
- CLARKSVILLE HIGH SCHOOL (Students: 1,518, Location: 151 RICHVIEW RD, Grades: 9-12)
- NORTHEAST HIGH SCHOOL (Students: 1,492, Location: 3701 TRENTON RD, Grades: 9-12)
- NORTHWEST HIGH SCHOOL (Students: 1,437, Location: 800 LAFAYETTE RD, Grades: 9-12)
- KENWOOD HIGH SCHOOL (Students: 1,413, Location: 251 E PINE MOUNTAIN RD, Grades: 9-12)
- WEST CREEK HIGH SCHOOL (Location: 1210 WEST CREEK COYOTE TRAIL, Grades: 9-12)
- THE MIDDLE COLLEGE @ AUSTIN PEAY STATE UNIVERSITY (Location: 601 COLLEGE ST, Grades: 11-12)
Private high schools in Clarksville:
- CLARKSVILLE ACADEMY (Students: 562, Location: 710 N 2ND ST, Grades: PK-12)
- CLARKSVILLE CHRISTIAN SCHOOL (Students: 157, Location: 505 HIGHWAY 76, Grades: UG-10)
- ACADEMY FOR KEENER MINDS (Students: 83, Location: 420-D MADISON ST, Grades: KG-12)
- WEEMS ACADEMY (Students: 45, Location: 812 GREENWOOD AVE, Grades: 2-12)
- UNITY CHRISTIAN ACADEMY (Students: 35, Location: 256 UFFELMAN DR, Grades: KG-12)
- ACADEMY FOR ACADEMIC EXCELLENCE (Students: 31, Location: 2134 OLD ASHLAND CITY RD, Grades: 4-12)
Biggest public elementary/middle schools in Clarksville:
- KENWOOD MIDDLE SCHOOL (Students: 1,301, Location: 241 E PINE MOUNTAIN RD, Grades: 6-8)
- GLENELLEN ELEMENTARY (Students: 1,300, Location: 825 NEEDMORE RD, Grades: PK-5)
- HAZELWOOD ELEMENTARY (Students: 1,203, Location: 2623 TINY TOWN RD, Grades: PK-5)
- NEW PROVIDENCE MIDDLE SCHOOL (Students: 1,193, Location: 146 CUNNINGHAM LA, Grades: 6-8)
- NORTHEAST ELEMENTARY (Students: 1,167, Location: 3705 TRENTON RD, Grades: PK-5)
- ROSSVIEW MIDDLE SCHOOL (Students: 1,115, Location: 2265 CARDINAL LA, Grades: 6-8)
- RICHVIEW MIDDLE SCHOOL (Students: 1,081, Location: 2350 MEMORIAL DR, Grades: 6-8)
- SANGO ELEMENTARY (Students: 1,020, Location: 3585 SANGO RD, Grades: KG-5)
- RINGGOLD ELEMENTARY (Students: 994, Location: 240 RINGGOLD RD, Grades: PK-5)
- MINGLEWOOD ELEMENTARY (Students: 979, Location: 215 CUNNINGHAM LA, Grades: PK-5)
Private elementary/middle schools in Clarksville:
Points of interest:
Notable locations in Clarksville: Ringgold Creek Mill (A), Swan Lake Golf Course (B), Sevier Station (C), Peachers Mill (D), Mason Rudolph Golf Course (E), Industrial Historic District (F), Downtown Architectural Historic District (G), Dog Hill Architectural District (H), Cole Park Golf Course (I), Clarksville-Montgomery County Corporate Business Park (J), Clarksville Foundry (K), Clarksville Country Club (L), Clarksville Boat Club (M), Gate Number Three (N), Gate Number Two (O), Gate Number One (P), Linwood Landing (Q), Trice Landing (R), Clarksville Fire Rescue Station 10 (S), Clarksville Fire Rescue Station 5 (T). Display/hide their locations on the map
Shopping Centers: Tradewinds South Shopping Center (1), Two Rivers Mall Shopping Center (2), Tradewinds North Shopping Center (3), Governors Square Mall Shopping Center (4), Clarksville Square Shopping Center (5). Display/hide their locations on the map
Main business address in Clarksville: LEGENDS FINANCIAL HOLDINGS INC (A). Display/hide its location on the map
Churches in Clarksville include: Fellowship Church (A), Little West Fork Church (B), Spring Creek Church (C), South Chapel (D), Bethel United Methodist Church (E), Crossland Avenue Baptist Church (F), Edgefield Baptist Church (G), Fifth Ward Baptist Church (H), First Baptist Church (I). Display/hide their locations on the map
Cemeteries: Greenwood Cemetery (1), Riverview Cemetery (2), Evergreen Cemetery (3). Display/hide their locations on the map
Lakes and reservoirs: Lake Barkley (A), Dunbar Lake (B). Display/hide their locations on the map
Streams, rivers, and creeks: Little West Fork (A), Wall Branch (B), Fletchers Fork (C), Red River (D). Display/hide their locations on the map
Parks in Clarksville include: Bel Air Park (1), Fairgrounds Park (2), Murtland Field (3), Dunbar Cave State Park (4), Meri Court Park (5), Coy Lacy Park (6), McGregor Park (7), Billy Dunlop Park (8), Fryar Stadium (9). Display/hide their locations on the map
Tourist attractions: Clarksville Montgomery County Museum (200 South 2nd Street) (1), Clarksville-Montgomery County Tourist Informtn Center (180 Holiday Drive) (2), Beachaven Vineyards & Winery (1100 Dunlop Lane) (3), Clarksville-Montgomery County Tourist Information (312 Madison Street) (4), Putt-Putt Golf & Games of Clarksville (110 Morris Road) (5), Clarksville Travel & Tours Inc (Tours & Charters; 641 North Riverside Drive) (6). Display/hide their approximate locations on the map
Hotels: Comfort Inn North (111 Westfield Drive) (1), Hampton Inn Clarksville (190 Holiday Dr) (2), Guesthouse Clarksville (3083 Wilma Rudolph Boulevard) (3), A and W Motel (1505 Madison Street) (4), Days Inn (130 Westfield Court) (5), Clarksville-Days Inn (1100 Highway 76) (6), Holiday Inn I-24 (3095 Wilma Rudolph Boulevard) (7), Country Inns & Suites (3075 Wilma Rudolph Boulevard) (8), Econo Lodge & Suites (3065 Wilma Rudolph Boulevard) (9). Display/hide their approximate locations on the map
Courts: Montgomery County - Circuit Court Clerk (2 Millenium Plaza) (1), Montgomery County - Circuit Court Judge Division I (2 Millenium Plaza) (2), Montgomery County - Circuit Court Judge Division Ii (2 Millenium Plaza) (3), Montgomery County - Circuit Court Judge Division Iii (2 Millenium Plaza) (4), Montgomery County - Clerk & Master For Chancery Court (2 Millenium Plaza) (5), Montgomery County - Juvenile Court Judge (2 Millenium Plaza) (6), Montgomery County - Chancery Court Judge (2 Millenium Plaza) (7), Clarksville-Montgomery County - Criminal Justice Complex- General Sessions J (2 Millenium Plaza) (8), Clarksville-Montgomery County - General Sessions Court (2 Millenium Plaza) (9). Display/hide their approximate locations on the map
Birthplace of: Jeff Purvis - Racing driver, Dorothy Jordan (film actress) - Actress, Ernest William Goodpasture - Physician, James "Stump" Johnson - Blues pianist and singer, Mark Day (racing driver) - Racing driver, Phil Roe (politician) - Politician, Sloan Thomas - 2005 NFL player (Houston Texans, born: Dec 22, 1981), Trenton Hassell - NBA player (Minnesota Timberwolves, born: Mar 4, 1979), Wilma Rudolph - (1940-1994), runner, Doug Wamble - Musician.
Drinking water stations with addresses in Clarksville and their reported violations in the past:
CLARKSVILLE WATER DEPARTMENT (Population served: 174,740, Surface water):Past monitoring violations:CUMBERLAND HEIGHTS UTILITY DISTRICT (Population served: 3,237, Purch surface water):
- Record Keeping - In JUL-20-2005, Contaminant: IESWTR. Follow-up actions: St Public Notif requested (AUG-29-2005), St Violation/Reminder Notice (AUG-29-2005), St Compliance achieved (JUL-21-2008)
Past health violations:Past monitoring violations:
- MCL, Monthly (TCR) - In DEC-2005, Contaminant: Coliform. Follow-up actions: St Public Notif requested (JAN-31-2006), St Violation/Reminder Notice (JAN-31-2006), St Compliance achieved (FEB-01-2006), St Public Notif received (JUN-30-2006)
- Monitoring, Routine (IDSE) - Between JAN-2009 and MAR-2009, Contaminant: Total Haloacetic Acids (HAA5). Follow-up actions: St Compliance achieved (FEB-24-2009), St Public Notif requested (APR-28-2009), St Violation/Reminder Notice (APR-28-2009), St Public Notif received (JUN-15-2010)
- Monitoring, Routine (IDSE) - Between JAN-2009 and MAR-2009, Contaminant: TTHM. Follow-up actions: St Compliance achieved (FEB-24-2009), St Public Notif requested (APR-28-2009), St Violation/Reminder Notice (APR-28-2009), St Public Notif received (JUN-15-2010)
- Monitoring and Reporting (DBP) - Between APR-2007 and JUN-2007, Contaminant: Chlorine. Follow-up actions: St Public Notif requested (JUN-06-2007), St Violation/Reminder Notice (JUN-06-2007), St Compliance achieved (JUL-01-2007)
- 2 minor monitoring violations
Drinking water stations with addresses in Clarksville that have no violations reported:
- EAST MONTGOMERY UTILITY DISTRICT (Population served: 14,008, Primary Water Source Type: Purch surface water)
- CUNNINGHAM UTILITY DISTRICT (Population served: 12,764, Primary Water Source Type: Purch surface water)
- CUNNINGHAM EAST MONT WAT TR PL (Population served: 25, Primary Water Source Type: Surface water)
| This city: | 2.6 people |
| Tennessee: | 2.5 people |
| This city: | 69.7% |
| Whole state: | 67.3% |
| This city: | 6.3% |
| Whole state: | 5.8% |
Likely homosexual households (counted as self-reported same-sex unmarried-partner households)
- Lesbian couples: 0.3% of all households
- Gay men: 0.2% of all households
People in group quarters in Clarksville in 2010:
- 979 people in college/university student housing
- 822 people in military barracks and dormitories (nondisciplinary)
- 419 people in nursing facilities/skilled-nursing facilities
- 381 people in local jails and other municipal confinement facilities
- 125 people in other noninstitutional facilities
- 104 people in hospitals with patients who have no usual home elsewhere
- 74 people in emergency and transitional shelters (with sleeping facilities) for people experiencing homelessness
- 11 people in residential treatment centers for adults
- 6 people in group homes intended for adults
People in group quarters in Clarksville in 2000:
- 2,074 people in military barracks, etc.
- 774 people in college dormitories (includes college quarters off campus)
- 534 people in nursing homes
- 363 people in local jails and other confinement facilities (including police lockups)
- 231 people in other noninstitutional group quarters
- 32 people in other group homes
- 26 people in military transient quarters for temporary residents
- 26 people in homes or halfway houses for drug/alcohol abuse
- 11 people in homes for the mentally retarded
- 6 people in homes for the mentally ill
- 3 people in religious group quarters
Banks with most branches in Clarksville (2011 data):
- U.S. Bank National Association: 8 branches. Info updated 2012/01/30: Bank assets: $330,470.8 mil, Deposits: $236,091.5 mil, headquarters in Cincinnati, OH, positive income, 3121 total offices, Holding Company: U.S. Bancorp
- F&M Bank: 7 branches. Info updated 2007/01/30: Bank assets: $790.6 mil, Deposits: $644.4 mil, local headquarters, positive income, Commercial Lending Specialization, 21 total offices, Holding Company: F&M Financial Corporation
- Planters Bank, Inc.: Rossview Branch, St Bethlehem Branch, Highway 76 Branch, North Clarksville Branch, Hilldale Office Branch, Commerce Street Branch. Info updated 2006/11/03: Bank assets: $675.5 mil, Deposits: $521.4 mil, headquarters in Hopkinsville, KY, positive income, Commercial Lending Specialization, 9 total offices, Holding Company: Planters Financial Group, Inc
- Legends Bank: at 310 First Street, St. Bethlehem Branch, Eagle Branch, Dover Crossing Branch, Beachaven Branch. Info updated 2010/08/24: Bank assets: $349.6 mil, Deposits: $296.3 mil, local headquarters, negative income in the last year, Commercial Lending Specialization, 7 total offices, Holding Company: Legends Financial Holdings, Inc.
- Cumberland Bank and Trust: Madison Branch, Hilltop Branch, Wilma Rudolph Branch, Cumberland Bank And Trust, Dover Road Branch. Info updated 2009/09/28: Bank assets: $153.1 mil, Deposits: $132.7 mil, local headquarters, positive income, Commercial Lending Specialization, 5 total offices, Holding Company: Cumberland Bancorp, Inc.
- Regions Bank: Clarksville Main Office, New Providence Branch, Trade Winds Branch, Riverside Branch, Clarksville Branch. Info updated 2011/02/24: Bank assets: $123,368.2 mil, Deposits: $98,301.3 mil, headquarters in Birmingham, AL, positive income, Commercial Lending Specialization, 1778 total offices, Holding Company: Regions Financial Corporation
- Bank of America, National Association: Cunningham Plaza Branch, Hilldale Branch, St. Bethlehem Branch, Fort Campbell Branch, Legion Street. Info updated 2009/11/18: Bank assets: $1,451,969.3 mil, Deposits: $1,077,176.8 mil, headquarters in Charlotte, NC, positive income, 5782 total offices, Holding Company: Bank Of America Corporation
- Capital Bank, National Association: Sango Branch, Hilldale Branch, St. Bethlehem Branch, Cunningham Plaza Branch, Jefferson Street Branch. Info updated 2011/09/21: Bank assets: $6,448.0 mil, Deposits: $5,135.4 mil, headquarters in Miami, FL, positive income, Commercial Lending Specialization, 152 total offices, Holding Company: North American Financial Holdings, Inc.
- First Advantage Bank: Fort Campbell Branch, Riverbend Banking Center, 1929 Madison St Branch, Saint Bethlehem Branch, at 1430 Madison Street. Info updated 2012/02/14: Bank assets: $366.1 mil, Deposits: $236.6 mil, local headquarters, positive income, Commercial Lending Specialization, 5 total offices
- 2 other banks with 4 local branches
For population 15 years and over in Clarksville:
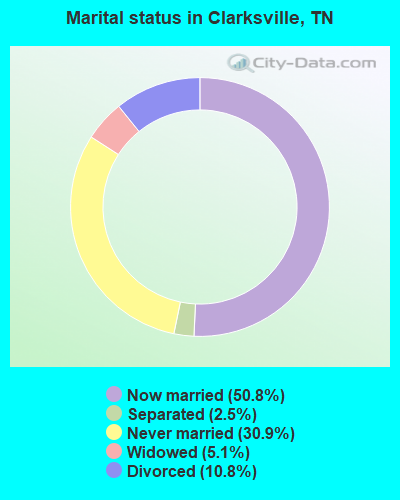
- Never married: 30.9%
- Now married: 50.8%
- Separated: 2.5%
- Widowed: 5.1%
- Divorced: 10.8%
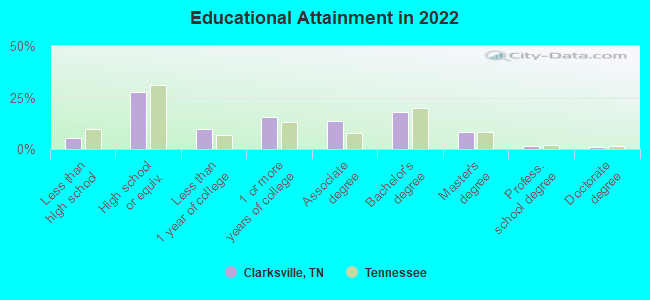
For population 25 years and over in Clarksville:
- High school or higher: 94.6%
- Bachelor's degree or higher: 28.3%
- Graduate or professional degree: 10.5%
- Unemployed: 7.2%
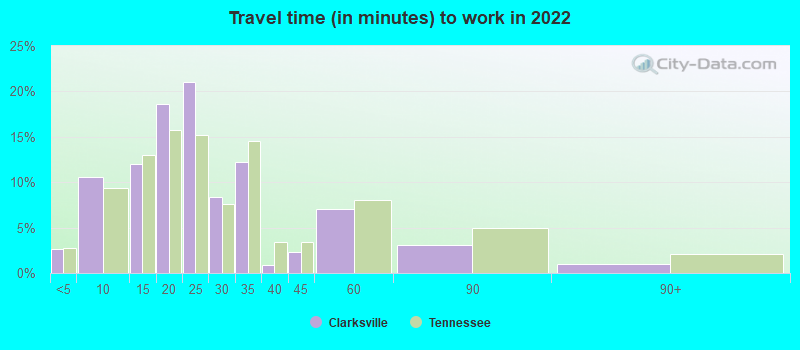
- Mean travel time to work (commute): 23.3 minutes
| Here: | 9.7 |
| Tennessee average: | 11.4 |
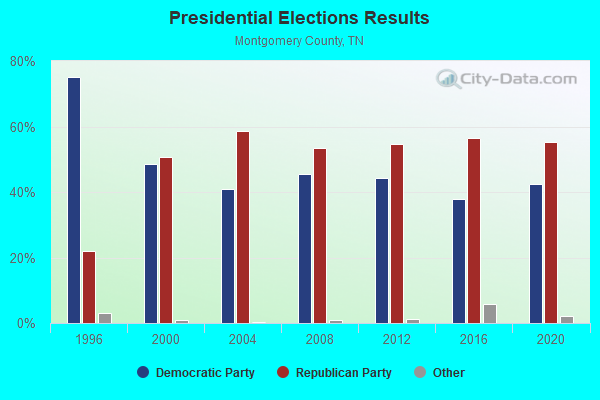
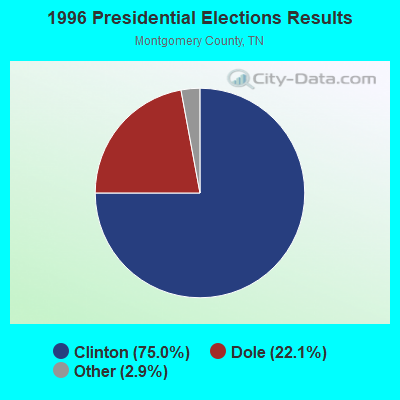
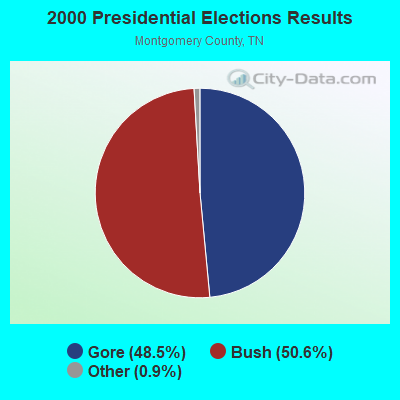
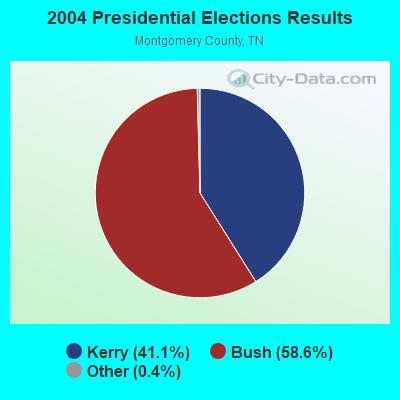
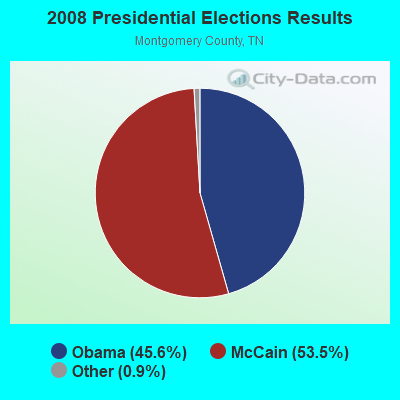
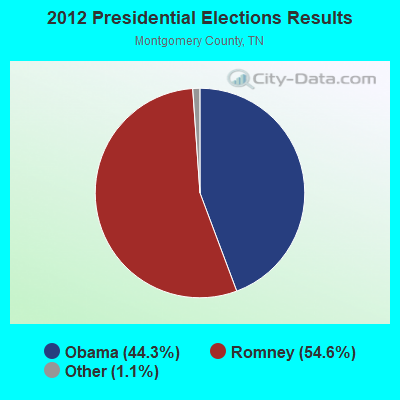
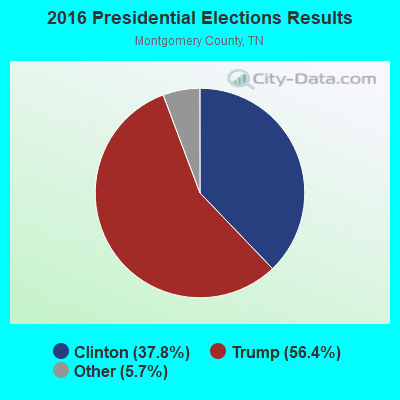
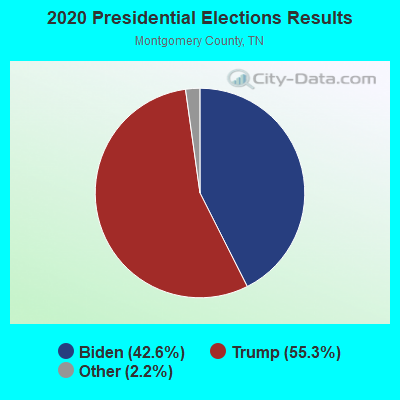
Graphs represent county-level data. Detailed 2008 Election Results
Religion statistics for Clarksville, TN (based on Montgomery County data)
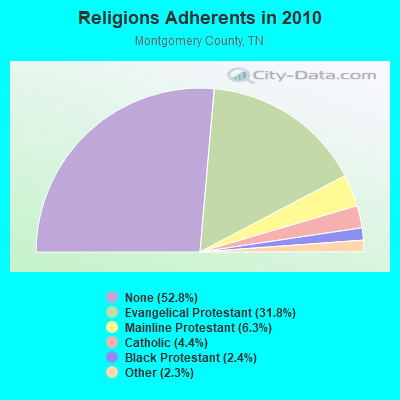
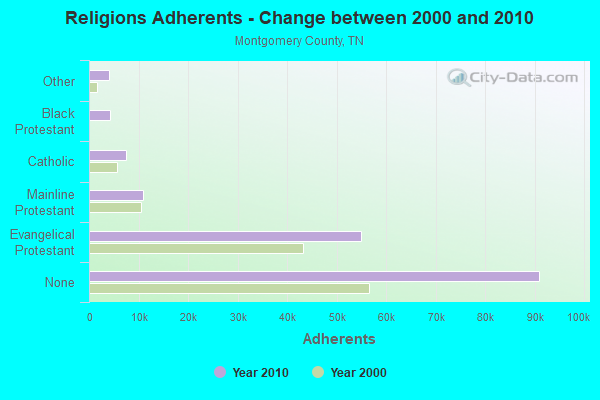
| Religion | Adherents | Congregations |
|---|---|---|
| Evangelical Protestant | 54,831 | 137 |
| Mainline Protestant | 10,902 | 38 |
| Catholic | 7,500 | 1 |
| Black Protestant | 4,146 | 17 |
| Other | 3,977 | 12 |
| Orthodox | 40 | 1 |
| None | 90,935 | - |
Food Environment Statistics:
| Montgomery County: | 1.04 / 10,000 pop. |
| Tennessee: | 1.99 / 10,000 pop. |
| Montgomery County: | 0.26 / 10,000 pop. |
| State: | 0.17 / 10,000 pop. |
| Montgomery County: | 0.52 / 10,000 pop. |
| State: | 0.65 / 10,000 pop. |
| Here: | 3.56 / 10,000 pop. |
| Tennessee: | 5.16 / 10,000 pop. |
| Here: | 6.48 / 10,000 pop. |
| State: | 6.56 / 10,000 pop. |
| Here: | 10.6% |
| Tennessee: | 11.4% |
| This county: | 29.6% |
| Tennessee: | 30.2% |
| Montgomery County: | 12.8% |
| State: | 13.5% |
Health and Nutrition:
| Here: | 49.6% |
| Tennessee: | 49.3% |
| This city: | 49.0% |
| State: | 46.1% |
| This city: | 28.7 |
| Tennessee: | 28.8 |
| Clarksville: | 19.3% |
| Tennessee: | 21.0% |
| This city: | 10.8% |
| State: | 10.5% |
| Here: | 6.8 |
| State: | 6.8 |
| This city: | 32.7% |
| State: | 33.9% |
| This city: | 58.6% |
| State: | 55.9% |
| This city: | 82.5% |
| Tennessee: | 79.1% |
More about Health and Nutrition of Clarksville, TN Residents
| Local government employment and payroll (March 2022) | |||||
| Function | Full-time employees | Monthly full-time payroll | Average yearly full-time wage | Part-time employees | Monthly part-time payroll |
|---|---|---|---|---|---|
| Police Protection - Officers | 311 | $1,457,079 | $56,222 | 0 | $0 |
| Firefighters | 242 | $1,091,363 | $54,117 | 0 | $0 |
| Water Supply | 166 | $721,103 | $52,128 | 0 | $0 |
| Transit | 88 | $324,432 | $44,241 | 3 | $4,212 |
| Streets and Highways | 78 | $317,075 | $48,781 | 1 | $1,419 |
| Parks and Recreation | 72 | $278,017 | $46,336 | 60 | $49,872 |
| Police - Other | 66 | $224,361 | $40,793 | 13 | $7,602 |
| Sewerage | 65 | $277,258 | $51,186 | 0 | $0 |
| Gas Supply | 60 | $297,924 | $59,585 | 0 | $0 |
| Other and Unallocable | 56 | $238,211 | $51,045 | 1 | $1,656 |
| Financial Administration | 43 | $228,355 | $63,727 | 2 | $1,143 |
| Other Government Administration | 30 | $155,906 | $62,362 | 12 | $14,720 |
| Judicial and Legal | 9 | $54,452 | $72,603 | 1 | $2,930 |
| Housing and Community Development (Local) | 7 | $41,064 | $70,395 | 1 | $2,046 |
| Fire - Other | 4 | $15,417 | $46,251 | 0 | $0 |
| Natural Resources | 3 | $12,510 | $50,040 | 0 | $0 |
| Totals for Government | 1,300 | $5,734,529 | $52,934 | 94 | $85,600 |
Clarksville government finances - Expenditure in 2021 (per resident):
- Current Operations - Electric Utilities: $156,911,000 ($886.63)
Gas Utilities: $48,499,000 ($274.05)
Police Protection: $28,429,000 ($160.64)
Sewerage: $28,011,000 ($158.28)
Water Utilities: $21,894,000 ($123.71)
Miscellaneous Commercial Activities - Other: $19,578,000 ($110.63)
Local Fire Protection: $18,543,000 ($104.78)
Regular Highways: $13,414,000 ($75.80)
General - Other: $10,445,000 ($59.02)
Parks and Recreation: $8,263,000 ($46.69)
Transit Utilities: $7,921,000 ($44.76)
Central Staff Services: $2,415,000 ($13.65)
Protective Inspection and Regulation - Other: $1,997,000 ($11.28)
Housing and Community Development: $1,924,000 ($10.87)
Financial Administration: $1,879,000 ($10.62)
Judicial and Legal Services: $920,000 ($5.20)
General Public Buildings: $451,000 ($2.55)
Parking Facilities: $447,000 ($2.53)
- Electric Utilities - Interest on Debt: $2,296,000 ($12.97)
- Gas Utilities - Interest on Debt: $3,083,000 ($17.42)
- General - Interest on Debt: $3,086,000 ($17.44)
- Other Capital Outlay - Police Protection: $1,873,000 ($10.58)
Regular Highways: $978,000 ($5.53)
Parks and Recreation: $638,000 ($3.61)
Local Fire Protection: $342,000 ($1.93)
General - Other: $176,000 ($0.99)
Protective Inspection and Regulation - Other: $49,000 ($0.28)
- Total Salaries and Wages: $109,515,000 ($618.82)
- Water Utilities - Interest on Debt: $8,090,000 ($45.71)
Clarksville government finances - Revenue in 2021 (per resident):
- Charges - Sewerage: $44,540,000 ($251.68)
Miscellaneous Commercial Activities: $23,948,000 ($135.32)
Parks and Recreation: $1,444,000 ($8.16)
Parking Facilities: $434,000 ($2.45)
Other: $83,000 ($0.47)
- Federal Intergovernmental - Housing and Community Development: $1,523,000 ($8.61)
Other: $553,000 ($3.12)
Sewerage: $378,000 ($2.14)
- Miscellaneous - Interest Earnings: $2,209,000 ($12.48)
Fines and Forfeits: $1,381,000 ($7.80)
General Revenue - Other: $1,046,000 ($5.91)
Rents: $452,000 ($2.55)
Sale of Property: $80,000 ($0.45)
Donations From Private Sources: $78,000 ($0.44)
- Revenue - Electric Utilities: $173,358,000 ($979.57)
Gas Utilities: $49,373,000 ($278.98)
Water Utilities: $25,647,000 ($144.92)
Transit Utilities: $698,000 ($3.94)
- State Intergovernmental - General Local Government Support: $17,426,000 ($98.47)
Highways: $5,682,000 ($32.11)
Other: $539,000 ($3.05)
- Tax - Property: $37,201,000 ($210.21)
General Sales and Gross Receipts: $25,685,000 ($145.13)
Alcoholic Beverage Sales: $4,941,000 ($27.92)
Other License: $2,862,000 ($16.17)
Public Utilities Sales: $1,508,000 ($8.52)
Other Selective Sales: $423,000 ($2.39)
Alcoholic Beverage License: $19,000 ($0.11)
Clarksville government finances - Debt in 2021 (per resident):
- Long Term Debt - Beginning Outstanding - Unspecified Public Purpose: $413,788,000 ($2338.13)
Outstanding Unspecified Public Purpose: $319,608,000 ($1805.96)
Beginning Outstanding - Public Debt for Private Purpose: $225,000,000 ($1271.37)
Outstanding Nonguaranteed - Industrial Revenue: $220,000,000 ($1243.12)
Retired Unspecified Public Purpose: $94,180,000 ($532.17)
Retired Nonguaranteed - Public Debt for Private Purpose: $5,000,000 ($28.25)
Clarksville government finances - Cash and Securities in 2021 (per resident):
- Bond Funds - Cash and Securities: $1,232,000 ($6.96)
- Other Funds - Cash and Securities: $239,013,000 ($1350.55)
- Sinking Funds - Cash and Securities: $262,902,000 ($1485.54)
14.27% of this county's 2021 resident taxpayers lived in other counties in 2020 ($50,111 average adjusted gross income)
| Here: | 14.27% |
| Tennessee average: | 8.49% |
0.36% of residents moved from foreign countries ($1,436 average AGI)
Montgomery County: 0.36% Tennessee average: 0.02%
Top counties from which taxpayers relocated into this county between 2020 and 2021:
| from Davidson County, TN | |
| from Christian County, KY | |
| from Rutherford County, TN |
11.80% of this county's 2020 resident taxpayers moved to other counties in 2021 ($49,800 average adjusted gross income)
| Here: | 11.80% |
| Tennessee average: | 7.40% |
0.25% of residents moved to foreign countries ($1,183 average AGI)
Montgomery County: 0.25% Tennessee average: 0.01%
Top counties to which taxpayers relocated from this county between 2020 and 2021:
| to Christian County, KY | |
| to Davidson County, TN | |
| to Stewart County, TN |
| Businesses in Clarksville, TN | ||||
| Name | Count | Name | Count | |
|---|---|---|---|---|
| AT&T | 2 | Long John Silver's | 1 | |
| Ace Hardware | 1 | Lowe's | 2 | |
| Advance Auto Parts | 4 | MainStay | 1 | |
| Aeropostale | 1 | Marriott | 2 | |
| American Eagle Outfitters | 1 | MasterBrand Cabinets | 4 | |
| Applebee's | 1 | Maurices | 1 | |
| Arby's | 4 | Mazda | 1 | |
| AutoZone | 5 | McDonald's | 7 | |
| Avenue | 1 | Men's Wearhouse | 1 | |
| Baskin-Robbins | 2 | Microtel | 1 | |
| Bath & Body Works | 1 | Nike | 18 | |
| Best Western | 1 | Nissan | 1 | |
| Blockbuster | 2 | Office Depot | 1 | |
| Budget Car Rental | 1 | Old Navy | 1 | |
| Burger King | 3 | Olive Garden | 1 | |
| Chevrolet | 1 | Outback | 1 | |
| Chick-Fil-A | 3 | Outback Steakhouse | 1 | |
| Chuck E. Cheese's | 1 | Pac Sun | 1 | |
| Church's Chicken | 2 | Papa John's Pizza | 3 | |
| Cold Stone Creamery | 1 | Payless | 1 | |
| ColorTyme | 1 | Penske | 3 | |
| Comfort Inn | 1 | PetSmart | 1 | |
| Cracker Barrel | 1 | Pier 1 Imports | 1 | |
| Cricket Wireless | 4 | Pizza Hut | 5 | |
| Curves | 3 | Plato's Closet | 1 | |
| DHL | 1 | Quality | 2 | |
| Dairy Queen | 2 | Quiznos | 3 | |
| Days Inn | 2 | RadioShack | 2 | |
| Deb | 1 | Ramada | 1 | |
| Decora Cabinetry | 3 | Red Lobster | 1 | |
| Domino's Pizza | 4 | Red Roof Inn | 1 | |
| Dunkin Donuts | 1 | Rite Aid | 3 | |
| Econo Lodge | 1 | Ruby Tuesday | 2 | |
| Fashion Bug | 1 | Rue21 | 1 | |
| FedEx | 16 | Ryan's Grill | 1 | |
| Finish Line | 1 | Ryder Rental & Truck Leasing | 1 | |
| Firestone Complete Auto Care | 2 | SONIC Drive-In | 6 | |
| Foot Locker | 1 | Sam's Club | 1 | |
| Ford | 1 | Sears | 3 | |
| Fredericks Of Hollywood | 1 | Shoe Carnival | 1 | |
| GNC | 3 | Spencer Gifts | 1 | |
| GameStop | 3 | Sprint Nextel | 3 | |
| Gap | 1 | Starbucks | 2 | |
| Goodwill | 4 | Steak 'n Shake | 1 | |
| H&R Block | 7 | Subaru | 1 | |
| Hardee's | 2 | Subway | 11 | |
| Hilton | 1 | Super 8 | 2 | |
| Hobby Lobby | 1 | T-Mobile | 3 | |
| Holiday Inn | 2 | T.J.Maxx | 1 | |
| Home Depot | 1 | Taco Bell | 4 | |
| Honda | 1 | Target | 1 | |
| Hot Topic | 1 | The Room Place | 1 | |
| Hyundai | 1 | Toyota | 1 | |
| IHOP | 1 | Toys"R"Us | 1 | |
| JCPenney | 1 | U-Haul | 11 | |
| Jack In The Box | 1 | UPS | 17 | |
| Jimmy John's | 1 | Vans | 2 | |
| Jones New York | 1 | Verizon Wireless | 1 | |
| Journeys | 1 | Victoria's Secret | 1 | |
| Justice | 1 | Volkswagen | 1 | |
| KFC | 4 | Waffle House | 5 | |
| Kmart | 2 | Walgreens | 5 | |
| Kohl's | 1 | Walmart | 3 | |
| Kroger | 3 | Wendy's | 5 | |
| La-Z-Boy | 1 | White Castle | 1 | |
| Lane Furniture | 1 | Wingate | 1 | |
| LensCrafters | 1 | YMCA | 1 | |
| Little Caesars Pizza | 5 | |||
Strongest AM radio stations in Clarksville:
- WCTZ (1550 AM; 2 kW; CLARKSVILLE, TN; Owner: WINSTON COMMUNICATIONS, INC.)
- WJQI (540 AM; 1 kW; CLARKSVILLE, TN; Owner: SAGA COMMUNICATIONS OF TUCKESSEE, LLC)
- WJZM (1400 AM; 1 kW; CLARKSVILLE, TN; Owner: COMBERLAND RADIO PARTNERS, INC.)
- WKDA (1200 AM; 50 kW; NASHVILLE, TN; Owner: RADIO NASHVILLE, INC.)
- WNQM (1300 AM; 50 kW; NASHVILLE, TN; Owner: WNQM. INC.)
- WSM (650 AM; 50 kW; NASHVILLE, TN; Owner: GAYLORD ENTERTAINMENT COMPANY)
- WLAC (1510 AM; 50 kW; NASHVILLE, TN; Owner: CAPSTAR TX LIMITED PARTNERSHIP)
- WAMB (1160 AM; 50 kW; DONELSON, TN; Owner: GREAT SOUTHERN BROADCASTING COMPANY, INC.)
- WJMR (1370 AM; 1 kW; FORT CAMPBELL, KY; Owner: SAGA COMMUNICATIONS OF TUCKESSEE, LLC)
- WPLN (1430 AM; 15 kW; MADISON, TN)
- WDKN (1260 AM; 5 kW; DICKSON, TN; Owner: EDMISSON & EUBANK COMMUNICATIONS, INC.)
- WWAM (820 AM; daytime; 50 kW; JASPER, TN; Owner: SHELTON BROADCASTING SYSTEM)
- WRUS (610 AM; 2 kW; RUSSELLVILLE, KY; Owner: LOGAN RADIO INCORPORATED)
Strongest FM radio stations in Clarksville:
- WAPX-FM (91.7 FM; CLARKSVILLE, TN; Owner: AUSTIN PEAY STATE UNIVERSITY)
- WCVQ (107.9 FM; FORT CAMPBELL, KY; Owner: SAGA COMMUNICATIONS OF TUCKESSEE, LLC)
- WQZQ-FM (102.5 FM; DICKSON, TN; Owner: MONTGOMERY BROADCASTING COMPANY)
- WVVR (100.3 FM; HOPKINSVILLE, KY; Owner: SAGA COMMUNICATIONS OF TUCKESSEE, LLC)
- WUBT (101.1 FM; RUSSELLVILLE, KY; Owner: CAPSTAR TX LIMITED PARTNERSHIP)
- W201AQ (88.1 FM; CLARKSVILLE, TN; Owner: WAY-FM MEDIA GROUP, INC.)
- W258AD (99.5 FM; CLARKSVILLE, TN; Owner: TREVECCA NAZARENE UNIVERSITY)
- WMAK (96.3 FM; MURFREESBORO, TN; Owner: SOUTH CENTRAL COMMUNICATIONS CORP.)
- WGFX (104.5 FM; GALLATIN, TN; Owner: CITADEL BROADCASTING COMPANY)
- WRVW (107.5 FM; LEBANON, TN; Owner: CAPSTAR TX LIMITED PARTNERSHIP)
- WSM-FM (95.5 FM; NASHVILLE, TN; Owner: CUMULUS LICENSING CORP.)
- WZZP (97.5 FM; HOPKINSVILLE, KY; Owner: SAGA COMMUNICATIONS OF TUCKESSEE, LLC)
- WJXA (92.9 FM; NASHVILLE, TN; Owner: SOUTH CENTRAL COMMUNICATIONS CORP.)
- WKDF (103.3 FM; NASHVILLE, TN; Owner: CITADEL BROADCASTING COMPANY)
- WNRQ (105.9 FM; NASHVILLE, TN; Owner: CAPSTAR TX LIMITED PARTNERSHIP)
- WNKJ (89.3 FM; HOPKINSVILLE, KY; Owner: PENNYRILE CHRISTIAN COMMUNITY, INC.)
- WSIX-FM (97.9 FM; NASHVILLE, TN; Owner: CAPSTAR TX LIMITED PARTNERSHIP)
- WKDZ-FM (106.5 FM; CADIZ, KY; Owner: HAM BROADCASTING COMPANY, INC.)
- WPLN-FM (90.3 FM; NASHVILLE, TN; Owner: NASHVILLE PUBLIC RADIO)
- WQXQ (101.9 FM; CENTRAL CITY, KY; Owner: STARLIGHT BROADCASTING CO., INC.)
TV broadcast stations around Clarksville:
- WTVF (Channel 5; NASHVILLE, TN; Owner: NEWSCHANNEL 5 NETWORK, LP)
- WCKV-LP (Channel 49; CLARKSVILLE, ETC., TN; Owner: TN MEDIA GROUP, INC.)
- WNPX (Channel 28; COOKEVILLE, TN; Owner: PAXSON COMMUNICATIONS LICENSE COMPANY, LLC)
- WUXP-TV (Channel 30; NASHVILLE, TN; Owner: WUXP LICENSEE, LLC)
- WSMV-TV (Channel 4; NASHVILLE, TN; Owner: MEREDITH CORPORATION)
- WZTV (Channel 17; NASHVILLE, TN; Owner: WZTV LICENSEE, LLC)
- WPGD (Channel 50; HENDERSONVILLE, TN; Owner: TRINITY BROADCASTING NETWORK)
- WNPX-LP (Channel 20; NASHVILLE, TN; Owner: PAXSON COMMUNICATIONS LPTV, INC.)
- National Bridge Inventory (NBI) Statistics
- 110Number of bridges
- 1,916ft / 584mTotal length
- $99,889,000Total costs
- 2,179,698Total average daily traffic
- 326,667Total average daily truck traffic
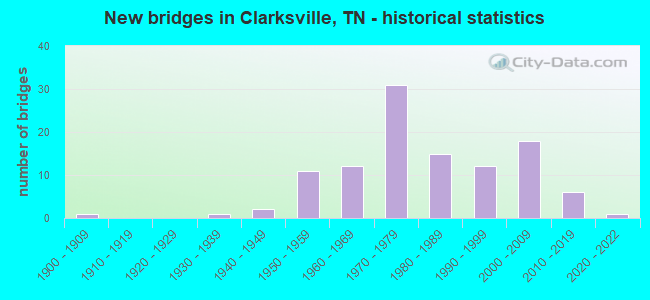
- New bridges - historical statistics
- 11900-1909
- 11930-1939
- 21940-1949
- 111950-1959
- 121960-1969
- 311970-1979
- 151980-1989
- 121990-1999
- 182000-2009
- 62010-2019
- 12020-2022
FCC Registered Antenna Towers: 581 (See the full list of FCC Registered Antenna Towers)
FCC Registered Commercial Land Mobile Towers: 4 (See the full list of FCC Registered Commercial Land Mobile Towers in Clarksville, TN)
FCC Registered Private Land Mobile Towers: 7 (See the full list of FCC Registered Private Land Mobile Towers)
FCC Registered Broadcast Land Mobile Towers: 73 (See the full list of FCC Registered Broadcast Land Mobile Towers)
FCC Registered Microwave Towers: 47 (See the full list of FCC Registered Microwave Towers in this town)
FCC Registered Paging Towers: 8 (See the full list of FCC Registered Paging Towers)
FCC Registered Maritime Coast & Aviation Ground Towers: 1 (See the full list of FCC Registered Maritime Coast & Aviation Ground Towers)
FCC Registered Amateur Radio Licenses: 694 (See the full list of FCC Registered Amateur Radio Licenses in Clarksville)
FAA Registered Aircraft Manufacturers and Dealers: 11 (See the full list of FAA Registered Manufacturers and Dealers in Clarksville)
FAA Registered Aircraft: 81 (See the full list of FAA Registered Aircraft)
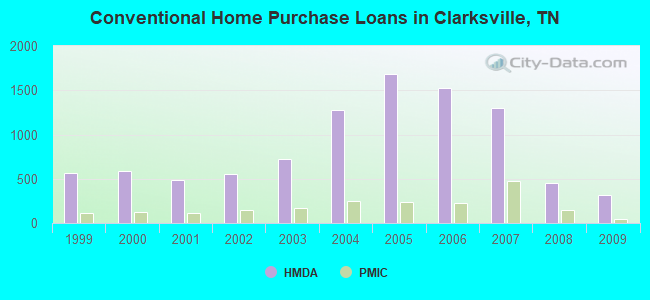
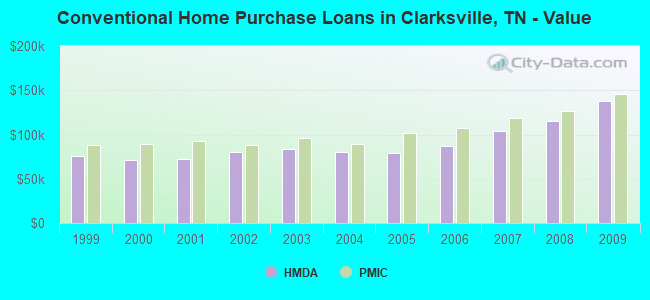
| Home Mortgage Disclosure Act Aggregated Statistics For Year 2009 (Based on 16 full and 6 partial tracts) | ||||||||||||||
| A) FHA, FSA/RHS & VA Home Purchase Loans | B) Conventional Home Purchase Loans | C) Refinancings | D) Home Improvement Loans | E) Loans on Dwellings For 5+ Families | F) Non-occupant Loans on < 5 Family Dwellings (A B C & D) | G) Loans On Manufactured Home Dwelling (A B C & D) | ||||||||
|---|---|---|---|---|---|---|---|---|---|---|---|---|---|---|
| Number | Average Value | Number | Average Value | Number | Average Value | Number | Average Value | Number | Average Value | Number | Average Value | Number | Average Value | |
| LOANS ORIGINATED | 1,901 | $144,007 | 311 | $138,375 | 1,510 | $133,706 | 135 | $30,450 | 20 | $503,984 | 260 | $127,661 | 9 | $51,928 |
| APPLICATIONS APPROVED, NOT ACCEPTED | 29 | $133,195 | 19 | $121,622 | 176 | $125,601 | 19 | $25,317 | 0 | $0 | 10 | $92,933 | 3 | $30,133 |
| APPLICATIONS DENIED | 159 | $130,297 | 48 | $105,614 | 662 | $116,660 | 216 | $23,603 | 1 | $537,660 | 69 | $74,348 | 8 | $42,259 |
| APPLICATIONS WITHDRAWN | 125 | $139,534 | 31 | $120,069 | 460 | $127,862 | 60 | $30,370 | 0 | $0 | 36 | $74,728 | 1 | $33,140 |
| FILES CLOSED FOR INCOMPLETENESS | 27 | $117,034 | 9 | $100,241 | 97 | $130,289 | 4 | $34,900 | 0 | $0 | 7 | $66,566 | 1 | $26,000 |
Detailed mortgage data for all 22 tracts in Clarksville, TN
| Private Mortgage Insurance Companies Aggregated Statistics For Year 2009 (Based on 13 full and 6 partial tracts) | ||||||
| A) Conventional Home Purchase Loans | B) Refinancings | C) Non-occupant Loans on < 5 Family Dwellings (A & B) | ||||
|---|---|---|---|---|---|---|
| Number | Average Value | Number | Average Value | Number | Average Value | |
| LOANS ORIGINATED | 50 | $145,859 | 32 | $141,669 | 3 | $127,947 |
| APPLICATIONS APPROVED, NOT ACCEPTED | 13 | $126,509 | 13 | $136,005 | 0 | $0 |
| APPLICATIONS DENIED | 8 | $160,576 | 6 | $126,020 | 1 | $83,800 |
| APPLICATIONS WITHDRAWN | 3 | $90,530 | 2 | $148,080 | 0 | $0 |
| FILES CLOSED FOR INCOMPLETENESS | 2 | $96,500 | 0 | $0 | 0 | $0 |
2002 - 2018 National Fire Incident Reporting System (NFIRS) incidents
- Fire incident types reported to NFIRS in Clarksville, TN
- 4,79845.3%Outside Fires
- 3,36031.7%Structure Fires
- 1,89817.9%Mobile Property/Vehicle Fires
- 5475.2%Other
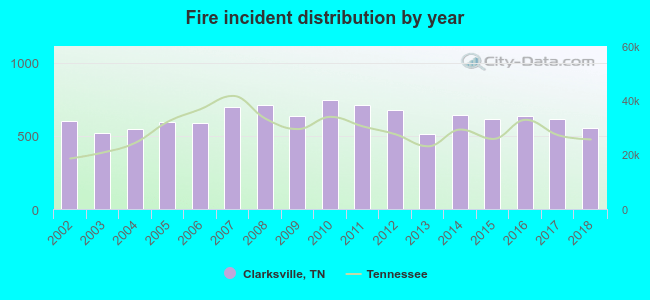 Based on the data from the years 2002 - 2018 the average number of fire incidents per year is 624. The highest number of reported fires - 744 took place in 2010, and the least - 512 in 2013. The data has a decreasing trend.
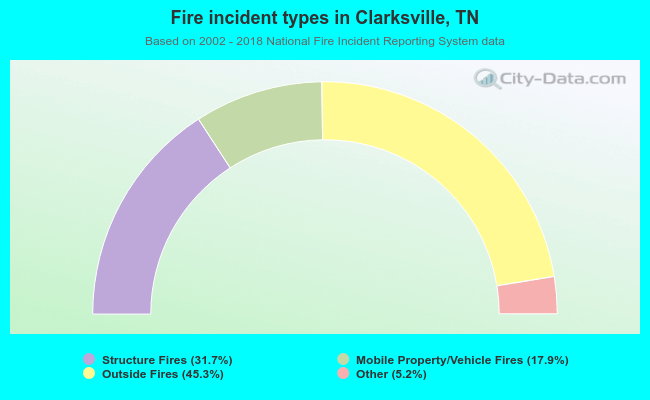 When looking into fire subcategories, the most incidents belonged to: Outside Fires (45.3%), and Structure Fires (31.7%).
Fire-safe hotels and motels in Clarksville, Tennessee:
- Riverview Inn, 50 College St, Clarksville, Tennessee 37040 , Phone: (931) 552-3331, Fax: (931) 647-5005
- Econoy Lodge Inn & Suites, 3065 Wilma Rudolph Blvd, Clarksville, Tennessee 37040 , Phone: (931) 647-2002
- Quality Inn Exit 4, 3095 Wilma Rudolph Blvd, Clarksville, Tennessee 37040 , Phone: (931) 648-4848, Fax: (931) 648-4858
- Quality Inn Downtown, 803 N Second St, Clarksville, Tennessee 37040 , Phone: (931) 645-9084, Fax: (931) 645-9084
- Baymont Inn & Suites, 1112 SR 76, Clarksville, Tennessee 37043 , Phone: (931) 358-2020, Fax: (931) 358-5302
- Rodeway Inn & Suites, 111 Westfield Ct, Clarksville, Tennessee 37040 , Phone: (931) 647-6144, Fax: (931) 647-6144
- Country Inn & Suites, 3075 Wilma Rudolph Blvd, Clarksville, Tennessee 37040 , Phone: (931) 645-1400, Fax: (931) 472-1002
- Holiday Inn Express Clarksville Highway, 700 Sango Rd, Clarksville, Tennessee 37043 , Phone: (931) 358-5800
- 17 other hotels and motels
| Most common first names in Clarksville, TN among deceased individuals | ||
| Name | Count | Lived (average) |
|---|---|---|
| James | 619 | 69.9 years |
| William | 482 | 72.2 years |
| Mary | 479 | 77.2 years |
| John | 408 | 72.6 years |
| Robert | 388 | 69.8 years |
| Charles | 248 | 68.6 years |
| George | 198 | 71.6 years |
| Dorothy | 160 | 75.1 years |
| Thomas | 136 | 70.8 years |
| Annie | 133 | 82.7 years |
| Most common last names in Clarksville, TN among deceased individuals | ||
| Last name | Count | Lived (average) |
|---|---|---|
| Smith | 286 | 75.0 years |
| Johnson | 187 | 70.9 years |
| Jones | 160 | 72.4 years |
| Williams | 143 | 72.0 years |
| Davis | 132 | 72.6 years |
| Harris | 132 | 75.1 years |
| Martin | 102 | 76.2 years |
| Wilson | 100 | 77.1 years |
| Brown | 99 | 73.8 years |
| Moore | 90 | 74.6 years |
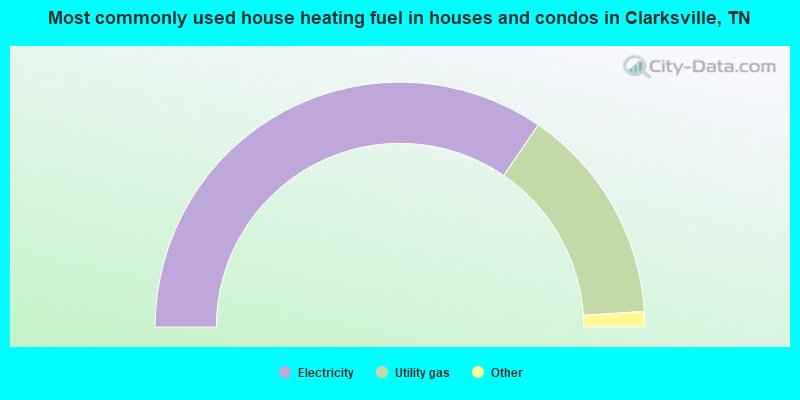
- 69.2%Electricity
- 28.9%Utility gas
- 1.4%Bottled, tank, or LP gas
- 0.3%No fuel used
- 0.1%Solar energy
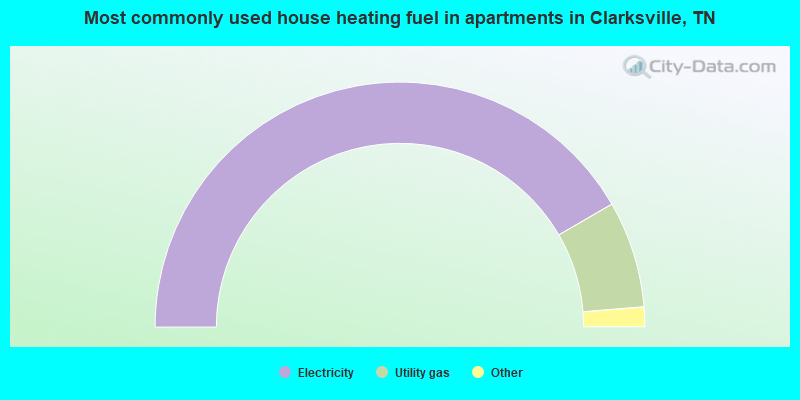
- 83.3%Electricity
- 14.1%Utility gas
- 1.3%No fuel used
- 0.7%Bottled, tank, or LP gas
- 0.3%Wood
- 0.2%Solar energy
- 0.1%Fuel oil, kerosene, etc.
Clarksville compared to Tennessee state average:
- Unemployed percentage below state average.
- Black race population percentage above state average.
- Hispanic race population percentage significantly above state average.
- Median age significantly below state average.
- Foreign-born population percentage above state average.
- Length of stay since moving in below state average.
- House age below state average.
- Number of college students above state average.
Clarksville, TN compared to other similar cities:
Clarksville on our top lists:
- #12 on the list of "Top 101 cities with largest percentage of males in industries: public administration (population 50,000+)"
- #16 on the list of "Top 101 cities with largest percentage of males in occupations: installation, maintenance, and repair occupations (population 50,000+)"
- #21 on the list of "Top 101 cities with largest percentage of females in industries: real estate and rental and leasing (population 50,000+)"
- #25 on the list of "Top 101 cities with the most people born in other U.S. states (population 50,000+)"
- #30 on the list of "Top 101 cities with the least people having professional degrees (population 50,000+)"
- #36 on the list of "Top 101 cities with largest percentage of females in occupations: education, training, and library occupations (population 50,000+)"
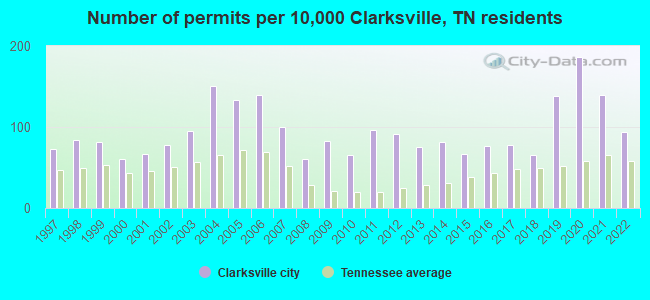
- #40 on the list of "Top 101 cities with most building permits per 10,000 residents (population 50,000+)"
- #67 on the list of "Top 101 cities with largest percentage of males in occupations: law enforcement workers including supervisors (population 50,000+)"
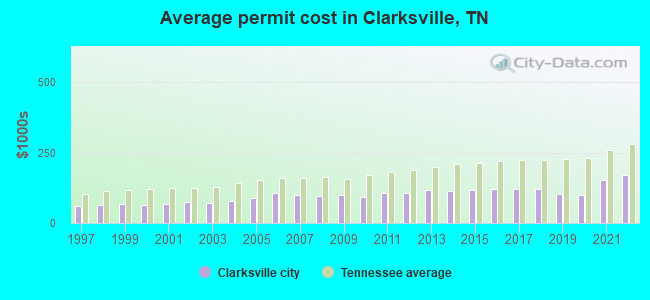
- #67 on the list of "Top 101 cities with the lowest cost per building permit (population 50,000+)"
- #70 on the list of "Top 101 cities with largest percentage of females in occupations: health technologists and technicians (population 50,000+)"
- #71 on the list of "Top 101 cities with largest percentage of males in occupations: office and administrative support occupations (population 50,000+)"
- #74 on the list of "Top 101 cities with the largest percentage of people in military transient quarters for temporary residents (population 1,000+)"
- #76 on the list of "Top 101 cities with largest percentage of females in occupations: community and social service occupations (population 50,000+)"
- #77 on the list of "Top 100 cities with youngest residents (pop. 50,000+)"
- #84 on the list of "Top 101 cities with the largest city-data.com crime index decrease from 2011 to 2012 (population 50,000+)"
- #87 on the list of "Top 101 cities with largest percentage of males in industries: accommodation and food services (population 50,000+)"
- #90 on the list of "Top 101 cities with the highest number of assaults per 100,000 residents, excludes tourist destinations and others with a lot of outsiders visiting based on city industries data (population 50,000+)"
- #4 on the list of "Top 101 counties with the lowest percentage of residents that drank alcohol in the past 30 days"
- #11 on the list of "Top 101 counties with the highest number of births per 1000 residents 2007-2013"
- #15 on the list of "Top 101 counties with the highest percentage of residents relocating from other counties between 2010 and 2011 (pop. 50,000+)"
- #17 on the list of "Top 101 counties with the largest increase in the number of births per 1000 residents 2000-2006 to 2007-2013 (pop 50,000+)"
- #21 on the list of "Top 101 counties with the highest percentage of residents relocating to other counties in 2011 (pop. 50,000+)"

|
|
Total of 84 patent applications in 2008-2024.