St. Bethlehem, Tennessee
Submit your own pictures of this place and show them to the world
- OSM Map
- General Map
- Google Map
- MSN Map

| Males: 13,106 | |
| Females: 12,995 |
| Median resident age: | 30.2 years |
| Tennessee median age: | 35.9 years |
Zip code: 37040
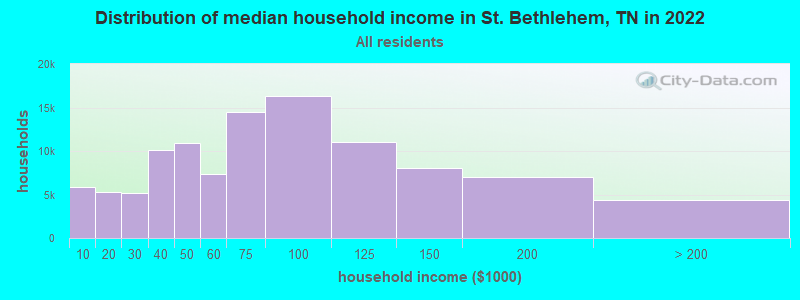
| St. Bethlehem: | $79,931 |
| TN: | $65,254 |
Estimated per capita income in 2022: $35,656 (it was $19,226 in 2000)
St. Bethlehem CCD income, earnings, and wages data
Estimated median house or condo value in 2022: $310,812 (it was $94,000 in 2000)
| St. Bethlehem: | $310,812 |
| TN: | $284,800 |
Mean prices in 2022: all housing units: $290,985; detached houses: $296,611; townhouses or other attached units: $294,053; in 2-unit structures: $140,535; in 3-to-4-unit structures: $328,300; in 5-or-more-unit structures: $221,917; mobile homes: $129,363; occupied boats, rvs, vans, etc.: $39,198
Detailed information about poverty and poor residents in St. Bethlehem, TN


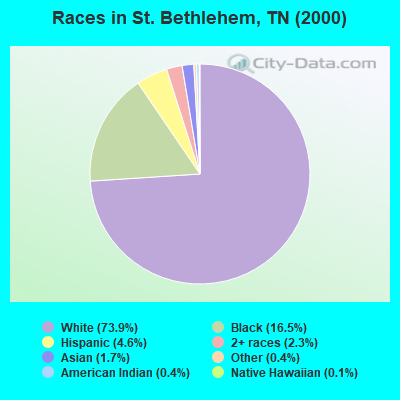
- 16,84673.9%White alone
- 3,77216.5%Black alone
- 1,0434.6%Hispanic
- 5352.3%Two or more races
- 3851.7%Asian alone
- 830.4%American Indian alone
- 970.4%Other race alone
- 310.1%Native Hawaiian and Other
Pacific Islander alone
Races in St. Bethlehem detailed stats: ancestries, foreign born residents, place of birth
 Recent articles from our blog. Our writers, many of them Ph.D. graduates or candidates, create easy-to-read articles on a wide variety of topics.
Current Local Time: CST time zone
Elevation: 561 feet
Land area: 86.4 square miles.
Population density: 302 people per square mile (very low).

| St. Bethlehem CCD: | 1.1% ($1,000) |
| Tennessee: | 0.8% ($715) |
Nearest city with pop. 50,000+: Clarksville, TN  (4.3 miles , pop. 103,455).
Nearest city with pop. 200,000+: Metropolitan Government, TN (41.6 miles , pop. 569,891).
Nearest city with pop. 1,000,000+: Chicago, IL (364.0 miles , pop. 2,896,016).
Nearest cities:
), ), ), )Latitude: 36.59 N, Longitude: 87.29 W

| Here: | 3.5% |
| Tennessee: | 3.0% |
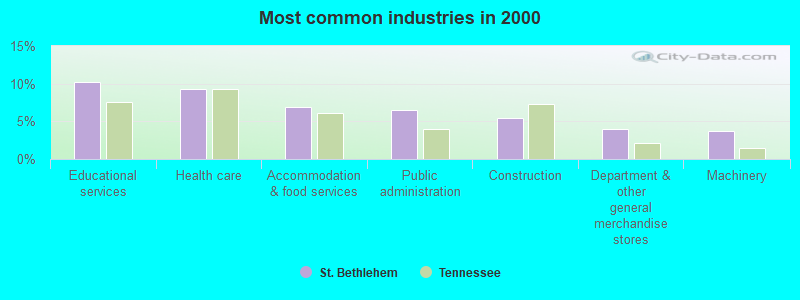
- Educational services (10.3%)
- Health care (9.2%)
- Accommodation & food services (7.0%)
- Public administration (6.6%)
- Construction (5.4%)
- Department & other general merchandise stores (4.0%)
- Machinery (3.7%)
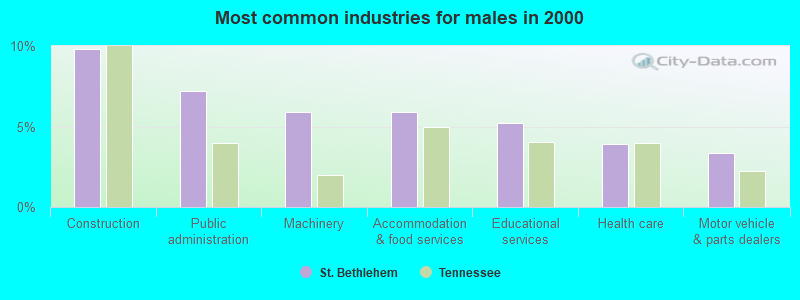
- Construction (9.8%)
- Public administration (7.2%)
- Machinery (5.9%)
- Accommodation & food services (5.9%)
- Educational services (5.2%)
- Health care (3.9%)
- Motor vehicle & parts dealers (3.4%)
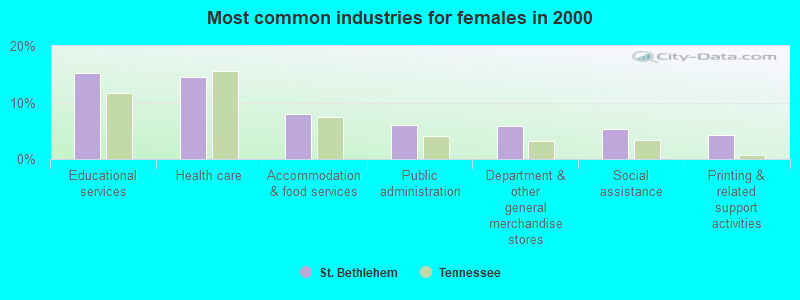
- Educational services (15.2%)
- Health care (14.4%)
- Accommodation & food services (8.0%)
- Public administration (6.0%)
- Department & other general merchandise stores (5.9%)
- Social assistance (5.3%)
- Printing & related support activities (4.2%)
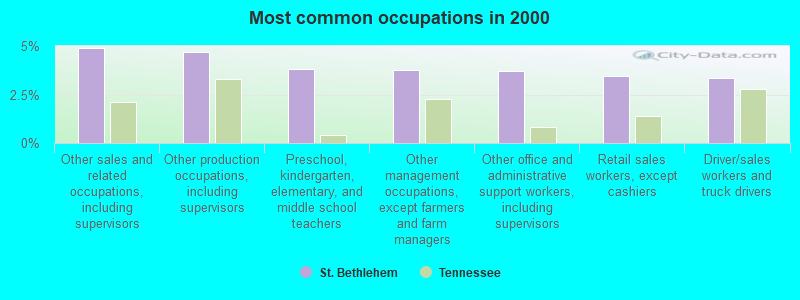
- Other sales and related occupations, including supervisors (4.9%)
- Other production occupations, including supervisors (4.7%)
- Preschool, kindergarten, elementary, and middle school teachers (3.8%)
- Other management occupations, except farmers and farm managers (3.8%)
- Other office and administrative support workers, including supervisors (3.7%)
- Retail sales workers, except cashiers (3.4%)
- Driver/sales workers and truck drivers (3.3%)
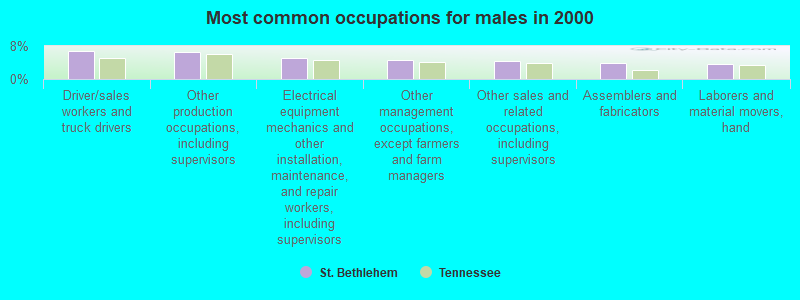
- Driver/sales workers and truck drivers (6.8%)
- Other production occupations, including supervisors (6.5%)
- Electrical equipment mechanics and other installation, maintenance, and repair workers, including supervisors (5.1%)
- Other management occupations, except farmers and farm managers (4.6%)
- Other sales and related occupations, including supervisors (4.4%)
- Assemblers and fabricators (4.0%)
- Laborers and material movers, hand (3.7%)
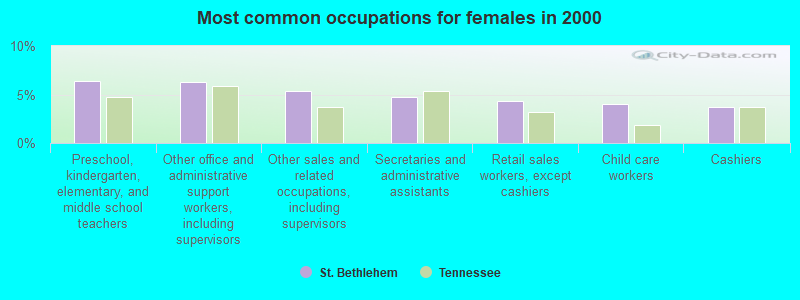
- Preschool, kindergarten, elementary, and middle school teachers (6.4%)
- Other office and administrative support workers, including supervisors (6.3%)
- Other sales and related occupations, including supervisors (5.4%)
- Secretaries and administrative assistants (4.7%)
- Retail sales workers, except cashiers (4.3%)
- Child care workers (4.0%)
- Cashiers (3.7%)
Average climate in St. Bethlehem, Tennessee
Based on data reported by over 4,000 weather stations


(lower is better)
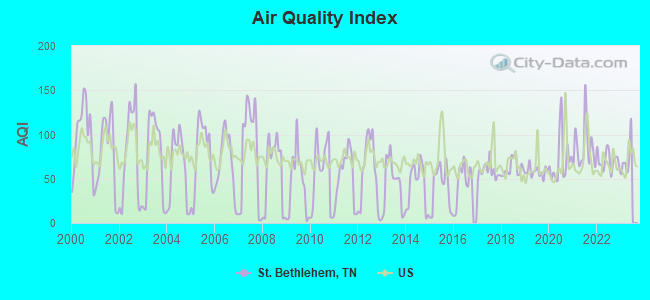
Air Quality Index (AQI) level in 2022 was 70.8. This is about average.
| City: | 70.8 |
| U.S.: | 72.6 |
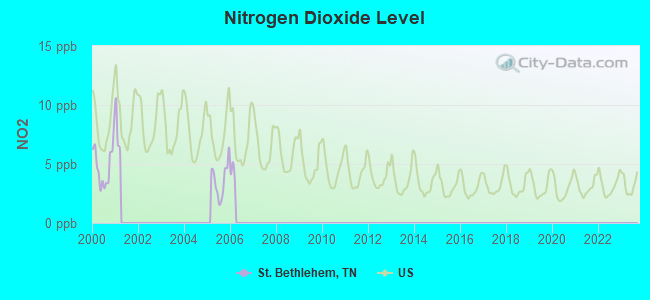
Nitrogen Dioxide (NO2) [ppb] level in 2005 was 3.65. This is significantly better than average. Closest monitor was 4.5 miles away from the city center.
| City: | 3.65 |
| U.S.: | 5.11 |
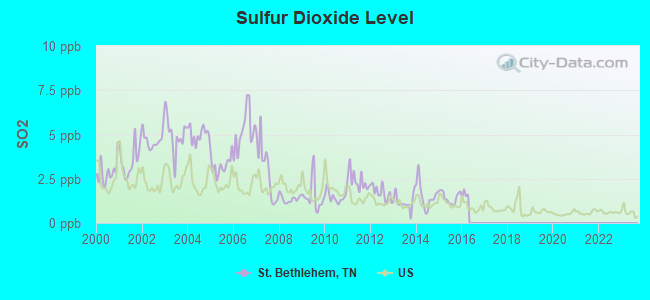
Sulfur Dioxide (SO2) [ppb] level in 2015 was 1.45. This is about average. Closest monitor was 4.9 miles away from the city center.
| City: | 1.45 |
| U.S.: | 1.51 |
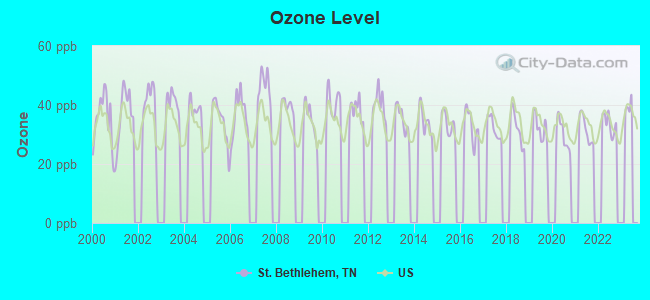
Ozone [ppb] level in 2022 was 33.7. This is about average. Closest monitor was 7.1 miles away from the city center.
| City: | 33.7 |
| U.S.: | 33.3 |
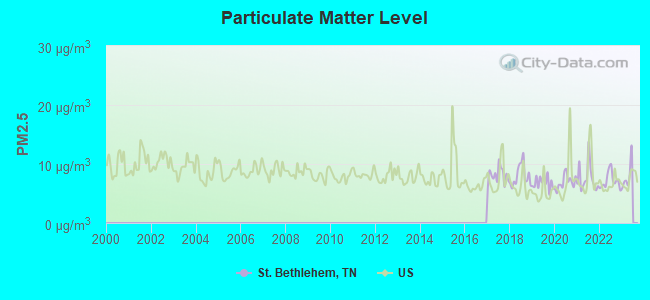
Particulate Matter (PM2.5) [µg/m3] level in 2022 was 7.16. This is about average. Closest monitor was 4.1 miles away from the city center.
| City: | 7.16 |
| U.S.: | 8.11 |
Tornado activity:
St. Bethlehem-area historical tornado activity is slightly above Tennessee state average. It is 59% greater than the overall U.S. average.
On 4/27/1970, a category F4 (max. wind speeds 207-260 mph) tornado 12.9 miles away from the St. Bethlehem place center killed 3 people and injured 85 people and caused between $500,000 and $5,000,000 in damages.
On 1/22/1999, a category F3 (max. wind speeds 158-206 mph) tornado 0.8 miles away from the place center injured 5 people and caused $73 million in damages.
Earthquake activity:
St. Bethlehem-area historical earthquake activity is significantly above Tennessee state average. It is 227% greater than the overall U.S. average.On 4/18/2008 at 09:36:59, a magnitude 5.4 (5.1 MB, 4.8 MS, 5.4 MW, 5.2 MW, Class: Moderate, Intensity: VI - VII) earthquake occurred 133.1 miles away from St. Bethlehem center
On 4/18/2008 at 09:36:59, a magnitude 5.2 (5.2 MW, Depth: 8.9 mi) earthquake occurred 133.1 miles away from the city center
On 6/18/2002 at 17:37:15, a magnitude 5.0 (4.3 MB, 4.6 MW, 5.0 LG) earthquake occurred 100.5 miles away from St. Bethlehem center
On 9/26/1990 at 13:18:51, a magnitude 5.0 (4.7 MB, 4.8 LG, 5.0 LG, Depth: 7.7 mi) earthquake occurred 130.6 miles away from St. Bethlehem center
On 6/10/1987 at 23:48:54, a magnitude 5.1 (4.9 MB, 4.4 MS, 4.6 MS, 5.1 LG) earthquake occurred 157.9 miles away from the city center
On 5/4/1991 at 01:18:54, a magnitude 5.0 (4.4 MB, 4.6 LG, 5.0 LG, Depth: 3.1 mi) earthquake occurred 140.8 miles away from St. Bethlehem center
Magnitude types: regional Lg-wave magnitude (LG), body-wave magnitude (MB), surface-wave magnitude (MS), moment magnitude (MW)
Natural disasters:
The number of natural disasters in Montgomery County (13) is near the US average (15).Major Disasters (Presidential) Declared: 10
Emergencies Declared: 1
Causes of natural disasters: Storms: 9, Floods: 8, Tornadoes: 6, Winds: 5, Winter Storms: 2, Flash Flood: 1, Hurricane: 1, Ice Storm: 1, Other: 1 (Note: some incidents may be assigned to more than one category).
Hospitals and medical centers near St. Bethlehem:
- GATEWAY MEDICAL CENTER Acute Care Hospitals (about 1 miles away; CLARKSVILLE, TN)
- DCI CUMBERLAND (Dialysis Facility, about 5 miles away; CLARKSVILLE, TN)
- GRACE HEALTHCARE OF CLARKSVILLE (Nursing Home, about 5 miles away; CLARKSVILLE, TN)
- CLARKSVILLE DIALYSIS (Dialysis Facility, about 5 miles away; CLARKSVILLE, TN)
- (CLOSED) GATEWAY HEALTH SYSTCU (Nursing Home, about 6 miles away; CLARKSVILLE, TN)
- GATEWAY HOSPICE (Hospital, about 6 miles away; CLARKSVILLE, TN)
- GATEWAY HOME HEALTH CLARKSVILLE (Home Health Center, about 6 miles away; CLARKSVILLE, TN)
Colleges/universities with over 2000 students nearest to St. Bethlehem:
- Austin Peay State University (about 6 miles; Clarksville, TN; Full-time enrollment: 8,621)
- Hopkinsville Community College (about 24 miles; Hopkinsville, KY; FT enrollment: 2,269)
- Tennessee State University (about 39 miles; Nashville, TN; FT enrollment: 7,341)
- Nashville State Community College (about 40 miles; Nashville, TN; FT enrollment: 6,436)
- Vanderbilt University (about 41 miles; Nashville, TN; FT enrollment: 10,518)
- Belmont University (about 42 miles; Nashville, TN; FT enrollment: 5,795)
- Trevecca Nazarene University (about 43 miles; Nashville, TN; FT enrollment: 2,223)
Points of interest:
Notable locations in St. Bethlehem: Swan Lake Golf Course (A), Peachers Mill (B), Clarksville-Montgomery County Corporate Business Park (C), Clarksville Fire Rescue Station 10 (D), Clarksville Fire Rescue Station 8 (E), Clarksville Fire Rescue Station 9 (F), Cloverlands (G), Saint Bethlehem Volunteer Fire Service Station 17 (H). Display/hide their locations on the map
Shopping Center: Governors Square Mall Shopping Center (1). Display/hide its location on the map
Churches in St. Bethlehem include: Fellowship Church (A), Spring Creek Church (B), Kirkwood Baptist Church (C), Needmore Church (D), Saint Bethlehem Church (E), Saint Matthews Church (F), Whites Chapel (G), Hollins Chapel (H), Olive Church (I). Display/hide their locations on the map
Reservoir: Dunbar Lake (A). Display/hide its location on the map
Streams, rivers, and creeks: Little West Fork (A), Browns Branch (B), Passenger Creek (C). Display/hide their locations on the map
Parks in St. Bethlehem include: Dunbar Cave State Park (1), Billy Dunlop Park (2), Port Royal State Park (3), Austin Peay Recreation Area (4), Saint Bethlehem Civitan Sports Complex (5). Display/hide their locations on the map
| This place: | 2.8 people |
| Tennessee: | 2.5 people |
| This place: | 61.4% |
| Whole state: | 69.8% |
| This place: | 4.3% |
| Whole state: | 4.2% |
Likely homosexual households (counted as self-reported same-sex unmarried-partner households)
- Lesbian couples: 0.2% of all households
- Gay men: 0.2% of all households
| This place: | 5.8% |
| Whole state: | 13.5% |
| This place: | 3.5% |
| Whole state: | 5.8% |
For population 15 years and over in St. Bethlehem:
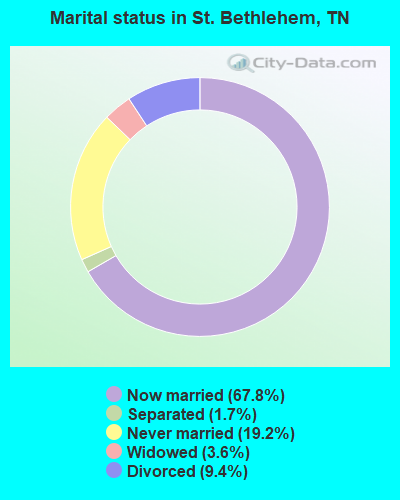
- Never married: 19.2%
- Now married: 67.8%
- Separated: 1.7%
- Widowed: 3.6%
- Divorced: 9.4%
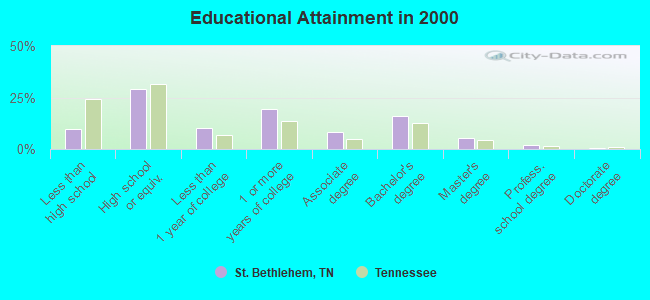
For population 25 years and over in St. Bethlehem:
- High school or higher: 90.2%
- Bachelor's degree or higher: 23.9%
- Graduate or professional degree: 7.9%
- Unemployed: 3.8%
- Mean travel time to work (commute): 23.9 minutes
| Here: | 9.5 |
| Tennessee average: | 13.3 |
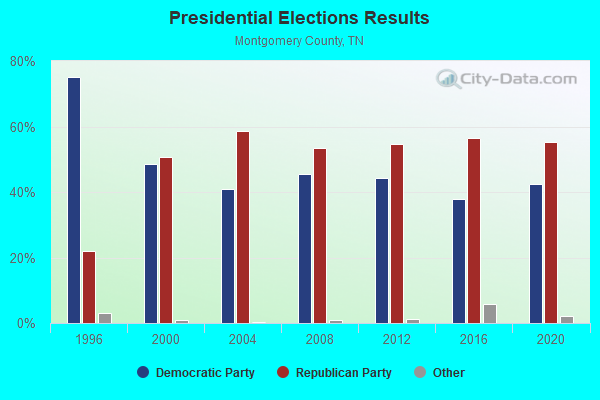
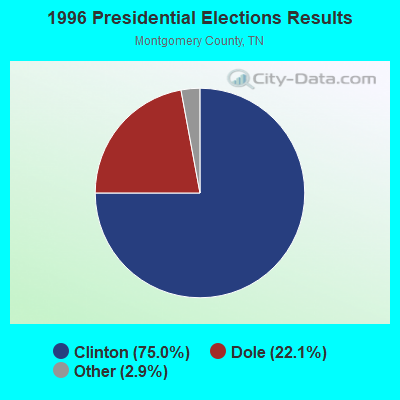
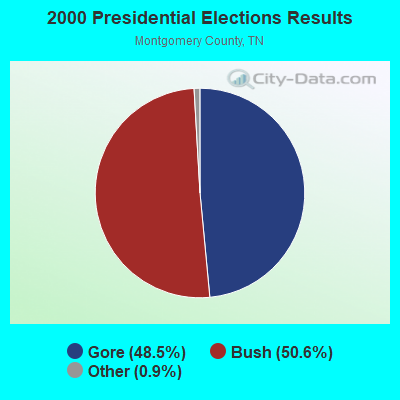
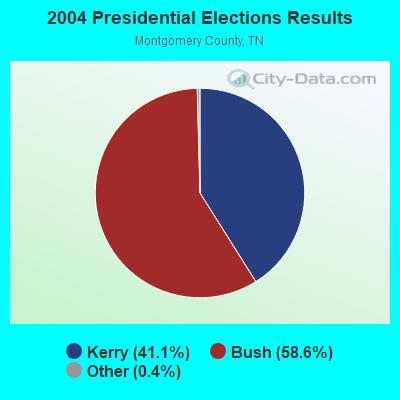
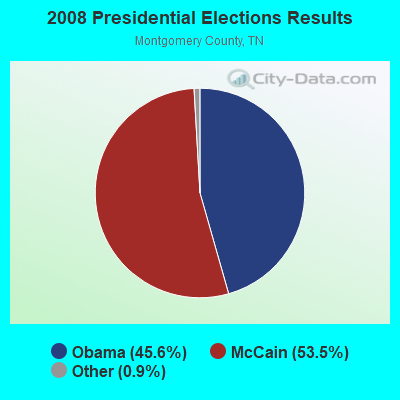
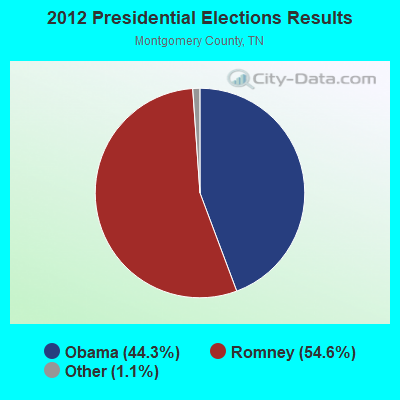
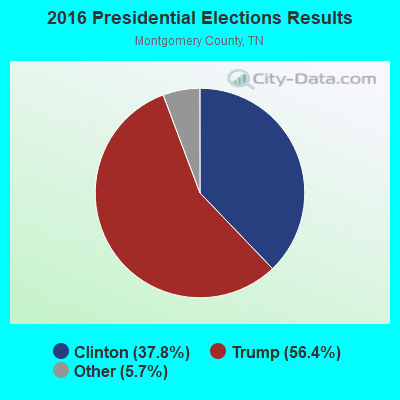
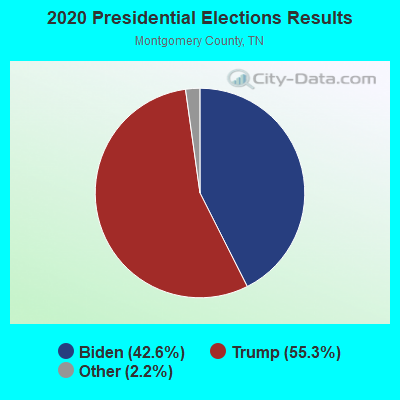
Graphs represent county-level data. Detailed 2008 Election Results
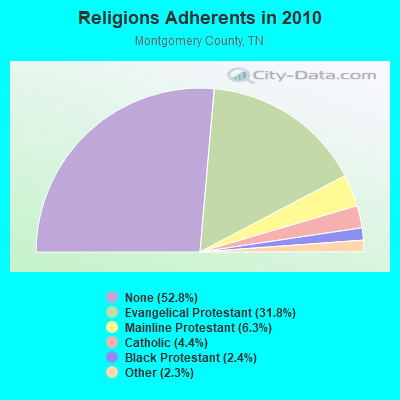
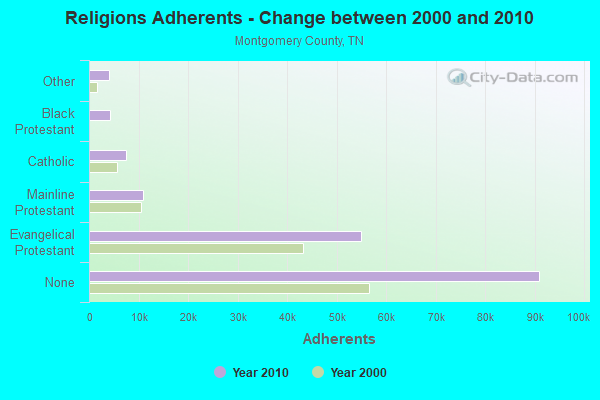
Religion statistics for St. Bethlehem, TN (based on Montgomery County data)
| Religion | Adherents | Congregations |
|---|---|---|
| Evangelical Protestant | 54,831 | 137 |
| Mainline Protestant | 10,902 | 38 |
| Catholic | 7,500 | 1 |
| Black Protestant | 4,146 | 17 |
| Other | 3,977 | 12 |
| Orthodox | 40 | 1 |
| None | 90,935 | - |
Food Environment Statistics:
| Montgomery County: | 1.04 / 10,000 pop. |
| Tennessee: | 1.99 / 10,000 pop. |
| Montgomery County: | 0.26 / 10,000 pop. |
| Tennessee: | 0.17 / 10,000 pop. |
| Montgomery County: | 0.52 / 10,000 pop. |
| Tennessee: | 0.65 / 10,000 pop. |
| Montgomery County: | 3.56 / 10,000 pop. |
| Tennessee: | 5.16 / 10,000 pop. |
| This county: | 6.48 / 10,000 pop. |
| State: | 6.56 / 10,000 pop. |
| Montgomery County: | 10.6% |
| Tennessee: | 11.4% |
| Here: | 29.6% |
| State: | 30.2% |
| This county: | 12.8% |
| State: | 13.5% |
14.27% of this county's 2021 resident taxpayers lived in other counties in 2020 ($50,111 average adjusted gross income)
| Here: | 14.27% |
| Tennessee average: | 8.49% |
0.36% of residents moved from foreign countries ($1,436 average AGI)
Montgomery County: 0.36% Tennessee average: 0.02%
Top counties from which taxpayers relocated into this county between 2020 and 2021:
| from Davidson County, TN | |
| from Christian County, KY | |
| from Rutherford County, TN |
11.80% of this county's 2020 resident taxpayers moved to other counties in 2021 ($49,800 average adjusted gross income)
| Here: | 11.80% |
| Tennessee average: | 7.40% |
0.25% of residents moved to foreign countries ($1,183 average AGI)
Montgomery County: 0.25% Tennessee average: 0.01%
Top counties to which taxpayers relocated from this county between 2020 and 2021:
| to Christian County, KY | |
| to Davidson County, TN | |
| to Stewart County, TN |
Strongest AM radio stations in St. Bethlehem:
- WJQI (540 AM; 1 kW; CLARKSVILLE, TN; Owner: SAGA COMMUNICATIONS OF TUCKESSEE, LLC)
- WCTZ (1550 AM; 2 kW; CLARKSVILLE, TN; Owner: WINSTON COMMUNICATIONS, INC.)
- WKDA (1200 AM; 50 kW; NASHVILLE, TN; Owner: RADIO NASHVILLE, INC.)
- WNQM (1300 AM; 50 kW; NASHVILLE, TN; Owner: WNQM. INC.)
- WSM (650 AM; 50 kW; NASHVILLE, TN; Owner: GAYLORD ENTERTAINMENT COMPANY)
- WLAC (1510 AM; 50 kW; NASHVILLE, TN; Owner: CAPSTAR TX LIMITED PARTNERSHIP)
- WAMB (1160 AM; 50 kW; DONELSON, TN; Owner: GREAT SOUTHERN BROADCASTING COMPANY, INC.)
- WJZM (1400 AM; 1 kW; CLARKSVILLE, TN; Owner: COMBERLAND RADIO PARTNERS, INC.)
- WJMR (1370 AM; 1 kW; FORT CAMPBELL, KY; Owner: SAGA COMMUNICATIONS OF TUCKESSEE, LLC)
- WPLN (1430 AM; 15 kW; MADISON, TN)
- WRUS (610 AM; 2 kW; RUSSELLVILLE, KY; Owner: LOGAN RADIO INCORPORATED)
- WDKN (1260 AM; 5 kW; DICKSON, TN; Owner: EDMISSON & EUBANK COMMUNICATIONS, INC.)
- WWAM (820 AM; daytime; 50 kW; JASPER, TN; Owner: SHELTON BROADCASTING SYSTEM)
Strongest FM radio stations in St. Bethlehem:
- WAPX-FM (91.7 FM; CLARKSVILLE, TN; Owner: AUSTIN PEAY STATE UNIVERSITY)
- WQZQ-FM (102.5 FM; DICKSON, TN; Owner: MONTGOMERY BROADCASTING COMPANY)
- WUBT (101.1 FM; RUSSELLVILLE, KY; Owner: CAPSTAR TX LIMITED PARTNERSHIP)
- WCVQ (107.9 FM; FORT CAMPBELL, KY; Owner: SAGA COMMUNICATIONS OF TUCKESSEE, LLC)
- WVVR (100.3 FM; HOPKINSVILLE, KY; Owner: SAGA COMMUNICATIONS OF TUCKESSEE, LLC)
- WMAK (96.3 FM; MURFREESBORO, TN; Owner: SOUTH CENTRAL COMMUNICATIONS CORP.)
- WGFX (104.5 FM; GALLATIN, TN; Owner: CITADEL BROADCASTING COMPANY)
- WRVW (107.5 FM; LEBANON, TN; Owner: CAPSTAR TX LIMITED PARTNERSHIP)
- WSM-FM (95.5 FM; NASHVILLE, TN; Owner: CUMULUS LICENSING CORP.)
- WZZP (97.5 FM; HOPKINSVILLE, KY; Owner: SAGA COMMUNICATIONS OF TUCKESSEE, LLC)
- WJXA (92.9 FM; NASHVILLE, TN; Owner: SOUTH CENTRAL COMMUNICATIONS CORP.)
- WNKJ (89.3 FM; HOPKINSVILLE, KY; Owner: PENNYRILE CHRISTIAN COMMUNITY, INC.)
- WKDF (103.3 FM; NASHVILLE, TN; Owner: CITADEL BROADCASTING COMPANY)
- WNRQ (105.9 FM; NASHVILLE, TN; Owner: CAPSTAR TX LIMITED PARTNERSHIP)
- W201AQ (88.1 FM; CLARKSVILLE, TN; Owner: WAY-FM MEDIA GROUP, INC.)
- W258AD (99.5 FM; CLARKSVILLE, TN; Owner: TREVECCA NAZARENE UNIVERSITY)
- WQXQ (101.9 FM; CENTRAL CITY, KY; Owner: STARLIGHT BROADCASTING CO., INC.)
- WSIX-FM (97.9 FM; NASHVILLE, TN; Owner: CAPSTAR TX LIMITED PARTNERSHIP)
- WPLN-FM (90.3 FM; NASHVILLE, TN; Owner: NASHVILLE PUBLIC RADIO)
- WAYM (88.7 FM; COLUMBIA, TN; Owner: WAY-FM MEDIA GROUP, INC.)
TV broadcast stations around St. Bethlehem:
- WTVF (Channel 5; NASHVILLE, TN; Owner: NEWSCHANNEL 5 NETWORK, LP)
- WNPX (Channel 28; COOKEVILLE, TN; Owner: PAXSON COMMUNICATIONS LICENSE COMPANY, LLC)
- WUXP-TV (Channel 30; NASHVILLE, TN; Owner: WUXP LICENSEE, LLC)
- WSMV-TV (Channel 4; NASHVILLE, TN; Owner: MEREDITH CORPORATION)
- WZTV (Channel 17; NASHVILLE, TN; Owner: WZTV LICENSEE, LLC)
- WCKV-LP (Channel 49; CLARKSVILLE, ETC., TN; Owner: TN MEDIA GROUP, INC.)
- WPGD (Channel 50; HENDERSONVILLE, TN; Owner: TRINITY BROADCASTING NETWORK)
- WKMA-TV (Channel 35; MADISONVILLE, KY; Owner: KENTUCKY AUTHORITY FOR EDUCATIONAL TV)
- WNPX-LP (Channel 20; NASHVILLE, TN; Owner: PAXSON COMMUNICATIONS LPTV, INC.)
FCC Registered Microwave Towers:
1- TINY TOWN, 1.5 Miles Sw Of Us Route 24 & 79 (Lat: 36.585222 Lon: -87.301361), Type: Mast, Structure height: 41.2 m, Call Sign: WPVI722,
Assigned Frequencies: 19305.0 MHz, Grant Date: 05/30/2012, Expiration Date: 06/24/2022, Cancellation Date: 12/21/2018, Certifier: Kyle B Entz, Registrant: Sprint Corporation, 12502 Sunrise Valley Drive, M/S: Varesa0209, Reston, VA 20196, Phone: (800) 572-8256, Fax: (703) 433-4483, Email:
FCC Registered Paging Towers:
1- 937 Needmore Road (Lat: 36.586417 Lon: -87.342500), Overall height: 79.2 m, Call Sign: WQZD507,
Assigned Frequencies: 931.937 MHz, Grant Date: 04/23/2019, Expiration Date: 04/01/2029, Certifier: J. Roy Pottle, Registrant: Wilkinson Barker Knauer, LLP, 1800 M Street, N.W., Suite 800n, Washington, DC 20036, Phone: (202) 783-4141, Fax: (202) 783-5851, Email:
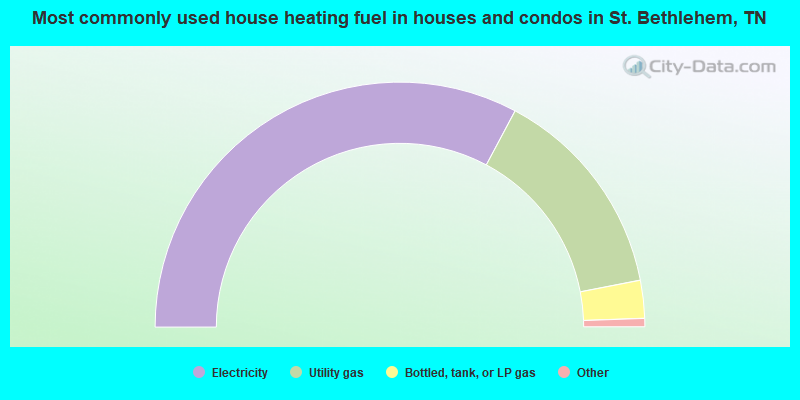
- 65.6%Electricity
- 28.3%Utility gas
- 5.0%Bottled, tank, or LP gas
- 0.7%Fuel oil, kerosene, etc.
- 0.4%Wood
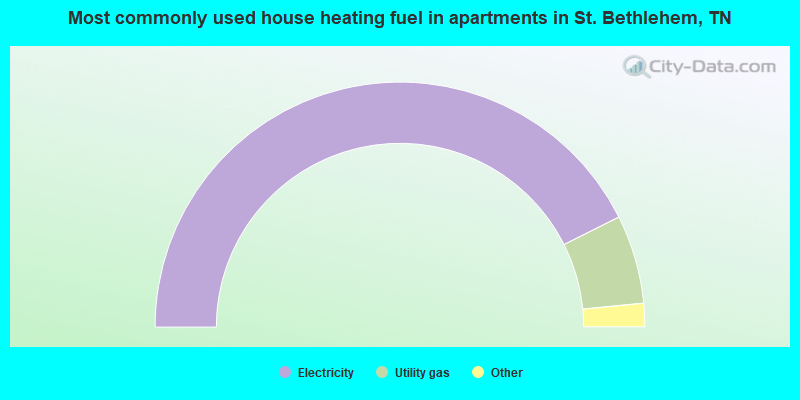
- 85.2%Electricity
- 11.7%Utility gas
- 1.2%Bottled, tank, or LP gas
- 1.0%Fuel oil, kerosene, etc.
- 0.8%No fuel used
St. Bethlehem compared to Tennessee state average:
- Unemployed percentage significantly below state average.
- Median age significantly below state average.
- Foreign-born population percentage significantly below state average.
- Renting percentage significantly below state average.
- Length of stay since moving in significantly above state average.
- Number of rooms per house significantly below state average.
- House age significantly below state average.
St. Bethlehem on our top lists:
- #5 on the list of "Top 101 cities with largest percentage of females in industries: printing and related support activities (population 5,000+)"
- #13 on the list of "Top 101 cities with largest percentage of males in industries: alcoholic beverages merchant wholesalers (population 5,000+)"
- #28 on the list of "Top 101 cities with largest percentage of males in occupations: drafters, engineering, and mapping technicians (population 5,000+)"
- #32 on the list of "Top 101 cities with largest percentage of males in occupations: assemblers and fabricators (population 5,000+)"
- #37 on the list of "Top 101 cities with largest percentage of males in industries: printing and related support activities (population 5,000+)"
- #44 on the list of "Top 101 cities with largest percentage of males in industries: machinery (population 5,000+)"
- #50 on the list of "Top 101 cities with largest percentage of females in industries: department and other general merchandise stores (population 5,000+)"
- #56 on the list of "Top 101 cities with largest percentage of females in industries: alcoholic beverages merchant wholesalers (population 5,000+)"
- #58 on the list of "Top 101 cities with largest percentage of males in industries: electrical equipment, appliances, and components (population 5,000+)"
- #61 on the list of "Top 101 cities with largest percentage of females in occupations: printing workers (population 5,000+)"
- #63 on the list of "Top 101 cities with largest percentage of males in industries: building material and garden equipment and supplies dealers (population 5,000+)"
- #67 on the list of "Top 101 cities with largest percentage of males in industries: music stores (population 5,000+)"
- #70 on the list of "Top 101 cities with largest percentage of males in occupations: air transportation workers (population 5,000+)"
- #70 on the list of "Top 101 cities with largest percentage of females in occupations: child care workers (population 5,000+)"
- #77 on the list of "Top 101 cities with largest percentage of females in industries: gasoline stations (population 5,000+)"
- #78 on the list of "Top 101 cities with largest percentage of males in occupations: other transportation workers (population 5,000+)"
- #100 on the list of "Top 101 cities with largest percentage of females in industries: recyclable material merchant wholesalers (population 5,000+)"
- #101 on the list of "Top 101 cities with largest percentage of females in industries: electrical equipment, appliances, and components (population 5,000+)"
- #4 on the list of "Top 101 counties with the lowest percentage of residents that drank alcohol in the past 30 days"
- #11 on the list of "Top 101 counties with the highest number of births per 1000 residents 2007-2013"
- #15 on the list of "Top 101 counties with the highest percentage of residents relocating from other counties between 2010 and 2011 (pop. 50,000+)"
- #17 on the list of "Top 101 counties with the largest increase in the number of births per 1000 residents 2000-2006 to 2007-2013 (pop 50,000+)"
- #21 on the list of "Top 101 counties with the highest percentage of residents relocating to other counties in 2011 (pop. 50,000+)"