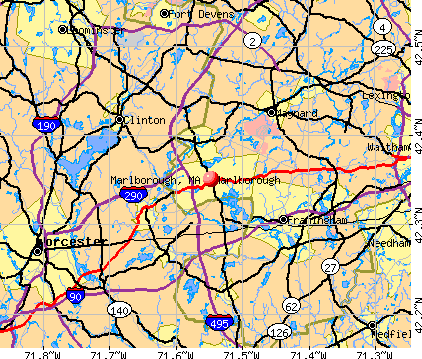
Marlborough, Massachusetts
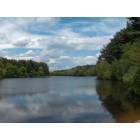
Marlborough: Sudbury Reservoir
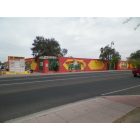
Marlborough
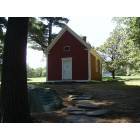
Marlborough: Mary's Little Red Schoolhouse, by the Martha Mary Chapel, Wayside Inn User comment: This is in Sudbury
- add
your
Submit your own pictures of this city and show them to the world
- OSM Map
- General Map
- Google Map
- MSN Map
Population change since 2000: +13.0%
 |
| Males: 19,794 | |
| Females: 21,177 |
| Median resident age: | 38.6 years |
| Massachusetts median age: | 40.3 years |
Zip codes: 01752.
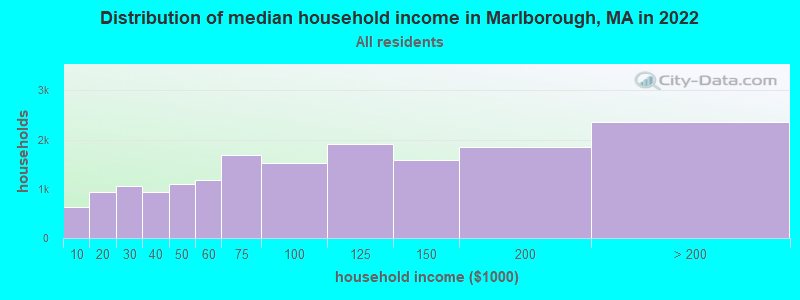
| Marlborough: | $92,255 |
| MA: | $94,488 |
Estimated per capita income in 2022: $46,148 (it was $28,723 in 2000)
Marlborough city income, earnings, and wages data
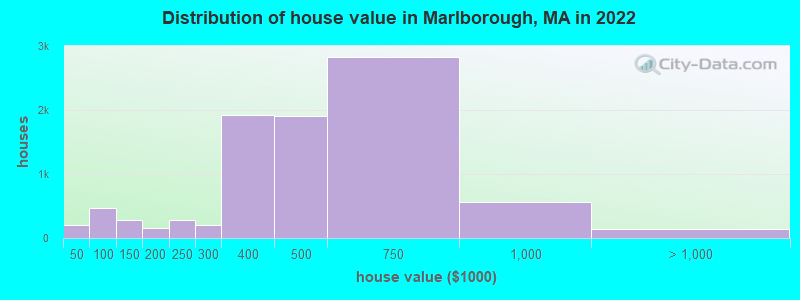
Estimated median house or condo value in 2022: $464,123 (it was $181,500 in 2000)
| Marlborough: | $464,123 |
| MA: | $534,700 |
Mean prices in 2022: all housing units: $469,047; detached houses: $514,011; townhouses or other attached units: $426,947; in 2-unit structures: $469,508; in 3-to-4-unit structures: $305,828; in 5-or-more-unit structures: $285,334; mobile homes: $54,431
Median gross rent in 2022: $1,642.
(9.2% for White Non-Hispanic residents, 6.3% for Black residents, 9.8% for Hispanic or Latino residents, 100.0% for Native Hawaiian and other Pacific Islander residents, 11.8% for other race residents, 6.6% for two or more races residents)
Detailed information about poverty and poor residents in Marlborough, MA


Compare current foreclosures in Marlborough, MA:
| Photo | Address | Area | Beds / Baths | Price | Details |
|---|---|---|---|---|---|

|
#1
Dicenzo Blvd # 260
Marlborough, MA 01752
|
1,359 sq. feet
|
2 baths 3 beds |
show details | |

|
#2
Sudbury St
Marlborough, MA 01752
|
2,048 sq. feet
|
2 baths 4 beds |
show details | |

|
#3
Violetwood Cir
Marlborough, MA 01752
|
1,784 sq. feet
|
2 baths 3 beds |
show details | |

|
#4
Bruce Rd
Marlborough, MA 01752
|
864 sq. feet
|
1 baths 2 beds |
show details | |

|
#5
Karopulios Dr
Marlborough, MA 01752
|
1,540 sq. feet
|
2 baths 2 beds |
show details | |

|
#6
Country Ln
Marlborough, MA 01752
|
2,352 sq. feet
|
4 baths 3 beds |
show details | |

|
#7
Berlin Rd
Marlborough, MA 01752
|
1,603 sq. feet
|
2 baths 3 beds |
show details | |

|
#8
Danjou Dr
Marlborough, MA 01752
|
1,753 sq. feet
|
2 baths 4 beds |
show details | |

|
#9
Concord Rd
Marlborough, MA 01752
|
3,008 sq. feet
|
3 baths 4 beds |
show details | |

|
#10
Azalea Ln
Marlborough, MA 01752
|
1,359 sq. feet
|
2 baths 2 beds |
show details |
| Photo | Address | Area | Beds / Baths | Price | Details |
|---|---|---|---|---|---|

|
#11
Sunshine Dr
Marlborough, MA 01752
|
1,121 sq. feet
|
1 baths 3 beds |
show details | |

|
#12
Dow Pl
Marlborough, MA 01752
|
1,236 sq. feet
|
1 baths 3 beds |
show details | |

|
#13
Sudbury St
Marlborough, MA 01752
|
2,048 sq. feet
|
2 baths 4 beds |
show details | |

|
#14
Pleasant St
Marlborough, MA 01752
|
1,372 sq. feet
|
1 baths 3 beds |
show details | |

|
#15
Pioneer Trl
Marlborough, MA 01752
|
1,267 sq. feet
|
2 baths 3 beds |
show details | |

|
#16
Country Ln
Marlborough, MA 01752
|
3,414 sq. feet
|
3 baths 6 beds |
show details | |

|
#17
Ridge Rd
Marlborough, MA 01752
|
1,409 sq. feet
|
1 baths 3 beds |
show details | |

|
#18
Liberty St
Marlborough, MA 01752
|
3,170 sq. feet
|
2 baths 4 beds |
show details | |

|
#19
Stow Rd
Marlborough, MA 01752
|
3,660 sq. feet
|
2 baths 4 beds |
show details | |

|
#20
Brimsmead St
Marlborough, MA 01752
|
1,588 sq. feet
|
1 baths 3 beds |
show details |
| Photo | Address | Area | Beds / Baths | Price | Details |
|---|---|---|---|---|---|

|
#21
Howe St
Marlborough, MA 01752
|
1,132 sq. feet
|
1 baths 3 beds |
show details | |

|
#22
Elm St Apt 7
Marlborough, MA 01752
|
- sq. feet
|
- baths - beds |
show details | |

|
#23
Greendale Ave
Marlborough, MA 01752
|
- sq. feet
|
- baths - beds |
show details | |

|
#24
Lincoln St # 311
Marlborough, MA 01752
|
- sq. feet
|
- baths - beds |
show details | |

|
#25
Saint Martin Dr # 3
Marlborough, MA 01752
|
- sq. feet
|
- baths - beds |
show details | |

|
#26
Mayflower Cir
Marlborough, MA 01752
|
- sq. feet
|
- baths - beds |
show details | |

|
Check over 1 million property listings on Foreclosure.com!
|
browse all offers | |||


- 24,48259.4%White alone
- 7,30517.7%Hispanic
- 4,65011.3%Two or more races
- 2,3765.8%Other race alone
- 2,2235.4%Asian alone
- 1,3643.3%Black alone
- 90.02%American Indian alone
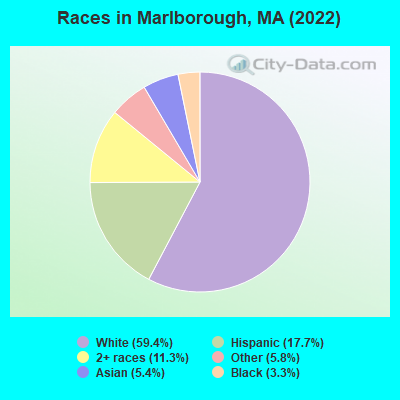
Races in Marlborough detailed stats: ancestries, foreign born residents, place of birth
According to our research of Massachusetts and other state lists, there were 14 registered sex offenders living in Marlborough, Massachusetts as of April 27, 2024.
The ratio of all residents to sex offenders in Marlborough is 2,865 to 1.
The ratio of registered sex offenders to all residents in this city is lower than the state average.
Type |
2009 |
2010 |
2011 |
2012 |
2013 |
2014 |
2015 |
2016 |
2017 |
2018 |
2019 |
2020 |
2021 |
2022 |
|---|---|---|---|---|---|---|---|---|---|---|---|---|---|---|
| Murders (per 100,000) | 0 (0.0) | 0 (0.0) | 0 (0.0) | 0 (0.0) | 0 (0.0) | 0 (0.0) | 0 (0.0) | 0 (0.0) | 0 (0.0) | 0 (0.0) | 0 (0.0) | 1 (2.5) | 0 (0.0) | 0 (0.0) |
| Rapes (per 100,000) | 11 (28.3) | 14 (36.4) | 10 (25.8) | 12 (30.6) | 18 (45.5) | 19 (47.8) | 13 (32.6) | 15 (37.6) | 16 (40.1) | 36 (89.9) | 17 (42.9) | 21 (53.2) | 25 (63.0) | 23 (56.5) |
| Robberies (per 100,000) | 20 (51.5) | 8 (20.8) | 11 (28.4) | 7 (17.8) | 17 (43.0) | 7 (17.6) | 14 (35.1) | 8 (20.1) | 8 (20.0) | 17 (42.4) | 15 (37.8) | 6 (15.2) | 9 (22.7) | 12 (29.5) |
| Assaults (per 100,000) | 151 (389.0) | 140 (363.6) | 162 (418.2) | 99 (252.3) | 121 (306.1) | 109 (274.2) | 114 (285.7) | 137 (343.4) | 129 (323.2) | 116 (289.6) | 117 (294.9) | 123 (311.4) | 109 (274.7) | 138 (338.9) |
| Burglaries (per 100,000) | 118 (304.0) | 111 (288.3) | 129 (333.0) | 112 (285.4) | 120 (303.6) | 100 (251.6) | 62 (155.4) | 86 (215.5) | 67 (167.8) | 53 (132.3) | 71 (179.0) | 29 (73.4) | 47 (118.4) | 40 (98.2) |
| Thefts (per 100,000) | 589 (1,517) | 599 (1,556) | 610 (1,575) | 548 (1,396) | 604 (1,528) | 565 (1,421) | 485 (1,216) | 453 (1,135) | 517 (1,295) | 379 (946.3) | 436 (1,099) | 297 (751.9) | 328 (826.6) | 309 (758.8) |
| Auto thefts (per 100,000) | 66 (170.0) | 35 (90.9) | 35 (90.4) | 39 (99.4) | 32 (80.9) | 29 (73.0) | 20 (50.1) | 23 (57.6) | 30 (75.2) | 25 (62.4) | 25 (63.0) | 27 (68.4) | 36 (90.7) | 40 (98.2) |
| Arson (per 100,000) | 5 (12.9) | 3 (7.8) | 2 (5.2) | 4 (10.2) | 2 (5.1) | 3 (7.5) | 0 (0.0) | 2 (5.0) | 4 (10.0) | 2 (5.0) | 1 (2.5) | 5 (12.7) | 3 (7.6) | 4 (9.8) |
| City-Data.com crime index | 211.5 | 197.7 | 206.4 | 164.1 | 199.4 | 178.7 | 157.3 | 169.9 | 172.3 | 194.7 | 166.1 | 155.1 | 160.8 | 166.9 |
The City-Data.com crime index weighs serious crimes and violent crimes more heavily. Higher means more crime, U.S. average is 246.1. It adjusts for the number of visitors and daily workers commuting into cities.
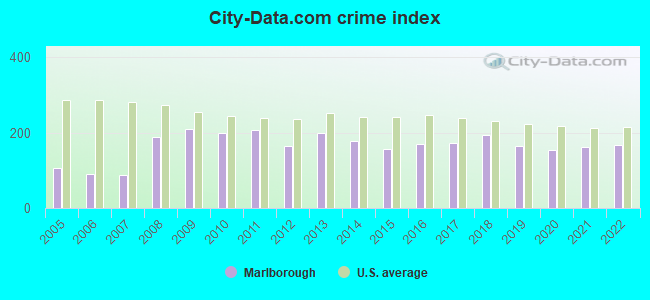
Crime rate in Marlborough detailed stats: murders, rapes, robberies, assaults, burglaries, thefts, arson
Full-time law enforcement employees in 2021, including police officers: 81 (70 officers - 66 male; 4 female).
| Officers per 1,000 residents here: | 1.76 |
| Massachusetts average: | 2.53 |
 Recent articles from our blog. Our writers, many of them Ph.D. graduates or candidates, create easy-to-read articles on a wide variety of topics.

 | Marlborough, Please think before you buy (27 replies) |
| Tell me about Marlborough (40 replies) |
| 2023 Real Estate Observations (5278 replies) |
| 2022 Real Estate Observations (1122 replies) |
| 2021 Real Estate Observations (1729 replies) |
| Boston job possibility.. (142 replies) |
Latest news from Marlborough, MA collected exclusively by city-data.com from local newspapers, TV, and radio stations
Ancestries: Brazilian (17.3%), Irish (7.9%), Italian (7.6%), American (6.8%), English (3.2%), Portuguese (3.1%).
Current Local Time: EST time zone
Elevation: 450 feet
Land area: 21.1 square miles.
Population density: 1,943 people per square mile (low).
12,471 residents are foreign born (20.2% Latin America, 4.9% Asia).
| This city: | 30.2% |
| Massachusetts: | 17.6% |
Median real estate property taxes paid for housing units with mortgages in 2022: $5,464 (1.2%)
Median real estate property taxes paid for housing units with no mortgage in 2022: $5,735 (1.3%)
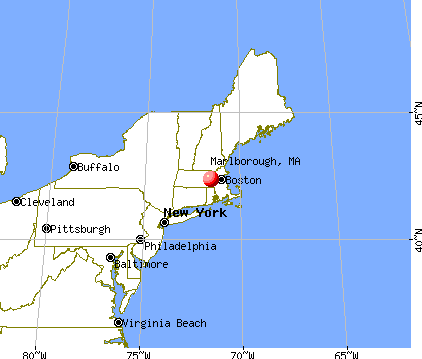
Nearest city with pop. 50,000+: Framingham, MA  (7.1 miles , pop. 66,910).
Nearest city with pop. 200,000+: Boston, MA (23.5 miles , pop. 589,141).
Nearest city with pop. 1,000,000+: Bronx, NY (159.0 miles , pop. 1,332,650).
Nearest cities:
), )Latitude: 42.35 N, Longitude: 71.55 W
Daytime population change due to commuting: +12,878 (+31.2%)
Workers who live and work in this city: 9,468 (42.8%)
Area code commonly used in this area: 978
Marlborough tourist attractions:
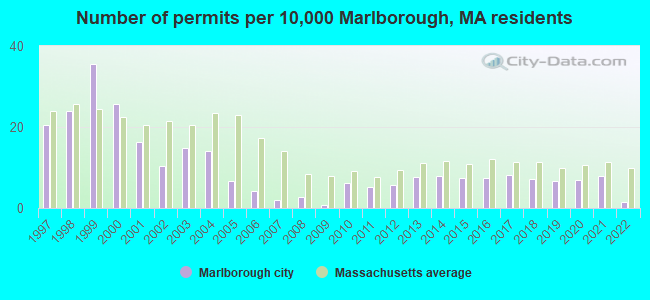
Single-family new house construction building permits:
- 2022: 5 buildings, average cost: $346,300
- 2021: 29 buildings, average cost: $140,900
- 2020: 25 buildings, average cost: $140,900
- 2019: 24 buildings, average cost: $140,900
- 2018: 26 buildings, average cost: $141,000
- 2017: 30 buildings, average cost: $140,600
- 2016: 27 buildings, average cost: $142,600
- 2015: 27 buildings, average cost: $132,900
- 2014: 29 buildings, average cost: $132,900
- 2013: 28 buildings, average cost: $132,900
- 2012: 21 buildings, average cost: $133,400
- 2011: 19 buildings, average cost: $130,600
- 2010: 22 buildings, average cost: $142,400
- 2009: 3 buildings, average cost: $132,300
- 2008: 10 buildings, average cost: $182,200
- 2007: 7 buildings, average cost: $182,700
- 2006: 15 buildings, average cost: $203,000
- 2005: 24 buildings, average cost: $275,000
- 2004: 51 buildings, average cost: $144,000
- 2003: 54 buildings, average cost: $146,100
- 2002: 38 buildings, average cost: $130,800
- 2001: 59 buildings, average cost: $127,400
- 2000: 93 buildings, average cost: $123,200
- 1999: 129 buildings, average cost: $91,500
- 1998: 87 buildings, average cost: $105,000
- 1997: 74 buildings, average cost: $112,300

| Here: | 3.3% |
| Massachusetts: | 3.5% |
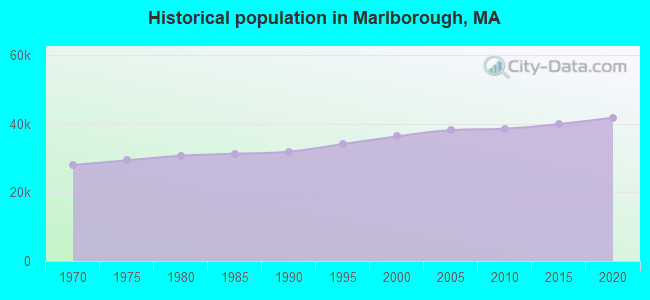
Population change in the 1990s: +4,425 (+13.9%).
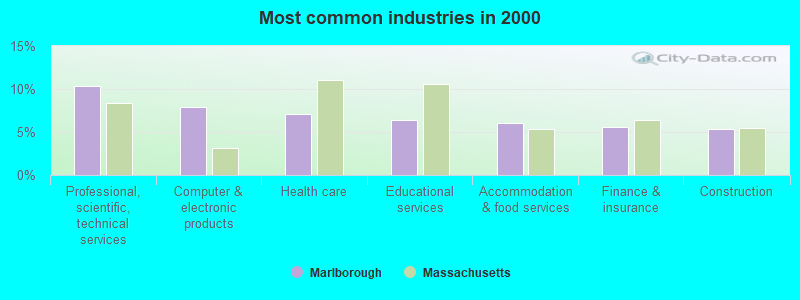
- Professional, scientific, technical services (10.3%)
- Computer & electronic products (8.0%)
- Health care (7.1%)
- Educational services (6.4%)
- Accommodation & food services (6.0%)
- Finance & insurance (5.6%)
- Construction (5.4%)
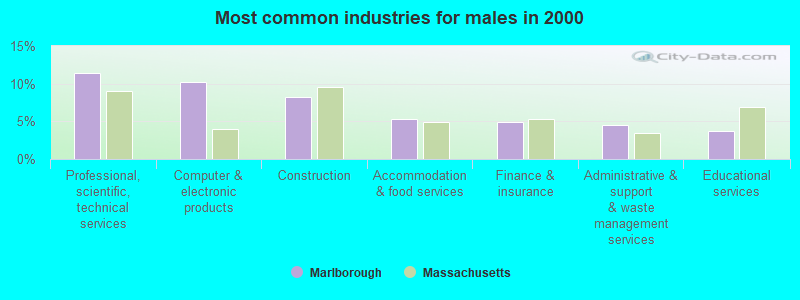
- Professional, scientific, technical services (11.4%)
- Computer & electronic products (10.3%)
- Construction (8.2%)
- Accommodation & food services (5.3%)
- Finance & insurance (4.9%)
- Administrative & support & waste management services (4.5%)
- Educational services (3.7%)
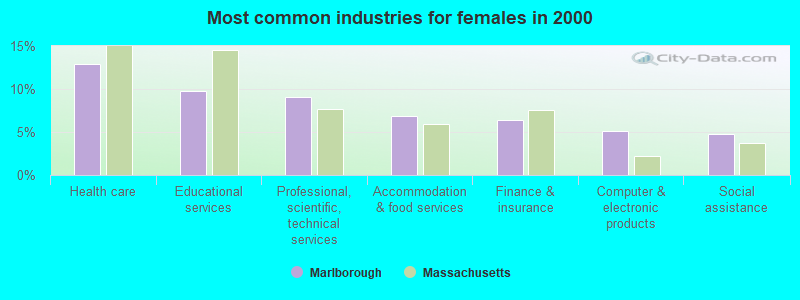
- Health care (12.9%)
- Educational services (9.8%)
- Professional, scientific, technical services (9.0%)
- Accommodation & food services (6.8%)
- Finance & insurance (6.4%)
- Computer & electronic products (5.2%)
- Social assistance (4.7%)
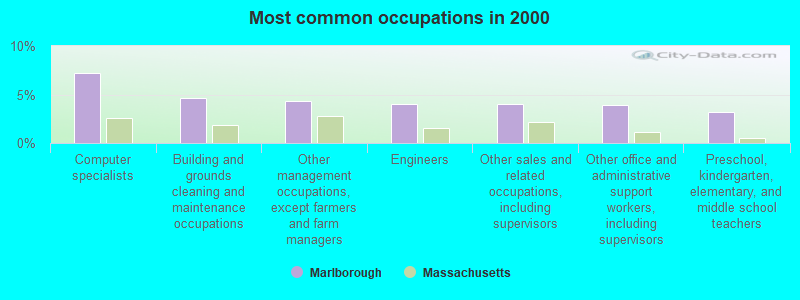
- Computer specialists (7.2%)
- Building and grounds cleaning and maintenance occupations (4.7%)
- Other management occupations, except farmers and farm managers (4.3%)
- Engineers (4.1%)
- Other sales and related occupations, including supervisors (4.0%)
- Other office and administrative support workers, including supervisors (3.9%)
- Preschool, kindergarten, elementary, and middle school teachers (3.2%)
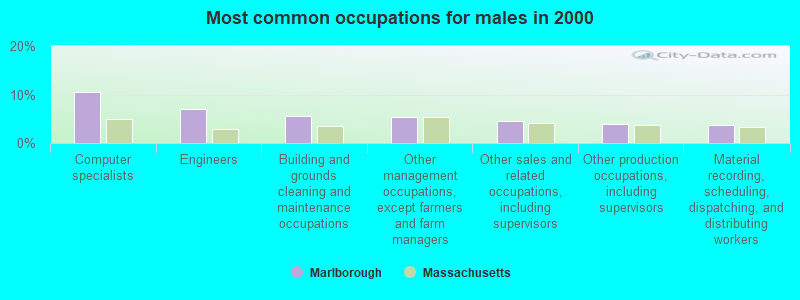
- Computer specialists (10.6%)
- Engineers (7.1%)
- Building and grounds cleaning and maintenance occupations (5.6%)
- Other management occupations, except farmers and farm managers (5.4%)
- Other sales and related occupations, including supervisors (4.6%)
- Other production occupations, including supervisors (3.9%)
- Material recording, scheduling, dispatching, and distributing workers (3.6%)

- Secretaries and administrative assistants (6.7%)
- Preschool, kindergarten, elementary, and middle school teachers (5.8%)
- Other office and administrative support workers, including supervisors (5.4%)
- Registered nurses (3.6%)
- Building and grounds cleaning and maintenance occupations (3.6%)
- Other sales and related occupations, including supervisors (3.4%)
- Retail sales workers, except cashiers (3.4%)
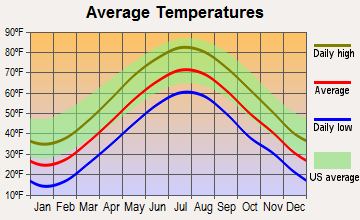
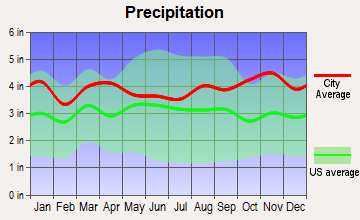
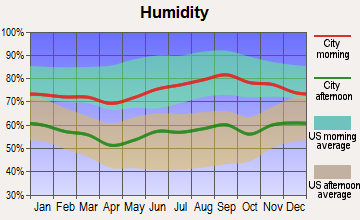
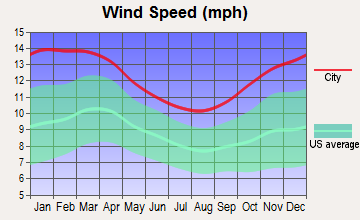
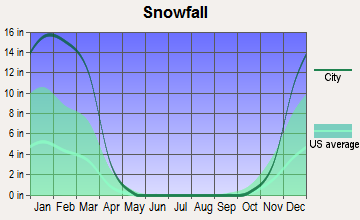
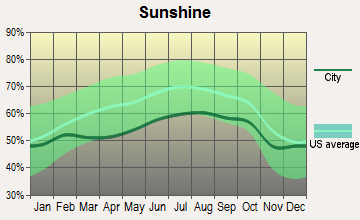
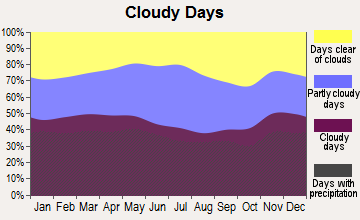
Average climate in Marlborough, Massachusetts
Based on data reported by over 4,000 weather stations
|
|

(lower is better)
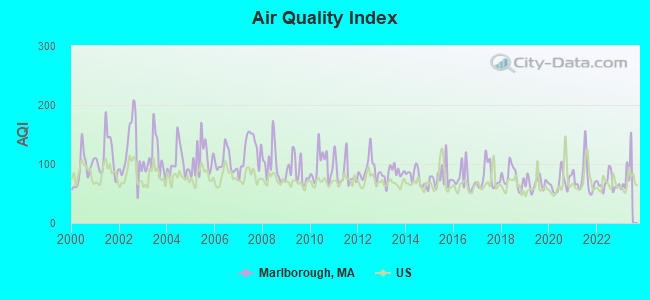
Air Quality Index (AQI) level in 2022 was 67.5. This is about average.
| City: | 67.5 |
| U.S.: | 72.6 |
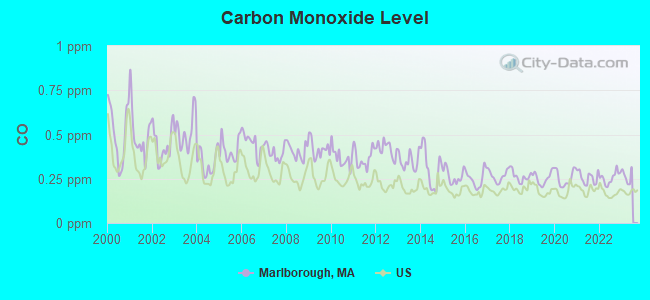
Carbon Monoxide (CO) [ppm] level in 2022 was 0.256. This is about average. Closest monitor was 14.0 miles away from the city center.
| City: | 0.256 |
| U.S.: | 0.251 |
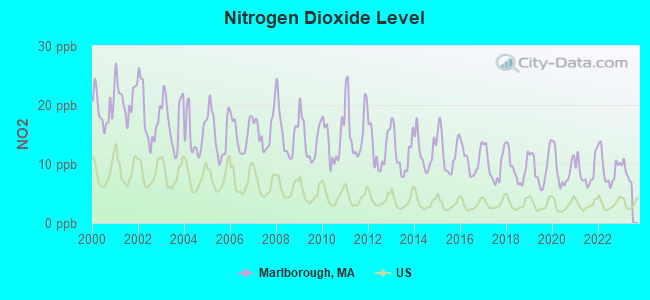
Nitrogen Dioxide (NO2) [ppb] level in 2022 was 9.22. This is significantly worse than average. Closest monitor was 5.9 miles away from the city center.
| City: | 9.22 |
| U.S.: | 5.11 |
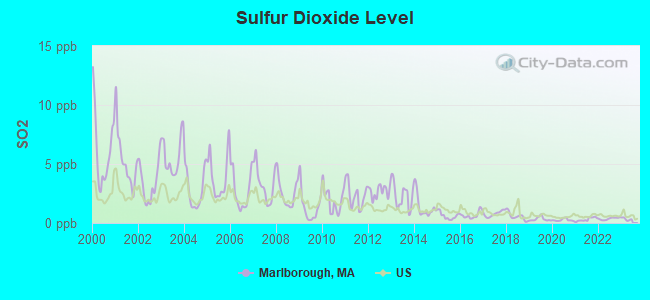
Sulfur Dioxide (SO2) [ppb] level in 2022 was 0.368. This is significantly better than average. Closest monitor was 5.9 miles away from the city center.
| City: | 0.368 |
| U.S.: | 1.515 |
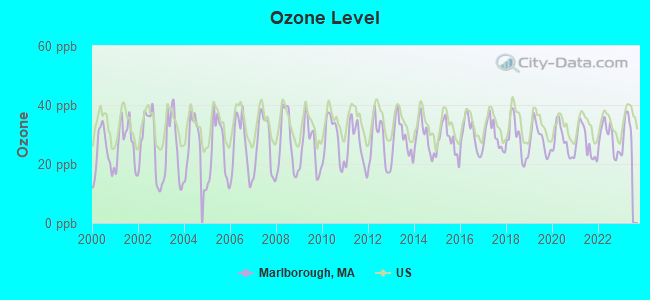
Ozone [ppb] level in 2022 was 28.7. This is about average. Closest monitor was 7.8 miles away from the city center.
| City: | 28.7 |
| U.S.: | 33.3 |
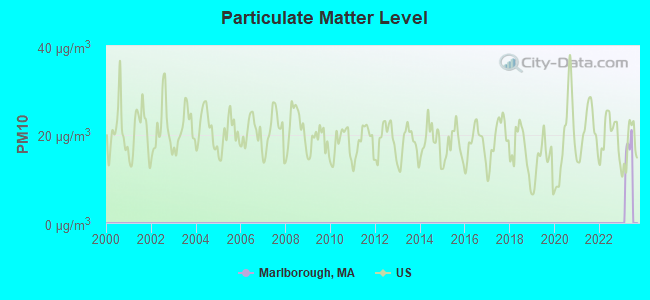
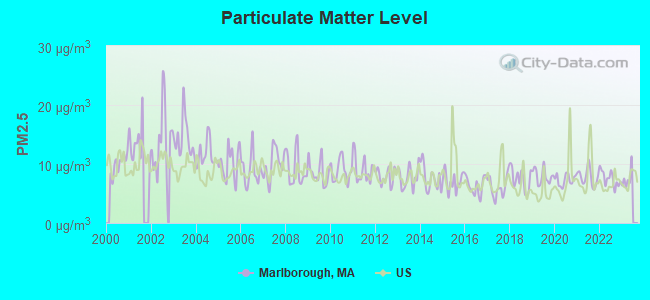
Particulate Matter (PM2.5) [µg/m3] level in 2022 was 7.52. This is about average. Closest monitor was 5.5 miles away from the city center.
| City: | 7.52 |
| U.S.: | 8.11 |
Tornado activity:
Marlborough-area historical tornado activity is slightly above Massachusetts state average. It is 27% smaller than the overall U.S. average.
On 6/9/1953, a category F4 (max. wind speeds 207-260 mph) tornado 3.8 miles away from the Marlborough city center killed 90 people and injured 1228 people and caused between $50,000,000 and $500,000,000 in damages.
On 10/3/1970, a category F3 (max. wind speeds 158-206 mph) tornado 15.2 miles away from the city center killed one person and caused between $50,000 and $500,000 in damages.
Earthquake activity:
Marlborough-area historical earthquake activity is significantly above Massachusetts state average. It is 72% smaller than the overall U.S. average.On 10/7/1983 at 10:18:46, a magnitude 5.3 (5.1 MB, 5.3 LG, 5.1 ML, Class: Moderate, Intensity: VI - VII) earthquake occurred 179.3 miles away from Marlborough center
On 4/20/2002 at 10:50:47, a magnitude 5.3 (5.3 ML, Depth: 3.0 mi) earthquake occurred 184.4 miles away from Marlborough center
On 1/19/1982 at 00:14:42, a magnitude 4.7 (4.5 MB, 4.7 MD, 4.5 LG, Class: Light, Intensity: IV - V) earthquake occurred 79.5 miles away from Marlborough center
On 4/20/2002 at 10:50:47, a magnitude 5.2 (5.2 MB, 4.2 MS, 5.2 MW, 5.0 MW) earthquake occurred 183.6 miles away from Marlborough center
On 10/16/2012 at 23:12:25, a magnitude 4.7 (4.7 ML, Depth: 10.0 mi) earthquake occurred 97.3 miles away from the city center
On 8/22/1992 at 12:20:32, a magnitude 4.8 (4.8 MB, 3.8 MS, 4.7 LG, Depth: 6.2 mi) earthquake occurred 233.5 miles away from the city center
Magnitude types: regional Lg-wave magnitude (LG), body-wave magnitude (MB), duration magnitude (MD), local magnitude (ML), surface-wave magnitude (MS), moment magnitude (MW)
Natural disasters:
The number of natural disasters in Middlesex County (31) is a lot greater than the US average (15).Major Disasters (Presidential) Declared: 17
Emergencies Declared: 14
Causes of natural disasters: Floods: 12, Storms: 9, Hurricanes: 6, Snowstorms: 6, Winter Storms: 5, Blizzards: 2, Snows: 2, Explosion: 1, Heavy Rain: 1, Snowfall: 1, Water Main Break: 1, Wind: 1 (Note: some incidents may be assigned to more than one category).
Main business address for: EXACT SCIENCES CORP (SERVICES-COMMERCIAL PHYSICAL & BIOLOGICAL RESEARCH), SEPRACOR INC /DE/ (PHARMACEUTICAL PREPARATIONS), 3COM CORP (COMPUTER COMMUNICATIONS EQUIPMENT).
Hospitals and medical centers in Marlborough:
- MARLBOROUGH HOSPITAL (Voluntary non-profit - Private, provides emergency services, 157 UNION STREET)
- BRAEMOOR EAST OF MARLBORO (400 BOLTON ST)
- BRAEMOOR OF MARLBORO (121 NORTHBORO RD)
- KINDRED TRANSITIONAL CARE AND REHAB-MARLBOROUGH (400 BOLTON STREET)
- MARIE ESTHER HEALTH CENTER INC (720 BOSTON POST ROAD)
- MARLBOROUGH HILLS HEALTHCARE CENTER (121 NORTHBORO ROAD)
- FRESENIUS MEDICAL CARE OF MARLBOROUGH (360 CEDAR HILL STREET)
- DIVINE HEALTH LLC (576 BOSTON POST ROAD)
- SYNERGY HOME HEALTH CARE, INC (420 LAKESIDE AVENUE, SUITE 401)
Heliports located in Marlborough:
Amtrak stations near Marlborough:
- 9 miles: FRAMINGHAM (443 WAVERLY ST.) . Services: public payphones, snack bar, paid short-term parking, taxi stand, public transit connection.
- 15 miles: WORCESTER (WORCHESTER, 45 SHREWSBURY ST.) . Services: ticket office, fully wheelchair accessible, enclosed waiting area, public restrooms, public payphones, vending machines, free short-term parking, free long-term parking, call for taxi service, public transit connection.
College/University in Marlborough:
Colleges/universities with over 2000 students nearest to Marlborough:
- Framingham State University (about 7 miles; Framingham, MA; Full-time enrollment: 5,743)
- Quinsigamond Community College (about 13 miles; Worcester, MA; FT enrollment: 5,877)
- Wellesley College (about 13 miles; Wellesley, MA; FT enrollment: 2,658)
- Worcester Polytechnic Institute (about 15 miles; Worcester, MA; FT enrollment: 3,930)
- Babson College (about 15 miles; Wellesley, MA; FT enrollment: 3,230)
- Massachusetts Bay Community College (about 15 miles; Wellesley Hills, MA; FT enrollment: 3,636)
- Assumption College (about 15 miles; Worcester, MA; FT enrollment: 2,580)
Public high schools in Marlborough:
- MARLBOROUGH HIGH (Students: 1,566, Location: 431 BOLTON STREET, Grades: 9-12)
- ASSABET VALLEY VOCATIONAL HIGH SCHOOL (Students: 925, Location: 215 FITCHBURG STREET, Grades: 9-12)
- ADVANCED MATH AND SCIENCE ACADEMY CHARTER SCHOOL (Students: 409, Location: 201 FOREST STREET, Grades: 6-12, Charter school)
Private high schools in Marlborough:
Public elementary/middle schools in Marlborough:
- CHARLES JAWOREK SCHOOL (Students: 597, Location: 444 HOSMER STREET, Grades: KG-4)
- FRANCIS J KANE (Students: 471, Location: 520 FARM ROAD, Grades: KG-4)
- RICHER (Students: 439, Location: 80 FOLEY ROAD, Grades: KG-4)
- 1 LT CHARLES W. WHITCOMB SCHOOL (Location: 25 UNION STREET, Grades: 5-8)
Private elementary/middle school in Marlborough:
User-submitted facts and corrections:
- Synagogue in Marlborough: Temple Emanuel 150 Berlin Road Marlborough, Independent, Rabbi Cherie Koller-Fox
- Under Churches: Please include St. Matthias Roman Catholic Church. 409 Hemenway St.
Points of interest:
Notable locations in Marlborough: Boroughs Shopping Plaza (A), Marlborough Sewage Disposal (B), Boston Park West Industrial Park (C), Jericho Hill Ski Slope (D), Marlborough Country Club (E), Marlborough Industrial Park (F), Millham Water Treatment Plant (G), Westerly Water Pollution Control Facility (H), Marlborough Fire Department Station 2 (I), Marlborough Fire Department Station 3 (J), Marlborough Fire Department Station 1 Headquarters (K), Marlborough City Hall (L), Marlborough Middle School Library (M), Marlborough Public Library (N), Navin Park (O), Wilfred T Hood Medical Library (P), Temple Building (Q). Display/hide their locations on the map
Shopping Centers: Indian Head Shopping Mall (1), Post Road Shopping Center (2), Borough Shopping Center (3), Indian Head Shopping Center (4), Route 20 Shopping Center (5). Display/hide their locations on the map
Main business address in Marlborough include: EXACT SCIENCES CORP (A), SEPRACOR INC /DE/ (B), 3COM CORP (C). Display/hide their locations on the map
Churches in Marlborough include: Saint Marys Church (A), New Life Fellowship Nazarene Church (B), Immaculate Conception Church (C), Holy Trinity Episcopal Church (D), Greater Grace Christian Church (E), First Church of Christ Scientist (F), First Church Congregational (G), Evangelized Brazilian Church (H), The Church of Jesus Christ of Latter Day Saints (I). Display/hide their locations on the map
Cemeteries: Evergreen Cemetery (1), Wilson Street Cemetery (2), Immaculate Conception Cemetery (3), Spring Hill Cemetery (4), Rocklawn Cemetery (5), Saint Marys Cemetery (6), Robin Hill Cemetery (7). Display/hide their locations on the map
Lakes, reservoirs, and swamps: Howe Pond (A), Muddy Pond (B), Millham Reservoir (C), Hager Pond (D), Williams Lake (E), Broad Meadow Swamp (F), Crane Meadow (G), Flagg Swamp (H). Display/hide their locations on the map
Streams, rivers, and creeks: Broad Meadow Brook (A), Flagg Brook (B), Millham Brook (C), Mowry Brook (D), North Branch Brook (E), Sheep Fall Brook (F). Display/hide their locations on the map
Parks in Marlborough include: Korean Veterans Field (1), Ward Park (2), Concord Street Park (3), Williams Street Field (4), Fort Meadow Playground (5), Simpson Playground (6), Howe Playground (7). Display/hide their locations on the map
Beach: Memorial Beach (A). Display/hide its location on the map
Tourist attractions: Marlborough Grand Rental Station (Amusement & Theme Parks; 222 East Main Street) (1), S And C Carousel Inc (Amusement & Theme Parks; 601 Donald J Lynch Blvd) (2), LazerZone (Arcades & Amusements; 416 Boston Post Rd E) (3), Clayart Studio- Inc. (Arcades & Amusements; 505 Boston Post Road West) (4). Display/hide their approximate locations on the map
Hotels: Hampton Inn Boston / Marlborough (277 Boston Post Road West) (1), Comfort Inn Marlborough (880 Donald Lynch Boulevard) (2), Best Western Royal Plaza Hotel and Trade Center (181 Boston Post Rd W) (3), Best Western Royal Plaza Hotel & Trade Center (181 Boston Post Road East) (4), Homestead Village Guest Studios (19 Northboro Road East) (5), Best Western Royal Plaza (181 Boston Post Road West) (6), Embassy Suites Hotel (123 Boston Post Road West) (7), Homestead Village Guest Studios-Mar (19 Northboro Road East) (8), Homestead Boston Marlborough (19 Marlborough Avenue) (9). Display/hide their approximate locations on the map
Courts: Mass Commonwealth - District Court of Marlborough- Juvenile Probation (45 Williams Street) (1), Mass Commonwealth - District Court of Marlborough- Jury Stand-By Ser (45 Williams Street) (2). Display/hide their approximate locations on the map
Birthplace of: Marcia Cross - Actress, Carl Brigham - Professor, Charles Hudson (Massachusetts) - Politician, Crystal Eastman - Lawyer and feminist, Henry Rice (politician) - Politician, Mike Burns (soccer) - Soccer player, Richard H. Rice - Mechanical engineer, S. Herbert Howe - Mayor and politician in Massachusetts, Jim Reynolds - Baseball umpire, John Buckley (baseball) - Baseball player.
Drinking water stations with addresses in Marlborough and their reported violations in the past:
MARLBOROUGH DPW WATER DIV. (Population served: 38,000, Surface water):Past monitoring violations:
- Follow-up Or Routine LCR Tap M/R - In OCT-01-2012, Contaminant: Lead and Copper Rule. Follow-up actions: St AO (w/o penalty) issued (JUN-21-2013), St Compliance achieved (JUN-21-2013)
- Follow-up Or Routine LCR Tap M/R - In APR-01-2012, Contaminant: Lead and Copper Rule. Follow-up actions: St AO (w/o penalty) issued (JUN-21-2013), St Compliance achieved (JUN-21-2013)
- Follow-up Or Routine LCR Tap M/R - In JUL-01-2011, Contaminant: Lead and Copper Rule. Follow-up actions: St AO (w/o penalty) issued (APR-19-2012), St Compliance achieved (JUL-01-2012)
- Follow-up Or Routine LCR Tap M/R - In OCT-01-2009, Contaminant: Lead and Copper Rule. Follow-up actions: St AO (w/o penalty) issued (MAR-01-2010), St Compliance achieved (JUN-29-2010)
- Monitoring of Treatment (SWTR-Filter) - In FEB-2006. Follow-up actions: St AO (w/o penalty) issued (MAR-23-2006), St Compliance achieved (APR-02-2007)
- 2 regular monitoring violations
- 7 other older monitoring violations
| This city: | 2.5 people |
| Massachusetts: | 2.5 people |
| This city: | 62.8% |
| Whole state: | 63.0% |
| This city: | 7.3% |
| Whole state: | 7.0% |
Likely homosexual households (counted as self-reported same-sex unmarried-partner households)
- Lesbian couples: 0.4% of all households
- Gay men: 0.4% of all households
People in group quarters in Marlborough in 2010:
- 253 people in nursing facilities/skilled-nursing facilities
- 247 people in group homes intended for adults
- 72 people in other noninstitutional facilities
- 28 people in emergency and transitional shelters (with sleeping facilities) for people experiencing homelessness
- 28 people in workers' group living quarters and job corps centers
- 24 people in residential treatment centers for juveniles (non-correctional)
- 9 people in group homes for juveniles (non-correctional)
People in group quarters in Marlborough in 2000:
- 346 people in nursing homes
- 57 people in other nonhousehold living situations
- 42 people in religious group quarters
- 35 people in homes for the mentally retarded
- 9 people in other noninstitutional group quarters
Banks with most branches in Marlborough (2011 data):
- Bank of America, National Association: Solomon Pond Mall Branch, Boston Post Road Branch, Plaza Shopping Center Branch. Info updated 2009/11/18: Bank assets: $1,451,969.3 mil, Deposits: $1,077,176.8 mil, headquarters in Charlotte, NC, positive income, 5782 total offices, Holding Company: Bank Of America Corporation
- Marlborough Savings Bank: at 81 Granger Boulevard, branch established on 1860/04/03; Boston Post Road Branch at 71 Boston Post Road, branch established on 1971/09/27. Info updated 2010/10/21: Bank assets: $446.2 mil, Deposits: $367.7 mil, local headquarters, positive income, 6 total offices, Holding Company: Marlborough Bancshares Mhc
- Sovereign Bank, National Association: Marlborough Center Branch at 181 Main Street, branch established on 1878/01/01; Malborough Branch at 330 Boston Post Road, branch established on 2007/10/09. Info updated 2012/01/31: Bank assets: $78,146.9 mil, Deposits: $48,042.9 mil, headquarters in Wilmington, DE, positive income, Commercial Lending Specialization, 718 total offices, Holding Company: Banco Santander, S.A.
- People's United Bank: Marlborough Co-Operative Bank Branch at 175 Main Street, branch established on 1890/01/01; Post Road Plaza Branch at 234 East Main Street, branch established on 1995/10/16. Info updated 2012/02/16: Bank assets: $27,319.3 mil, Deposits: $20,835.4 mil, headquarters in Bridgeport, CT, positive income, Commercial Lending Specialization, 374 total offices
- Commerce Bank & Trust Company: Marlborough Branch at 322 Maple Street, branch established on 2002/11/25. Info updated 2006/10/06: Bank assets: $1,410.8 mil, Deposits: $1,187.6 mil, headquarters in Worcester, MA, positive income, Commercial Lending Specialization, 14 total offices, Holding Company: Commerce Bancshares Corp.
- Citibank, National Association: Marlborough Branch at 433 Lakeside Avenue, branch established on 2007/11/30. Info updated 2012/01/10: Bank assets: $1,288,658.0 mil, Deposits: $882,541.0 mil, headquarters in Sioux Falls, SD, positive income, International Specialization, 1048 total offices, Holding Company: Citigroup Inc.
- RBS Citizens, National Association: Marlboro Center Branch at 96 South Bolton Street, branch established on 1989/03/06. Info updated 2007/09/19: Bank assets: $106,940.6 mil, Deposits: $75,690.2 mil, headquarters in Providence, RI, positive income, 1135 total offices, Holding Company: Uk Financial Investments Limited
- Avidia Bank: Marlborough Branch at 256 Maple Street, branch established on 1997/05/05. Info updated 2010/01/04: Bank assets: $1,026.2 mil, Deposits: $801.2 mil, headquarters in Hudson, MA, positive income, Commercial Lending Specialization, 10 total offices, Holding Company: Assabet Valley Bancorp
- TD Bank, National Association: R. K. Executive Centre Branch at 193a Boston Post Road West, branch established on 1996/09/16. Info updated 2010/10/04: Bank assets: $188,912.6 mil, Deposits: $153,149.8 mil, headquarters in Wilmington, DE, positive income, 1314 total offices, Holding Company: Toronto-Dominion Bank, The
For population 15 years and over in Marlborough:
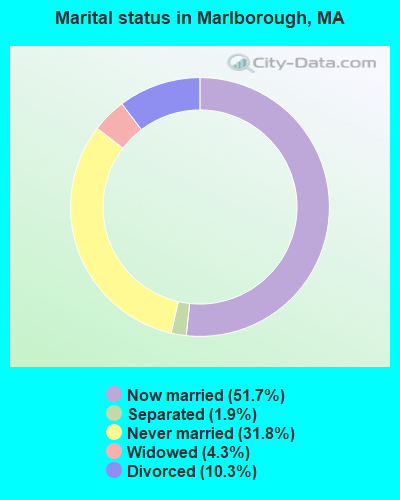
- Never married: 31.8%
- Now married: 51.7%
- Separated: 1.9%
- Widowed: 4.3%
- Divorced: 10.3%
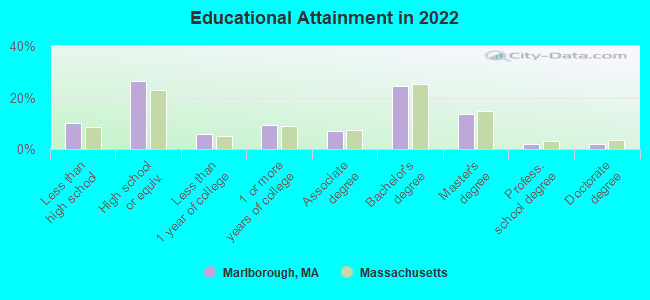
For population 25 years and over in Marlborough:
- High school or higher: 89.9%
- Bachelor's degree or higher: 40.6%
- Graduate or professional degree: 16.9%
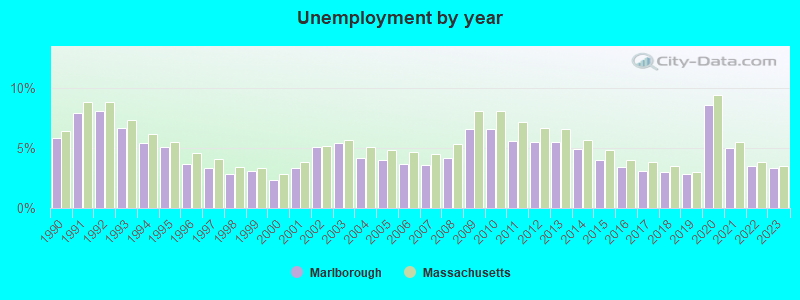
- Unemployed: 3.4%
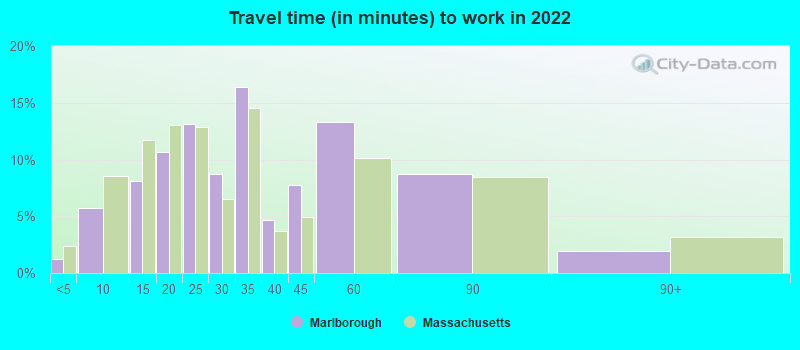
- Mean travel time to work (commute): 23.3 minutes
| Here: | 12.7 |
| Massachusetts average: | 13.0 |
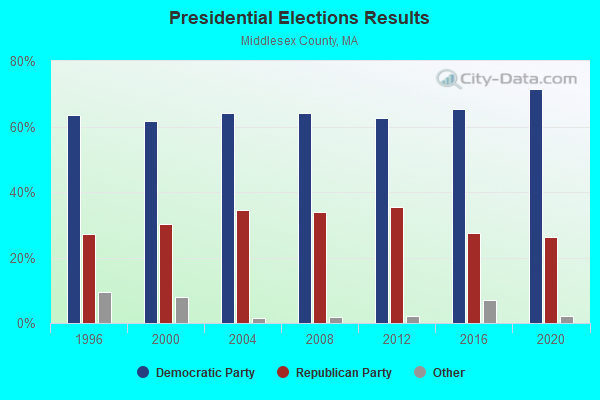
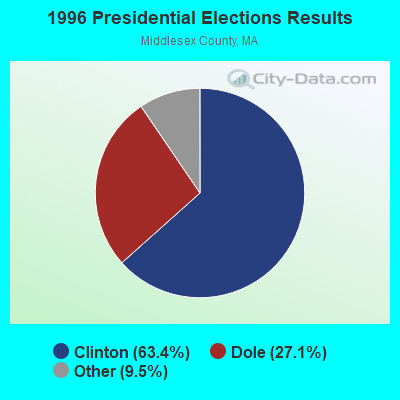
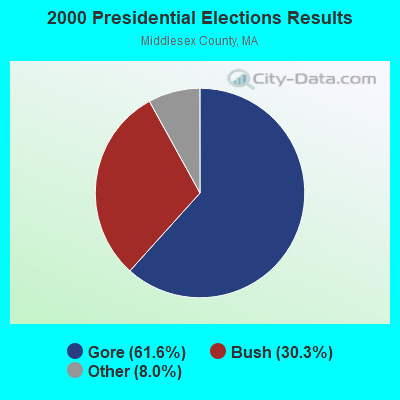
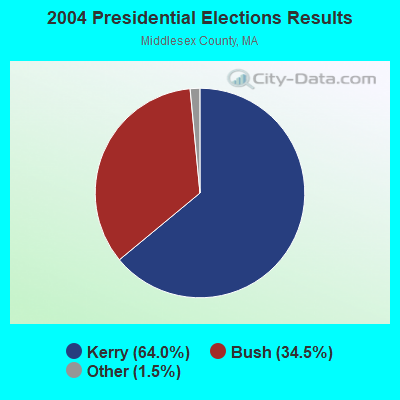
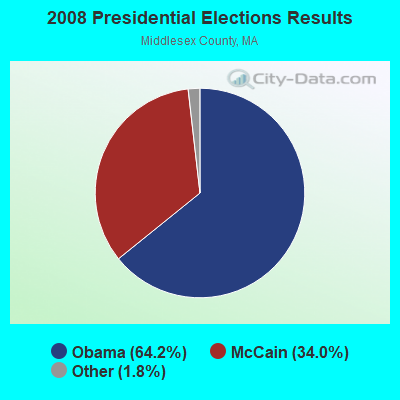
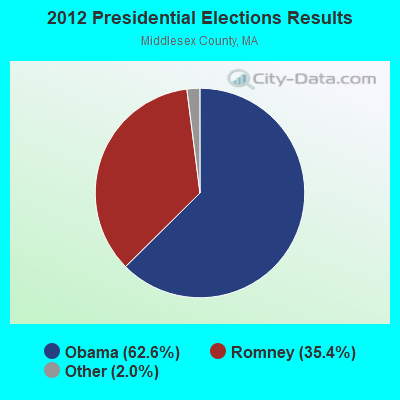
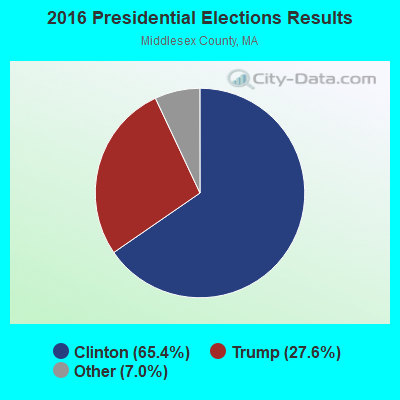
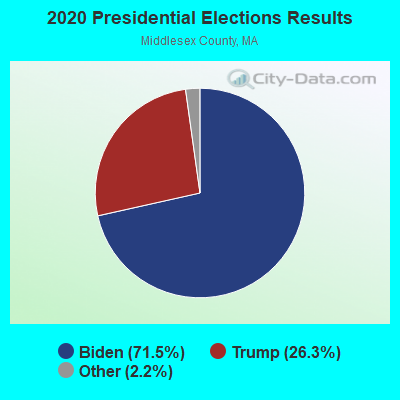
Graphs represent county-level data. Detailed 2008 Election Results
Religion statistics for Marlborough, MA (based on Middlesex County data)
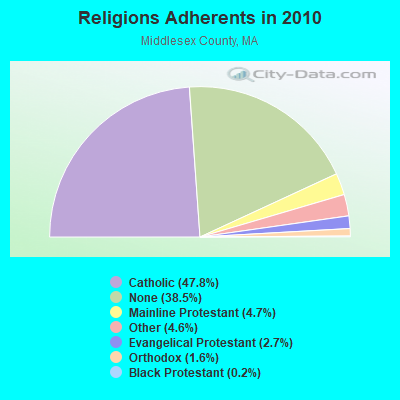
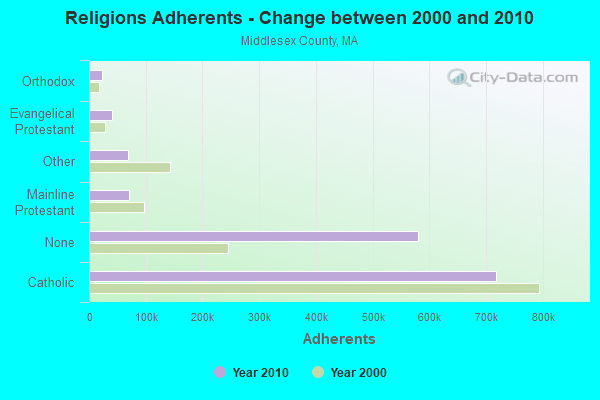
| Religion | Adherents | Congregations |
|---|---|---|
| Catholic | 718,209 | 107 |
| Mainline Protestant | 70,053 | 269 |
| Other | 68,480 | 199 |
| Evangelical Protestant | 41,270 | 304 |
| Orthodox | 23,641 | 28 |
| Black Protestant | 2,276 | 8 |
| None | 579,156 | - |
Food Environment Statistics:
| This county: | 1.71 / 10,000 pop. |
| Massachusetts: | 1.98 / 10,000 pop. |
| Middlesex County: | 0.03 / 10,000 pop. |
| Massachusetts: | 0.05 / 10,000 pop. |
| This county: | 2.14 / 10,000 pop. |
| Massachusetts: | 2.22 / 10,000 pop. |
| This county: | 1.38 / 10,000 pop. |
| Massachusetts: | 1.77 / 10,000 pop. |
| Middlesex County: | 7.84 / 10,000 pop. |
| State: | 8.76 / 10,000 pop. |
| Here: | 7.8% |
| State: | 8.1% |
| Middlesex County: | 21.5% |
| Massachusetts: | 22.5% |
| Middlesex County: | 18.0% |
| Massachusetts: | 16.5% |
Health and Nutrition:
| Marlborough: | 49.4% |
| Massachusetts: | 50.5% |
| Marlborough: | 46.7% |
| State: | 48.0% |
| Marlborough: | 28.6 |
| Massachusetts: | 28.4 |
| Marlborough: | 21.3% |
| State: | 20.7% |
| Marlborough: | 10.4% |
| Massachusetts: | 10.4% |
| Marlborough: | 6.8 |
| State: | 6.8 |
| This city: | 33.3% |
| Massachusetts: | 33.4% |
| Marlborough: | 56.8% |
| Massachusetts: | 57.1% |
| This city: | 79.4% |
| State: | 79.2% |
More about Health and Nutrition of Marlborough, MA Residents
| Local government employment and payroll (March 2022) | |||||
| Function | Full-time employees | Monthly full-time payroll | Average yearly full-time wage | Part-time employees | Monthly part-time payroll |
|---|---|---|---|---|---|
| Elementary and Secondary - Instruction | 757 | $4,514,464 | $71,563 | 162 | $262,984 |
| Elementary and Secondary - Other Total | 80 | $361,401 | $54,210 | 48 | $96,182 |
| Firefighters | 68 | $735,021 | $129,710 | 0 | $0 |
| Other Government Administration | 62 | $380,691 | $73,682 | 0 | $0 |
| Police Protection - Officers | 60 | $695,928 | $139,186 | 0 | $0 |
| Other and Unallocable | 33 | $196,671 | $71,517 | 3 | $2,588 |
| Sewerage | 30 | $234,794 | $93,918 | 0 | $0 |
| Solid Waste Management | 22 | $152,052 | $82,937 | 2 | $3,059 |
| Financial Administration | 18 | $123,745 | $82,497 | 0 | $0 |
| Streets and Highways | 18 | $150,412 | $100,275 | 0 | $0 |
| Police - Other | 14 | $78,023 | $66,877 | 8 | $8,492 |
| Local Libraries | 9 | $43,416 | $57,888 | 11 | $14,827 |
| Housing and Community Development (Local) | 8 | $45,055 | $67,583 | 3 | $5,274 |
| Health | 5 | $28,248 | $67,795 | 2 | $3,128 |
| Welfare | 5 | $25,235 | $60,564 | 1 | $1,607 |
| Judicial and Legal | 4 | $38,415 | $115,245 | 1 | $1,683 |
| Parks and Recreation | 3 | $16,818 | $67,272 | 0 | $0 |
| Fire - Other | 3 | $26,062 | $104,248 | 0 | $0 |
| Totals for Government | 1,199 | $7,846,451 | $78,530 | 241 | $399,825 |
Marlborough government finances - Expenditure in 2021 (per resident):
- Current Operations - Elementary and Secondary Education: $93,957,000 ($2293.26)
General - Other: $18,963,000 ($462.84)
Regular Highways: $12,000,000 ($292.89)
Water Utilities: $9,861,000 ($240.68)
Local Fire Protection: $8,462,000 ($206.54)
Police Protection: $8,402,000 ($205.07)
Sewerage: $7,064,000 ($172.41)
General Public Buildings: $5,840,000 ($142.54)
Financial Administration: $1,725,000 ($42.10)
Protective Inspection and Regulation - Other: $828,000 ($20.21)
Libraries: $614,000 ($14.99)
Central Staff Services: $481,000 ($11.74)
Judicial and Legal Services: $349,000 ($8.52)
Health - Other: $343,000 ($8.37)
Parks and Recreation: $272,000 ($6.64)
Public Welfare - Other: $263,000 ($6.42)
Housing and Community Development: $97,000 ($2.37)
- General - Interest on Debt: $3,534,000 ($86.26)
- Intergovernmental to Local - Other - Elementary and Secondary Education: $6,156,000 ($150.25)
Other - Health - Other: $99,000 ($2.42)
Other - Central Staff Services: $21,000 ($0.51)
- Intergovernmental to State - Transit Utilities: $466,000 ($11.37)
General - Other: $54,000 ($1.32)
- Other Capital Outlay - Elementary and Secondary Education: $2,635,000 ($64.31)
Regular Highways: $839,000 ($20.48)
Libraries: $459,000 ($11.20)
Police Protection: $208,000 ($5.08)
Central Staff Services: $152,000 ($3.71)
General - Other: $125,000 ($3.05)
Local Fire Protection: $115,000 ($2.81)
Water Utilities: $39,000 ($0.95)
Parks and Recreation: $27,000 ($0.66)
General Public Building: $5,000 ($0.12)
- Total Salaries and Wages: $57,745,000 ($1409.41)
- Water Utilities - Interest on Debt: $429,000 ($10.47)
Marlborough government finances - Revenue in 2021 (per resident):
- Charges - Sewerage: $10,586,000 ($258.38)
Other: $1,477,000 ($36.05)
Elementary and Secondary Education School Lunch: $895,000 ($21.84)
Elementary and Secondary Education School Tuition and Transportation: $11,000 ($0.27)
- Local Intergovernmental - Other: $61,000 ($1.49)
- Miscellaneous - General Revenue - Other: $5,236,000 ($127.80)
Donations From Private Sources: $304,000 ($7.42)
Fines and Forfeits: $31,000 ($0.76)
Interest Earnings: $21,000 ($0.51)
- Revenue - Water Utilities: $12,081,000 ($294.87)
- State Intergovernmental - Education: $42,953,000 ($1048.38)
Other: $7,322,000 ($178.71)
General Local Government Support: $6,170,000 ($150.59)
Highways: $2,354,000 ($57.46)
Public Welfare: $150,000 ($3.66)
Housing and Community Development: $20,000 ($0.49)
- Tax - Property: $117,821,000 ($2875.72)
Other License: $2,249,000 ($54.89)
Other Selective Sales: $1,259,000 ($30.73)
Marlborough government finances - Debt in 2021 (per resident):
- Long Term Debt - Beginning Outstanding - Unspecified Public Purpose: $154,408,000 ($3768.71)
Outstanding Unspecified Public Purpose: $145,448,000 ($3550.02)
Retired Unspecified Public Purpose: $10,960,000 ($267.51)
Issue, Unspecified Public Purpose: $2,000,000 ($48.82)
Marlborough government finances - Cash and Securities in 2021 (per resident):
- Bond Funds - Cash and Securities: $7,080,000 ($172.81)
- Other Funds - Cash and Securities: $55,512,000 ($1354.91)
6.91% of this county's 2021 resident taxpayers lived in other counties in 2020 ($102,955 average adjusted gross income)
| Here: | 6.91% |
| Massachusetts average: | 6.35% |
0.01% of residents moved from foreign countries ($137 average AGI)
Middlesex County: 0.01% Massachusetts average: 0.01%
Top counties from which taxpayers relocated into this county between 2020 and 2021:
| from Suffolk County, MA | |
| from Essex County, MA | |
| from Norfolk County, MA |
8.22% of this county's 2020 resident taxpayers moved to other counties in 2021 ($123,369 average adjusted gross income)
| Here: | 8.22% |
| Massachusetts average: | 7.18% |
0.01% of residents moved to foreign countries ($124 average AGI)
Middlesex County: 0.01% Massachusetts average: 0.02%
Top counties to which taxpayers relocated from this county between 2020 and 2021:
| to Suffolk County, MA | |
| to Essex County, MA | |
| to Worcester County, MA |
| Businesses in Marlborough, MA | ||||
| Name | Count | Name | Count | |
|---|---|---|---|---|
| 7-Eleven | 1 | Justice | 1 | |
| ALDO | 1 | Lane Bryant | 1 | |
| AT&T | 2 | LensCrafters | 1 | |
| Abercrombie & Fitch | 1 | Macy's | 1 | |
| Abercrombie Kids | 1 | Marriott | 2 | |
| Aeropostale | 1 | MasterBrand Cabinets | 8 | |
| American Eagle Outfitters | 2 | McDonald's | 2 | |
| Ann Taylor | 2 | Men's Wearhouse | 2 | |
| Arby's | 1 | Motherhood Maternity | 1 | |
| AutoZone | 1 | New Balance | 4 | |
| Banana Republic | 1 | Nike | 2 | |
| Bath & Body Works | 1 | Nissan | 1 | |
| Best Western | 1 | OfficeMax | 1 | |
| Brookstone | 1 | Old Navy | 1 | |
| Burger King | 1 | Olive Garden | 1 | |
| Chico's | 1 | Pac Sun | 1 | |
| Chipotle | 1 | Panera Bread | 1 | |
| Clarks | 1 | Papa John's Pizza | 1 | |
| Coldwater Creek | 1 | Payless | 2 | |
| Comfort Inn | 1 | Quiznos | 1 | |
| Dairy Queen | 1 | RadioShack | 1 | |
| Decora Cabinetry | 2 | Rite Aid | 1 | |
| Domino's Pizza | 1 | Sears | 2 | |
| Dunkin Donuts | 4 | Skechers USA | 1 | |
| Express | 1 | Spencer Gifts | 1 | |
| FedEx | 8 | Sprint Nextel | 3 | |
| Finish Line | 1 | Staples | 1 | |
| Ford | 1 | Starbucks | 3 | |
| Forever 21 | 1 | Subway | 2 | |
| GNC | 2 | T-Mobile | 1 | |
| GameStop | 1 | T.G.I. Driday's | 1 | |
| Gap | 1 | Talbots | 2 | |
| Gymboree | 1 | Target | 1 | |
| H&R Block | 3 | The Limited | 1 | |
| Hilton | 2 | U-Haul | 1 | |
| Hollister Co. | 1 | UPS | 11 | |
| Home Depot | 1 | Vans | 1 | |
| Homestead Studio Suites | 1 | Verizon Wireless | 2 | |
| Hot Topic | 1 | Victoria's Secret | 1 | |
| J. Jill | 1 | Walgreens | 2 | |
| JCPenney | 1 | Wendy's | 1 | |
| Jones New York | 1 | |||
Strongest AM radio stations in Marlborough:
- WKOX (1200 AM; 50 kW; FRAMINGHAM, MA; Owner: CAPSTAR TX LIMITED PARTNERSHIP)
- WBIX (1060 AM; 40 kW; NATICK, MA; Owner: LANGER BROADCASTING CORPORATION)
- WAZN (1470 AM; 7 kW; MARLBOROUGH, MA; Owner: MULTICULTURAL RADIO BROADCASTING, INC.)
- WAMG (890 AM; 25 kW; DEDHAM, MA; Owner: MEGA COMMUNICATIONS OF DEDHAM LICENSEE, LLC)
- WEEI (850 AM; 50 kW; BOSTON, MA; Owner: ENTERCOM BOSTON LICENSE, LLC)
- WRKO (680 AM; 50 kW; BOSTON, MA; Owner: ENTERCOM BOSTON LICENSE, LLC)
- WCRN (830 AM; 50 kW; WORCESTER, MA; Owner: CARTER BROADCASTING CORPORATION)
- WWZN (1510 AM; 50 kW; BOSTON, MA; Owner: ROSE CITY RADIO CORPORATION)
- WRCA (1330 AM; 25 kW; WALTHAM, MA; Owner: WRCA LICENSE, LLC)
- WALE (990 AM; 50 kW; GREENVILLE, RI; Owner: NORTH AMERICAN BROADCASTING CO., INC.)
- WBNW (1120 AM; 5 kW; CONCORD, MA; Owner: MONEY MATTERS RADIO, INC.)
- WTAG (580 AM; 5 kW; WORCESTER, MA; Owner: CAPSTAR TX LIMITED PARTNERSHIP)
- WVNE (760 AM; daytime; 25 kW; LEICESTER, MA; Owner: BLOUNT MASSCOM, INC.)
Strongest FM radio stations in Marlborough:
- WBMX (98.5 FM; BOSTON, MA; Owner: INFINITY RADIO OPERATIONS INC.)
- WJMN (94.5 FM; BOSTON, MA; Owner: AMFM RADIO LICENSES, L.L.C.)
- WCRB (102.5 FM; WALTHAM, MA; Owner: CHARLES RIVER BROADCASTING WCRB LICE)
- WTKK (96.9 FM; BOSTON, MA; Owner: GREATER BOSTON RADIO, INC.)
- WROR-FM (105.7 FM; FRAMINGHAM, MA; Owner: GREATER BOSTON RADIO, INC.)
- WBOS (92.9 FM; BROOKLINE, MA; Owner: GREATER BOSTON RADIO, INC.)
- WGBH (89.7 FM; BOSTON, MA; Owner: WGBH EDUCATIONAL FOUNDATION)
- WBUR-FM (90.9 FM; BOSTON, MA; Owner: TRUSTEES OF BOSTON UNIVERSITY)
- WAAF (107.3 FM; WORCESTER, MA; Owner: ENTERCOM BOSTON LICENSE, LLC)
- WODS (103.3 FM; BOSTON, MA; Owner: INFINITY BROADCASTING OPERATIONS, INC.)
- WSRS (96.1 FM; WORCESTER, MA; Owner: CAPSTAR TX LIMITED PARTNERSHIP)
- WXKS-FM (107.9 FM; MEDFORD, MA; Owner: AMFM RADIO LICENSES, L.L.C.)
- WMJX (106.7 FM; BOSTON, MA; Owner: GREATER BOSTON RADIO, INC.)
- WYAJ (97.7 FM; SUDBURY, MA; Owner: SUDBURY VALLEY B'CASTING FOUNDATION)
- WXLO (104.5 FM; FITCHBURG, MA; Owner: CITADEL BROADCASTING COMPANY)
- WICN (90.5 FM; WORCESTER, MA; Owner: WICN PUBLIC RADIO, INC)
- WBCN (104.1 FM; BOSTON, MA; Owner: HEMISPHERE BROADCASTING CORPORATION)
- WZLX (100.7 FM; BOSTON, MA; Owner: INFINITY BROADCASTING CORPORATION OF BOSTON)
- W267AI (101.3 FM; BOSTON, MA; Owner: MCC BROADCASTING COMPANY, INC.)
- WERS (88.9 FM; BOSTON, MA; Owner: EMERSON COLLEGE)
TV broadcast stations around Marlborough:
- WUTF (Channel 66; MARLBOROUGH, MA; Owner: TELEFUTURA BOSTON LLC)
- WUNI (Channel 27; WORCESTER, MA; Owner: ENTRAVISION HOLDINGS, LLC)
- WCVB-TV (Channel 5; BOSTON, MA; Owner: WCVB HEARST-ARGYLE TV, INC.)
- WGBH-TV (Channel 2; BOSTON, MA; Owner: WGBH EDUCATIONAL FOUNDATION)
- WBZ-TV (Channel 4; BOSTON, MA; Owner: VIACOM INC.)
- WGBX-TV (Channel 44; BOSTON, MA; Owner: WGBH EDUCATIONAL FOUNDATION)
- WMFP (Channel 62; LAWRENCE, MA; Owner: WSAH LICENSE, INC.)
- WHDH-TV (Channel 7; BOSTON, MA; Owner: WHDH-TV)
- WSBK-TV (Channel 38; BOSTON, MA; Owner: VIACOM INC.)
- WLVI-TV (Channel 56; CAMBRIDGE, MA; Owner: WLVI, INC.)
- WFXT (Channel 25; BOSTON, MA; Owner: FOX TELEVISION STATIONS INC.)
- W40BO (Channel 40; BOSTON, MA; Owner: PAXSON COMMUNICATIONS LPTV, INC.)
- WBPX (Channel 68; BOSTON, MA; Owner: PAXSON BOSTON-68 LICENSE, INC.)
- WTMU-LP (Channel 32; BOSTON, MA; Owner: ZGS BOSTON, INC.)
- WCEA-LP (Channel 58; BOSTON, MA; Owner: CHANNEL 19 TV CORPORATION)
- WYDN (Channel 48; WORCESTER, MA; Owner: EDUCATIONAL PUBLIC TV CORPORATION)
- WWDP (Channel 46; NORWELL, MA; Owner: NORWELL TELEVISION, LLC)
- WFXZ-CA (Channel 24; BOSTON, MA; Owner: BOSTON BROADCASTING CORP.)
- WNAC-TV (Channel 64; PROVIDENCE, RI; Owner: WNAC, LLC)
- WPRI-TV (Channel 12; PROVIDENCE, RI; Owner: TVL BROADCASTING OF RHODE ISLAND, LLC)
- WLNE-TV (Channel 6; NEW BEDFORD, MA; Owner: FREEDOM BROADCASTING OF SOUTHERN NEW ENGLAND, INC.)
- WPXQ (Channel 69; BLOCK ISLAND, RI; Owner: OCEAN STATE TELEVISION, L.L.C.)
- WJAR (Channel 10; PROVIDENCE, RI; Owner: OUTLET BROADCASTING, INC.)
- WSBE-TV (Channel 36; PROVIDENCE, RI; Owner: RHODE ISLAND PUBLIC TELECOM. AUTHORITY)
- WCRN-LP (Channel 34; LEICESTER, MA; Owner: CARTER BROADCASTING CORPORATION)
- National Bridge Inventory (NBI) Statistics
- 37Number of bridges
- 505ft / 154mTotal length
- $120,087,000Total costs
- 1,023,756Total average daily traffic
- 90,541Total average daily truck traffic
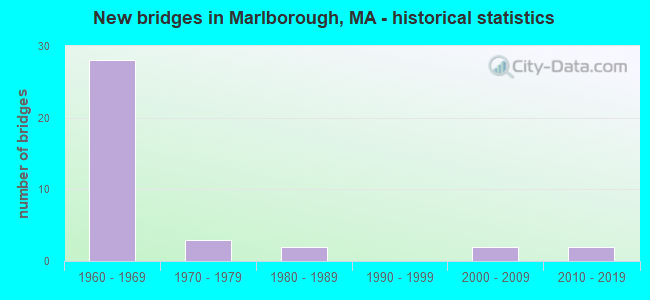
- New bridges - historical statistics
- 281960-1969
- 31970-1979
- 21980-1989
- 22000-2009
- 22010-2019
FCC Registered Antenna Towers: 45 (See the full list of FCC Registered Antenna Towers)
FCC Registered Private Land Mobile Towers: 1 (See the full list of FCC Registered Private Land Mobile Towers in Marlborough, MA)
FCC Registered Broadcast Land Mobile Towers: 28 (See the full list of FCC Registered Broadcast Land Mobile Towers)
FCC Registered Microwave Towers: 14 (See the full list of FCC Registered Microwave Towers in this town)
FCC Registered Paging Towers: 1 (See the full list of FCC Registered Paging Towers)
FCC Registered Amateur Radio Licenses: 186 (See the full list of FCC Registered Amateur Radio Licenses in Marlborough)
FAA Registered Aircraft Manufacturers and Dealers: 2 (See the full list of FAA Registered Manufacturers and Dealers in Marlborough)
FAA Registered Aircraft: 7 (See the full list of FAA Registered Aircraft)
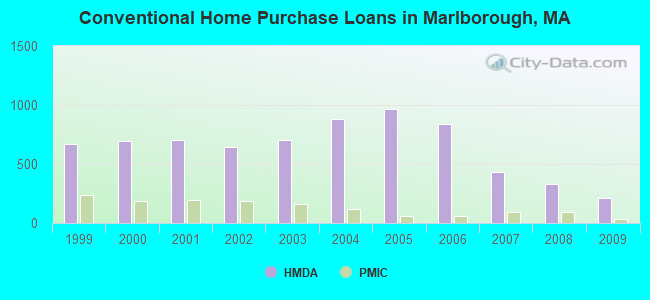
| Home Mortgage Disclosure Act Aggregated Statistics For Year 2009 (Based on 6 full tracts) | ||||||||||||||
| A) FHA, FSA/RHS & VA Home Purchase Loans | B) Conventional Home Purchase Loans | C) Refinancings | D) Home Improvement Loans | E) Loans on Dwellings For 5+ Families | F) Non-occupant Loans on < 5 Family Dwellings (A B C & D) | G) Loans On Manufactured Home Dwelling (A B C & D) | ||||||||
|---|---|---|---|---|---|---|---|---|---|---|---|---|---|---|
| Number | Average Value | Number | Average Value | Number | Average Value | Number | Average Value | Number | Average Value | Number | Average Value | Number | Average Value | |
| LOANS ORIGINATED | 142 | $232,239 | 212 | $216,670 | 808 | $242,192 | 67 | $104,149 | 7 | $3,634,857 | 53 | $166,377 | 6 | $38,500 |
| APPLICATIONS APPROVED, NOT ACCEPTED | 17 | $191,824 | 16 | $141,562 | 58 | $249,345 | 5 | $44,400 | 1 | $196,000 | 3 | $134,333 | 1 | $34,000 |
| APPLICATIONS DENIED | 38 | $186,000 | 58 | $152,879 | 221 | $249,258 | 17 | $117,000 | 0 | $0 | 30 | $146,267 | 3 | $49,667 |
| APPLICATIONS WITHDRAWN | 30 | $192,100 | 38 | $162,711 | 148 | $246,561 | 6 | $158,000 | 1 | $45,000 | 16 | $155,875 | 0 | $0 |
| FILES CLOSED FOR INCOMPLETENESS | 8 | $153,625 | 13 | $158,154 | 47 | $241,809 | 4 | $130,000 | 0 | $0 | 3 | $170,000 | 1 | $38,000 |
Detailed HMDA statistics for the following Tracts: 3211.00 , 3212.00, 3213.00, 3214.00, 3215.00, 3216.00
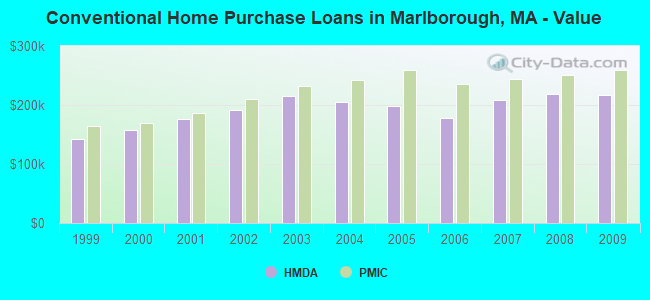
| Private Mortgage Insurance Companies Aggregated Statistics For Year 2009 (Based on 6 full tracts) | ||||
| A) Conventional Home Purchase Loans | B) Refinancings | |||
|---|---|---|---|---|
| Number | Average Value | Number | Average Value | |
| LOANS ORIGINATED | 33 | $259,606 | 16 | $299,562 |
| APPLICATIONS APPROVED, NOT ACCEPTED | 17 | $228,118 | 13 | $316,462 |
| APPLICATIONS DENIED | 4 | $332,750 | 10 | $248,300 |
| APPLICATIONS WITHDRAWN | 1 | $278,000 | 3 | $317,333 |
| FILES CLOSED FOR INCOMPLETENESS | 0 | $0 | 0 | $0 |
Detailed PMIC statistics for the following Tracts: 3211.00 , 3212.00, 3213.00, 3214.00, 3215.00, 3216.00
2002 - 2018 National Fire Incident Reporting System (NFIRS) incidents
- Fire incident types reported to NFIRS in Marlborough, MA
- 82239.8%Structure Fires
- 70033.9%Outside Fires
- 34316.6%Mobile Property/Vehicle Fires
- 2019.7%Other
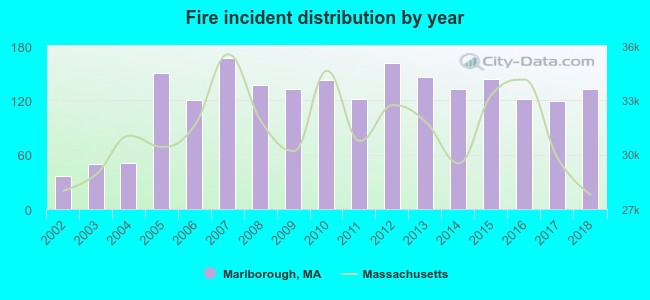 Based on the data from the years 2002 - 2018 the average number of fire incidents per year is 122. The highest number of fire incidents - 167 took place in 2007, and the least - 36 in 2002. The data has an increasing trend.
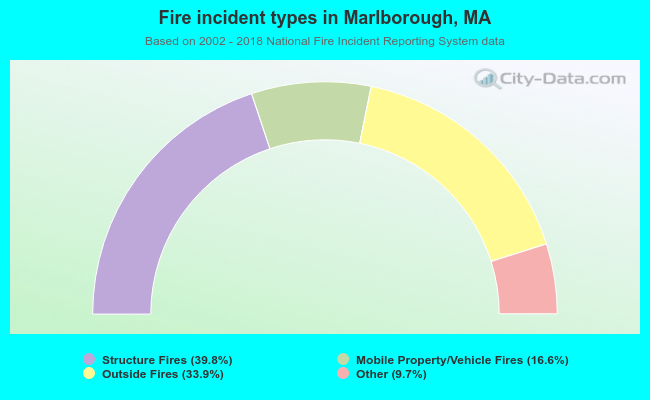 When looking into fire subcategories, the most reports belonged to: Structure Fires (39.8%), and Outside Fires (33.9%).
Fire-safe hotels and motels in Marlborough, Massachusetts:
- Embassy Suites Hotel Boston/Marlborough, 123 Boston Rost Rd W, Marlborough, Massachusetts 01752 , Phone: (508) 485-5900, Fax: (508) 481-3110
- Marlborough Courtyard By Marriott, 75 Felton St, Marlborough, Massachusetts 01752 , Phone: (508) 263-9144, Fax: (508) 485-2242
- Extended Stay America - Boston - Marlborough, 19 Northborough Avenue E, Marlborough, Massachusetts 01752 , Phone: (508) 490-9911, Fax: (508) 490-9922
- Hampton Inn Marlborough, 277 Boston PO Rd W, Marlborough, Massachusetts 01752 , Phone: (508) 787-9888, Fax: (508) 787-0877
- Quality Inn, 880 Donald Lynch Blvd, Marlborough, Massachusetts 01752 , Phone: (508) 460-1000, Fax: (508) 460-9103
- Residence Inn Marlborough, 112 Donald Lynch Blvd, Marlborough, Massachusetts 01752 , Phone: (508) 481-1500, Fax: (508) 481-1558
- Hilton Garden Inn, Boston/Marlborough, 170 Forest St, Marlborough, Massachusetts 01752 , Phone: (508) 573-9901, Fax: (508) 481-1702
- Hyatt Place Marlborough Apex Center, 169 Apex Dr, Marlborough, Massachusetts 01752 , Phone: (508) 506-8100
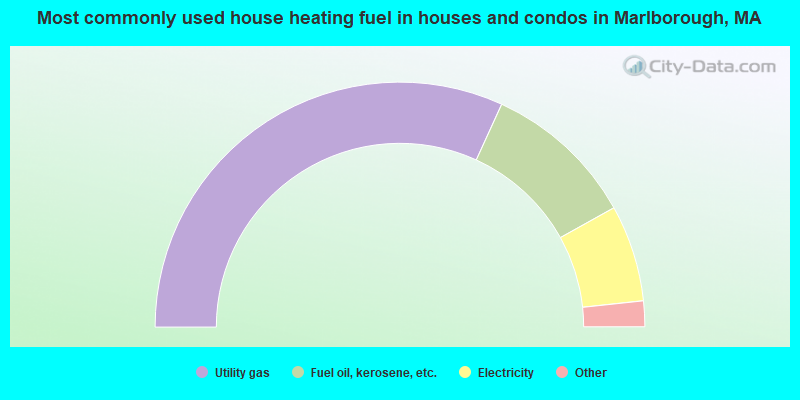
- 63.7%Utility gas
- 20.2%Fuel oil, kerosene, etc.
- 12.8%Electricity
- 1.9%Bottled, tank, or LP gas
- 0.7%Other fuel
- 0.6%Wood
- 0.2%No fuel used
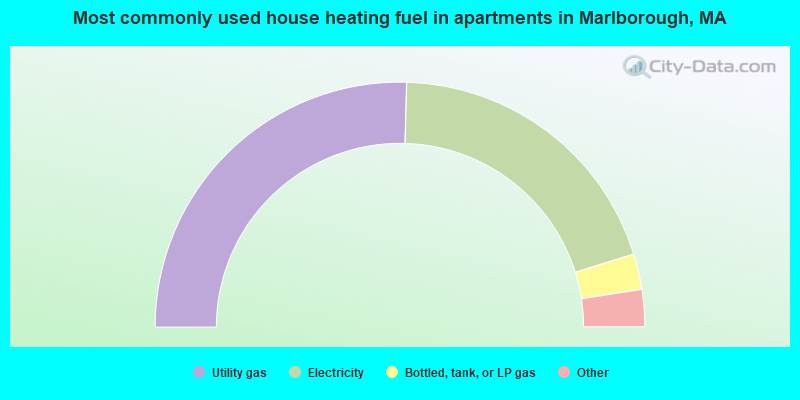
- 50.9%Utility gas
- 39.5%Electricity
- 4.7%Bottled, tank, or LP gas
- 3.5%Fuel oil, kerosene, etc.
- 1.0%Other fuel
- 0.3%No fuel used
Marlborough compared to Massachusetts state average:
- Unemployed percentage significantly below state average.
- Black race population percentage below state average.
- Foreign-born population percentage above state average.
- Length of stay since moving in above state average.
Marlborough on our top lists:
- #7 on the list of "Top 101 cities with the most residents born in Brazil (population 500+)"
- #20 on the list of "Top 101 cities with the biggest property tax revenues per resident (population 10,000+)"
- #4 on the list of "Top 101 counties with the most Orthodox adherents"
- #7 on the list of "Top 101 counties with the most Catholic adherents"
- #7 on the list of "Top 101 counties with the most Mainline Protestant congregations"
- #7 on the list of "Top 101 counties with the most Orthodox congregations"
- #8 on the list of "Top 101 counties with the lowest percentage of residents that keep firearms around their homes"

|
|
Total of 1629 patent applications in 2008-2024.