Crime rate in Boston, Massachusetts (MA): murders, rapes, robberies, assaults, burglaries, thefts, auto thefts, arson, law enforcement employees, police officers, crime map
Crime rate in Boston, MA
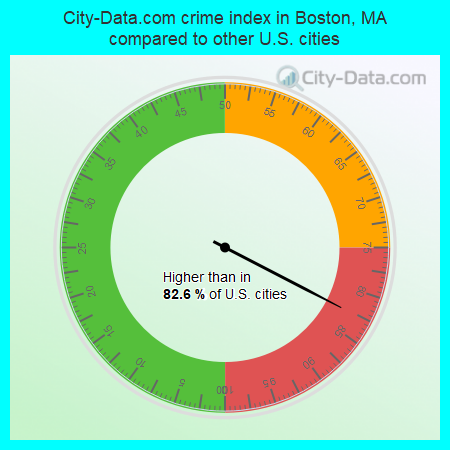
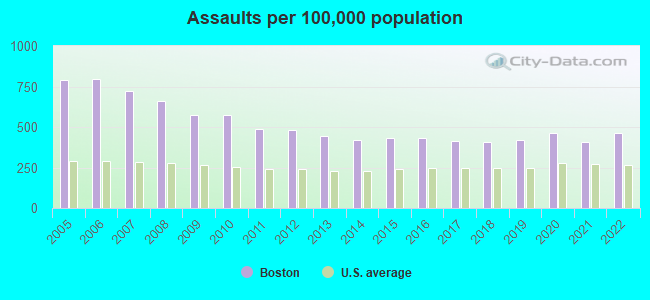
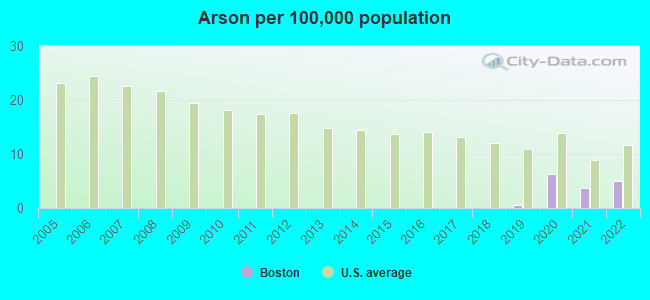
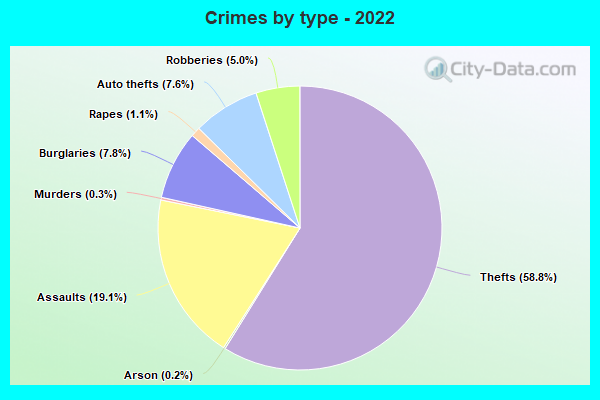
The 2022 crime rate in Boston, MA is 250 (City-Data.com crime index), which is comparable to the U.S. average. It was higher than in 82.6% U.S. cities. The 2022 Boston crime rate rose by 9% compared to 2021. The number of homicides stood at 44 - an increase of 7 compared to 2021. In the last 5 years Boston has seen decreasing violent crime and decline of property crime.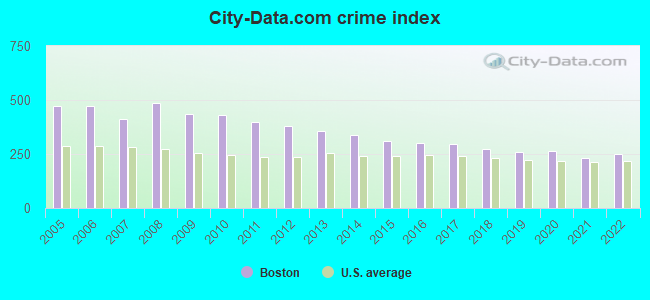
The City-Data.com crime index weighs serious crimes and violent crimes more heavily. Higher means more crime, U.S. average is 246.1. It adjusts for the number of visitors and daily workers commuting into cities.
- means the value is smaller than the state average.- means the value is about the same as the state average.
- means the value is bigger than the state average.
- means the value is much bigger than the state average.
According to our research of Massachusetts and other state lists, there were 334 registered sex offenders living in Boston, Massachusetts as of April 27, 2024.
The ratio of all residents to sex offenders in Boston is 2,014 to 1.
The ratio of registered sex offenders to all residents in this city is lower than the state average.
Violent crime rate in 2022
| Boston: | 333.6 |
| U.S. Average: | 219.8 |
Violent crime rate in 2021
| Boston: | 302.7 |
| U.S. Average: | 224.8 |
Violent crime rate in 2020
| Boston: | 344.5 |
| U.S. Average: | 228.2 |
Violent crime rate in 2019
| Boston: | 332.1 |
| U.S. Average: | 219.9 |
Violent crime rate in 2018
| Boston: | 343.3 |
| U.S. Average: | 221.2 |
Violent crime rate in 2017
| Boston: | 368.4 |
| U.S. Average: | 226.2 |
Violent crime rate in 2016
| Boston: | 385.2 |
| U.S. Average: | 227.3 |
Violent crime rate in 2015
| Boston: | 380.0 |
| U.S. Average: | 219.3 |
Violent crime rate in 2014
| Boston: | 396.4 |
| U.S. Average: | 211.1 |
Violent crime rate in 2013
| Boston: | 421.9 |
| U.S. Average: | 214.2 |
Violent crime rate in 2012
| Boston: | 450.8 |
| U.S. Average: | 187.4 |
Violent crime rate in 2011
| Boston: | 459.6 |
| U.S. Average: | 187.1 |
Violent crime rate in 2010
| Boston: | 509.6 |
| U.S. Average: | 195.7 |
Violent crime rate in 2009
| Boston: | 529.5 |
| U.S. Average: | 208.9 |
Violent crime rate in 2008
| Boston: | 587.2 |
| U.S. Average: | 222.5 |
Violent crime rate in 2007
| Boston: | 486.7 |
| U.S. Average: | 229.1 |
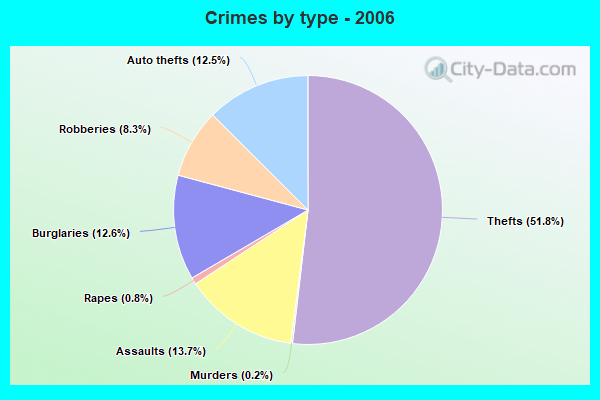
Violent crime rate in 2006
| Boston: | 564.0 |
| U.S. Average: | 232.6 |
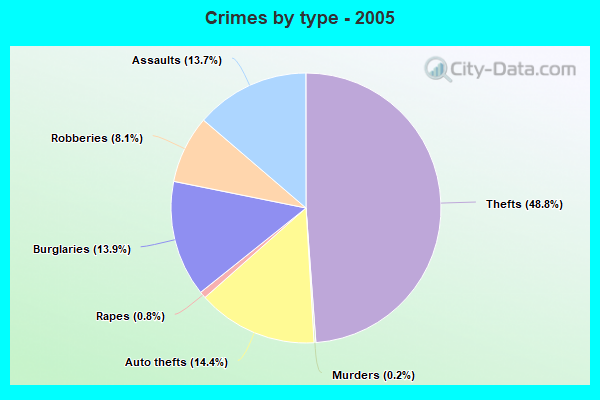
Violent crime rate in 2005
| Boston: | 554.2 |
| U.S. Average: | 227.0 |
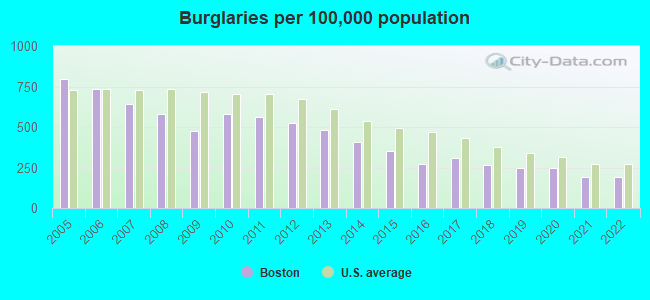
Property crime rate in 2022
| Boston: | 137.1 |
| U.S. Average: | 166.5 |
Property crime rate in 2021
| Boston: | 128.3 |
| U.S. Average: | 157.8 |
Property crime rate in 2020
| Boston: | 150.6 |
| U.S. Average: | 169.6 |
Property crime rate in 2019
| Boston: | 146.6 |
| U.S. Average: | 179.7 |
Property crime rate in 2018
| Boston: | 157.4 |
| U.S. Average: | 190.2 |
Property crime rate in 2017
| Boston: | 168.4 |
| U.S. Average: | 206.4 |
Property crime rate in 2016
| Boston: | 166.5 |
| U.S. Average: | 216.6 |
Property crime rate in 2015
| Boston: | 188.2 |
| U.S. Average: | 221.5 |
Property crime rate in 2014
| Boston: | 216.5 |
| U.S. Average: | 230.8 |
Property crime rate in 2013
| Boston: | 235.8 |
| U.S. Average: | 250.4 |
Property crime rate in 2012
| Boston: | 250.3 |
| U.S. Average: | 267.3 |
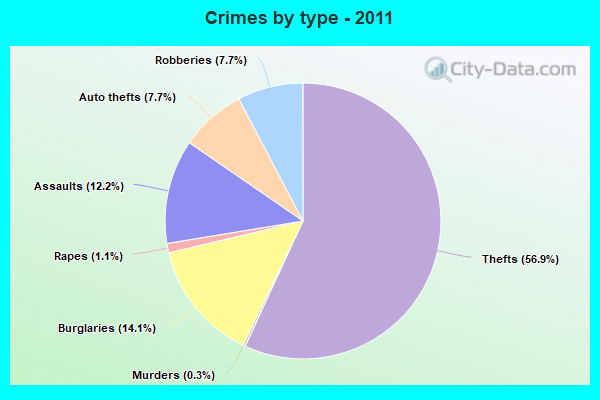
Property crime rate in 2011
| Boston: | 271.1 |
| U.S. Average: | 273.5 |
Property crime rate in 2010
| Boston: | 287.1 |
| U.S. Average: | 276.4 |
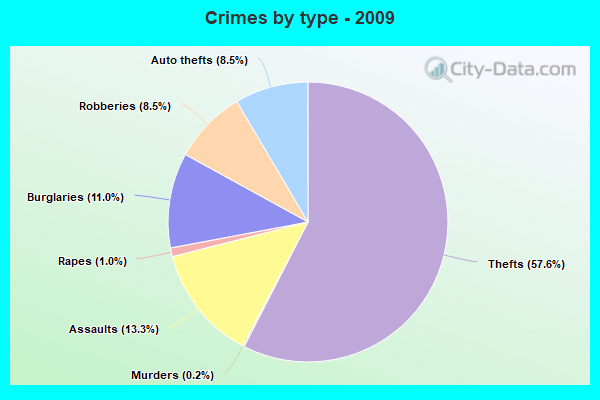
Property crime rate in 2009
| Boston: | 273.8 |
| U.S. Average: | 285.6 |
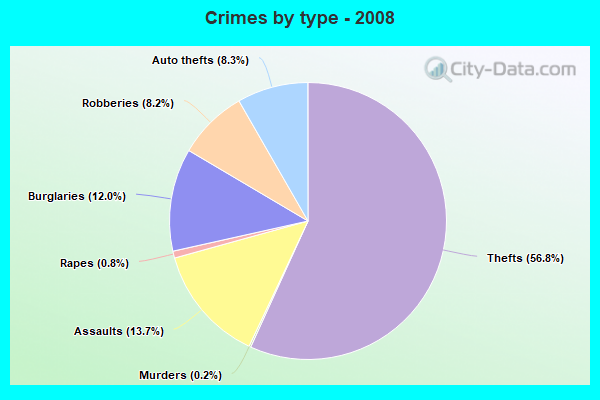
Property crime rate in 2008
| Boston: | 312.0 |
| U.S. Average: | 302.2 |
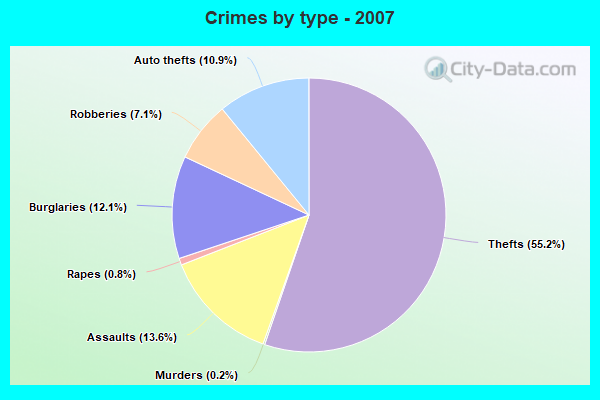
Property crime rate in 2007
| Boston: | 285.8 |
| U.S. Average: | 309.2 |
Property crime rate in 2006
| Boston: | 320.2 |
| U.S. Average: | 317.3 |
Property crime rate in 2005
| Boston: | 335.5 |
| U.S. Average: | 322.3 |

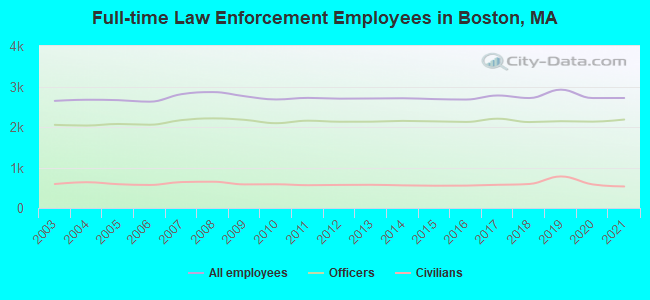
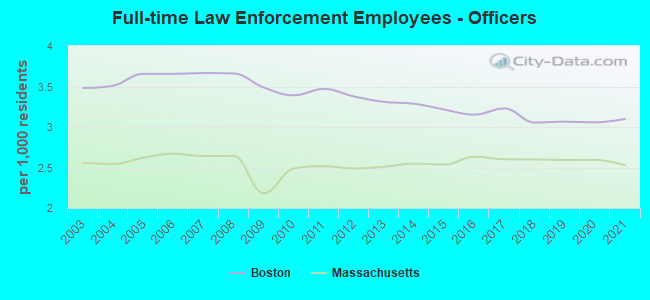
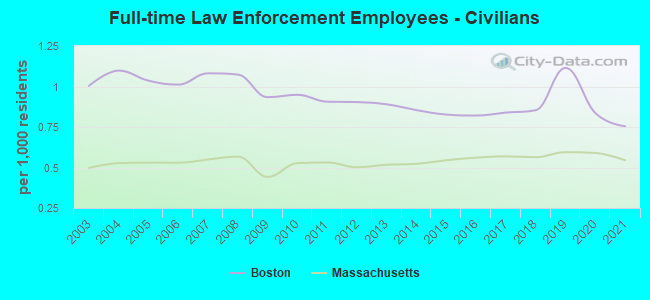
Full-time law enforcement employees in 2021, including police officers: 2,716 (2,184 officers - 1,873 male; 311 female).
| Officers per 1,000 residents here: | 3.10 |
| Massachusetts average: | 2.53 |
Full-time law enforcement employees in 2020, including police officers: 2,715 (2,132 officers - 1,837 male; 295 female).
| Officers per 1,000 residents here: | 3.06 |
| Massachusetts average: | 2.59 |
Full-time law enforcement employees in 2019, including police officers: 2,922 (2,143 officers - 1,865 male; 278 female).
| Officers per 1,000 residents here: | 3.07 |
| Massachusetts average: | 2.59 |
Full-time law enforcement employees in 2018, including police officers: 2,715 (2,122 officers - 1,839 male; 283 female).
| Officers per 1,000 residents here: | 3.05 |
| Massachusetts average: | 2.60 |
Full-time law enforcement employees in 2017, including police officers: 2,778 (2,205 officers - 1,909 male; 296 female).
| Officers per 1,000 residents here: | 3.23 |
| Massachusetts average: | 2.60 |
Full-time law enforcement employees in 2016, including police officers: 2,678 (2,125 officers - 1,840 male; 285 female).
| Officers per 1,000 residents here: | 3.15 |
| Massachusetts average: | 2.63 |
Full-time law enforcement employees in 2015, including police officers: 2,689 (2,139 officers - 1,850 male; 289 female).
| Officers per 1,000 residents here: | 3.22 |
| Massachusetts average: | 2.54 |
Full-time law enforcement employees in 2014, including police officers: 2,710 (2,151 officers - 1,861 male; 290 female).
| Officers per 1,000 residents here: | 3.29 |
| Massachusetts average: | 2.55 |
Full-time law enforcement employees in 2013, including police officers: 2,704 (2,131 officers - 1,842 male; 289 female).
| Officers per 1,000 residents here: | 3.31 |
| Massachusetts average: | 2.51 |
Full-time law enforcement employees in 2012, including police officers: 2,700 (2,130 officers - 1,837 male; 293 female).
| Officers per 1,000 residents here: | 3.38 |
| Massachusetts average: | 2.49 |
Full-time law enforcement employees in 2011, including police officers: 2,719 (2,156 officers - 1,860 male; 296 female).
| Officers per 1,000 residents here: | 3.47 |
| Massachusetts average: | 2.52 |
Full-time law enforcement employees in 2010, including police officers: 2,680 (2,094 officers - 1,817 male; 277 female).
| Officers per 1,000 residents here: | 3.39 |
| Massachusetts average: | 2.49 |
Full-time law enforcement employees in 2009, including police officers: 2,760 (2,177 officers - 1,888 male; 289 female).
| Officers per 1,000 residents here: | 3.49 |
| Massachusetts average: | 2.18 |
Full-time law enforcement employees in 2008, including police officers: 2,862 (2,213 officers - 1,916 male; 297 female).
| Officers per 1,000 residents here: | 3.66 |
| Massachusetts average: | 2.64 |
Full-time law enforcement employees in 2007, including police officers: 2,810 (2,170 officers - 1,876 male; 294 female).
| Officers per 1,000 residents here: | 3.67 |
| Massachusetts average: | 2.64 |
Full-time law enforcement employees in 2006, including police officers: 2,625 (2,056 officers - 1,770 male; 286 female).
| Officers per 1,000 residents here: | 3.66 |
| Massachusetts average: | 2.67 |
Full-time law enforcement employees in 2005, including police officers: 2,663 (2,075 officers - 1,787 male; 288 female).
| Officers per 1,000 residents here: | 3.66 |
| Massachusetts average: | 2.62 |
Full-time law enforcement employees in 2004, including police officers: 2,673 (2,036 officers - 1,754 male; 282 female).
| Officers per 1,000 residents here: | 3.51 |
| Massachusetts average: | 2.54 |
Full-time law enforcement employees in 2003, including police officers: 2,645 (2,053 officers - 1,773 male; 280 female).
| Officers per 1,000 residents here: | 3.48 |
| Massachusetts average: | 2.56 |


Zip codes: 02108, 02109, 02110, 02111, 02113, 02114, 02115, 02116, 02118, 02119, 02120, 02121, 02122, 02124, 02125, 02126, 02127, 02128, 02129, 02130, 02131, 02132, 02134, 02135, 02136, 02151, 02152, 02163, 02199, 02203, 02210, 02215, 02467.