Chickasha, Oklahoma

Chickasha: Chickasha oklahoma Dec/o6 Festival of Lights

Chickasha: Chickasha, OK

Chickasha: Old Middle School Burning Down
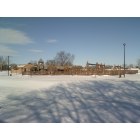
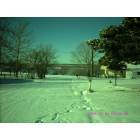
Chickasha: Centennial Park (6th & Texas) - Chickasha's Whitest Christmas - Dec 25th 2009
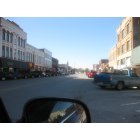
Chickasha: Main Street Chicasha Ok

Chickasha: The old down town area
Chickasha
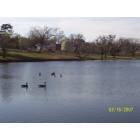
Chickasha: Shannon Springs Park
Chickasha: lake chickasha
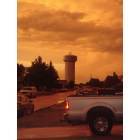
Chickasha: Stormy sunset
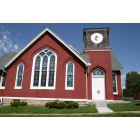
Chickasha: Pride of Chickasha, Oklahoma
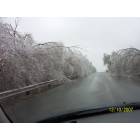
Chickasha: Ice Storm in Chickasha-9th Street Bridge over Turnpike-Dec 2007
- add
your
Submit your own pictures of this city and show them to the world
- OSM Map
- General Map
- Google Map
- MSN Map
Population change since 2000: +4.4%
 |
| Males: 8,114 | |
| Females: 8,435 |
| Median resident age: | 36.6 years |
| Oklahoma median age: | 37.1 years |
Zip codes: 73018.
| Chickasha: | $53,617 |
| OK: | $59,673 |
Estimated per capita income in 2022: $31,028 (it was $14,797 in 2000)
Chickasha city income, earnings, and wages data
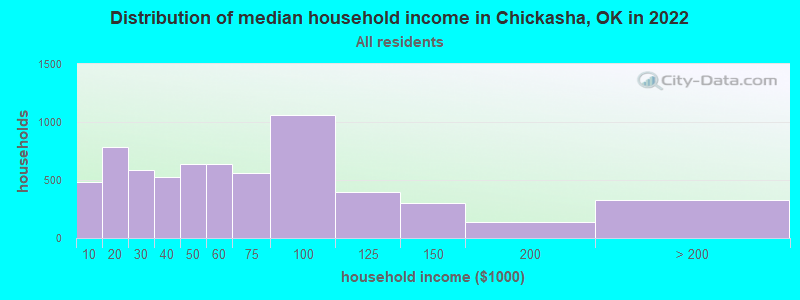
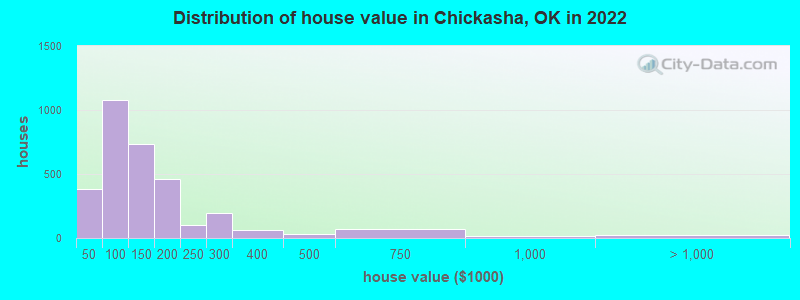
Estimated median house or condo value in 2022: $123,003 (it was $49,000 in 2000)
| Chickasha: | $123,003 |
| OK: | $191,700 |
Mean prices in 2022: all housing units: $157,006; detached houses: $162,718; townhouses or other attached units: $212,439; in 5-or-more-unit structures: $467,421; mobile homes: $35,633
Median gross rent in 2022: $855.
(16.3% for White Non-Hispanic residents, 26.2% for Black residents, 12.8% for Hispanic or Latino residents, 19.6% for American Indian residents, 15.8% for other race residents, 18.8% for two or more races residents)
Detailed information about poverty and poor residents in Chickasha, OK
Compare current foreclosures in Chickasha, OK:
| Photo | Address | Area | Beds / Baths | Price | Details |
|---|---|---|---|---|---|

|
#1
State Highway 19
Chickasha, OK 73018
|
1,894 sq. feet
|
2 baths 3 beds |
show details | |

|
#2
County Street 2814
Chickasha, OK 73018
|
- sq. feet
|
2 baths 4 beds |
show details | |

|
#3
County Road 1344
Chickasha, OK 73018
|
1,924 sq. feet
|
2 baths 3 beds |
show details | |

|
#4
County Road 1380
Chickasha, OK 73018
|
816 sq. feet
|
1 baths 2 beds |
show details | |

|
#5
S 14th St
Chickasha, OK 73018
|
1,608 sq. feet
|
1 baths 3 beds |
show details | |

|
#6
County Road 1340
Chickasha, OK 73018
|
2,333 sq. feet
|
2 baths 3 beds |
show details | |

|
#7
Count 2860
Chickasha, OK 73018
|
1,309 sq. feet
|
2 baths 3 beds |
show details | |

|
#8
W Minnesota Ave
Chickasha, OK 73018
|
2,559 sq. feet
|
2 baths 3 beds |
show details | |

|
#9
Old Highway 81
Chickasha, OK 73018
|
3,395 sq. feet
|
2 baths 3 beds |
show details | |

|
#10
Orchard Dr
Chickasha, OK 73018
|
1,435 sq. feet
|
2 baths 3 beds |
show details |
| Photo | Address | Area | Beds / Baths | Price | Details |
|---|---|---|---|---|---|

|
#11
El Reno Ave
Chickasha, OK 73018
|
1,169 sq. feet
|
1 baths 2 beds |
show details | |

|
#12
County Street 2860
Chickasha, OK 73018
|
1,309 sq. feet
|
2 baths 3 beds |
show details | |

|
#13
S 6th St
Chickasha, OK 73018
|
3,834 sq. feet
|
2 baths 5 beds |
show details | |

|
#14
N 17th St
Chickasha, OK 73018
|
1,691 sq. feet
|
2 baths 4 beds |
show details | |

|
#15
Orchard Dr
Chickasha, OK 73018
|
1,546 sq. feet
|
2 baths 3 beds |
show details | |

|
#16
Park Ave
Chickasha, OK 73018
|
1,428 sq. feet
|
2 baths 3 beds |
show details | |

|
#17
Hillcrest Dr
Chickasha, OK 73018
|
1,470 sq. feet
|
2 baths 3 beds |
show details | |

|
#18
S 12th St
Chickasha, OK 73018
|
1,103 sq. feet
|
1 baths 2 beds |
show details | |

|
#19
W Montana Ave
Chickasha, OK 73018
|
984 sq. feet
|
1 baths 3 beds |
show details | |

|
#20
S 11th St
Chickasha, OK 73018
|
870 sq. feet
|
2 baths 2 beds |
show details |
| Photo | Address | Area | Beds / Baths | Price | Details |
|---|---|---|---|---|---|

|
#21
S 20th St
Chickasha, OK 73018
|
1,032 sq. feet
|
1 baths 2 beds |
show details | |

|
#22
County Road 1370
Chickasha, OK 73018
|
960 sq. feet
|
2 baths 3 beds |
show details | |

|
#23
S 19th St
Chickasha, OK 73018
|
1,817 sq. feet
|
2 baths 3 beds |
show details | |

|
#24
S 9th St
Chickasha, OK 73018
|
1,174 sq. feet
|
1 baths 3 beds |
show details | |

|
#25
W Mississippi Ave
Chickasha, OK 73018
|
- sq. feet
|
- baths - beds |
show details | |

|
#26
E Almar Dr Apt 702
Chickasha, OK 73018
|
- sq. feet
|
- baths - beds |
show details | |

|
#27
W Utah Ave
Chickasha, OK 73018
|
- sq. feet
|
- baths - beds |
show details | |

|
#28
County Road 1344
Chickasha, OK 73018
|
- sq. feet
|
- baths - beds |
show details | |

|
#29
S 19th St
Chickasha, OK 73018
|
- sq. feet
|
- baths - beds |
show details | |

|
#30
County Road 1350
Chickasha, OK 73018
|
- sq. feet
|
- baths - beds |
show details |
| Photo | Address | Area | Beds / Baths | Price | Details |
|---|---|---|---|---|---|

|
#31
W Almar Dr
Chickasha, OK 73018
|
- sq. feet
|
- baths - beds |
show details | |

|
#32
County Road 1370
Chickasha, OK 73018
|
- sq. feet
|
- baths - beds |
show details | |

|
#33
Casey St
Chickasha, OK 73018
|
- sq. feet
|
- baths - beds |
show details | |

|
#34
W Illinois Ave
Chickasha, OK 73018
|
- sq. feet
|
- baths - beds |
show details | |

|
#35
County Street 2860
Chickasha, OK 73018
|
- sq. feet
|
- baths - beds |
show details | |

|
#36
County Street 2766
Chickasha, OK 73018
|
- sq. feet
|
- baths - beds |
show details | |

|
#37
Sheppard St
Chickasha, OK 73018
|
- sq. feet
|
- baths - beds |
show details | |

|
#38
S 1st St
Chickasha, OK 73018
|
- sq. feet
|
- baths - beds |
show details | |

|
#39
C.s. 2880
Chickasha, OK 73018
|
- sq. feet
|
- baths - beds |
show details | |

|
#40
Quail Ln
Chickasha, OK 73018
|
- sq. feet
|
- baths - beds |
show details |
| Photo | Address | Area | Beds / Baths | Price | Details |
|---|---|---|---|---|---|

|
#41
W Minnesota Ave
Chickasha, OK 73018
|
- sq. feet
|
- baths - beds |
show details | |

|
#42
S 5th St
Chickasha, OK 73018
|
- sq. feet
|
- baths - beds |
show details | |

|
Check over 1 million property listings on Foreclosure.com!
|
browse all offers | |||


- 11,59770.6%White alone
- 1,6179.8%Two or more races
- 1,4538.8%Hispanic
- 1,0216.2%Black alone
- 6333.9%American Indian alone
- 660.4%Asian alone
- 270.2%Other race alone
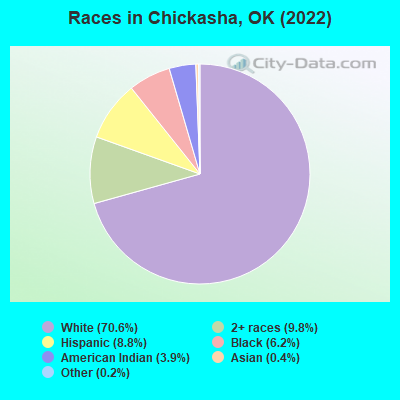
Races in Chickasha detailed stats: ancestries, foreign born residents, place of birth
According to our research of Oklahoma and other state lists, there were 48 registered sex offenders living in Chickasha, Oklahoma as of April 27, 2024.
The ratio of all residents to sex offenders in Chickasha is 345 to 1.
Type |
2009 |
2010 |
2011 |
2012 |
2013 |
2014 |
2015 |
2016 |
2017 |
2018 |
2019 |
2020 |
2021 |
2022 |
|---|---|---|---|---|---|---|---|---|---|---|---|---|---|---|
| Murders (per 100,000) | 0 (0.0) | 1 (6.2) | 0 (0.0) | 0 (0.0) | 0 (0.0) | 2 (12.2) | 0 (0.0) | 0 (0.0) | 1 (6.1) | 3 (18.4) | 3 (18.3) | 5 (30.3) | 5 (30.5) | 0 (0.0) |
| Rapes (per 100,000) | 12 (69.8) | 12 (74.8) | 15 (92.5) | 16 (98.1) | 14 (86.4) | 14 (85.1) | 19 (115.8) | 22 (132.7) | 6 (36.4) | 9 (55.2) | 10 (61.0) | 3 (18.2) | 23 (140.2) | 21 (131.0) |
| Robberies (per 100,000) | 10 (58.2) | 22 (137.2) | 9 (55.5) | 12 (73.6) | 10 (61.7) | 9 (54.7) | 10 (60.9) | 7 (42.2) | 10 (60.6) | 8 (49.0) | 5 (30.5) | 5 (30.3) | 8 (48.8) | 1 (6.2) |
| Assaults (per 100,000) | 65 (378.0) | 94 (586.2) | 110 (678.7) | 88 (539.5) | 128 (790.1) | 64 (388.9) | 91 (554.6) | 81 (488.6) | 73 (442.7) | 43 (263.6) | 53 (323.3) | 67 (406.6) | 39 (237.7) | 42 (262.0) |
| Burglaries (per 100,000) | 254 (1,477) | 209 (1,303) | 196 (1,209) | 264 (1,619) | 166 (1,025) | 132 (802.0) | 123 (749.6) | 166 (1,001) | 157 (952.1) | 113 (692.7) | 122 (744.1) | 150 (910.3) | 153 (932.4) | 182 (1,135) |
| Thefts (per 100,000) | 651 (3,786) | 582 (3,629) | 518 (3,196) | 601 (3,685) | 333 (2,055) | 350 (2,127) | 322 (1,962) | 302 (1,822) | 302 (1,832) | 273 (1,673) | 274 (1,671) | 396 (2,403) | 435 (2,651) | 296 (1,846) |
| Auto thefts (per 100,000) | 63 (366.4) | 24 (149.7) | 34 (209.8) | 58 (355.6) | 35 (216.0) | 33 (200.5) | 30 (182.8) | 34 (205.1) | 33 (200.1) | 50 (306.5) | 55 (335.5) | 40 (242.7) | 75 (457.0) | 71 (442.9) |
| Arson (per 100,000) | 6 (34.9) | 5 (31.2) | 6 (37.0) | 4 (24.5) | 3 (18.5) | 3 (18.2) | 5 (30.5) | 4 (24.1) | 1 (6.1) | 5 (30.6) | 3 (18.3) | 5 (30.3) | 3 (18.3) | 2 (12.5) |
| City-Data.com crime index | 433.0 | 479.1 | 455.7 | 497.6 | 416.9 | 343.8 | 367.4 | 375.9 | 303.9 | 288.3 | 305.0 | 344.9 | 443.1 | 347.8 |
The City-Data.com crime index weighs serious crimes and violent crimes more heavily. Higher means more crime, U.S. average is 246.1. It adjusts for the number of visitors and daily workers commuting into cities.
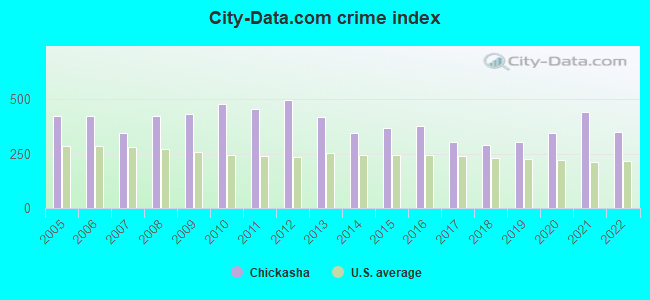
Crime rate in Chickasha detailed stats: murders, rapes, robberies, assaults, burglaries, thefts, arson
Full-time law enforcement employees in 2021, including police officers: 31 (23 officers - 19 male; 4 female).
| Officers per 1,000 residents here: | 1.40 |
| Oklahoma average: | 2.27 |
 Recent articles from our blog. Our writers, many of them Ph.D. graduates or candidates, create easy-to-read articles on a wide variety of topics.

 | Sand Plums (8 replies) |
| Thinking of moving from Maryland to Oklahoma - pros and cons? (19 replies) |
| Oklahoma towns for families (preferably less drug use) (8 replies) |
| Altus vs Lawton (12 replies) |
| How boring is OKC for a young professional? (300 replies) |
| Hello from Chickasha my fellow Okies! (4 replies) |
Latest news from Chickasha, OK collected exclusively by city-data.com from local newspapers, TV, and radio stations
Ancestries: American (23.3%), German (10.1%), English (6.9%), Irish (5.5%), Scottish (1.6%), European (1.5%).
Current Local Time: CST time zone
Elevation: 1096 feet
Land area: 18.1 square miles.
Population density: 916 people per square mile (low).
415 residents are foreign born (1.4% Latin America, 0.5% Europe, 0.4% Africa, 0.3% Asia).
| This city: | 2.5% |
| Oklahoma: | 6.1% |
Median real estate property taxes paid for housing units with mortgages in 2022: $1,016 (0.7%)
Median real estate property taxes paid for housing units with no mortgage in 2022: $626 (0.6%)
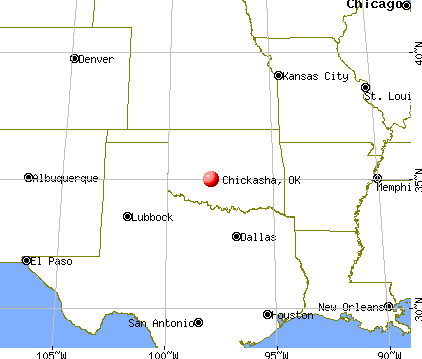
Nearest city with pop. 50,000+: Norman, OK  (32.4 miles , pop. 95,694).
Nearest city with pop. 200,000+: Oklahoma City, OK (38.5 miles , pop. 506,132).
Nearest city with pop. 1,000,000+: Dallas, TX (168.5 miles , pop. 1,188,580).
Nearest cities:
), ), ), Latitude: 35.04 N, Longitude: 97.95 W
Daytime population change due to commuting: +1,933 (+11.8%)
Workers who live and work in this city: 4,852 (68.0%)
Area code: 405

Chickasha, Oklahoma accommodation & food services, waste management - Economy and Business Data
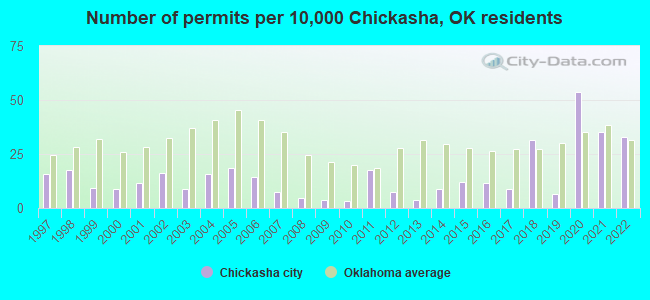
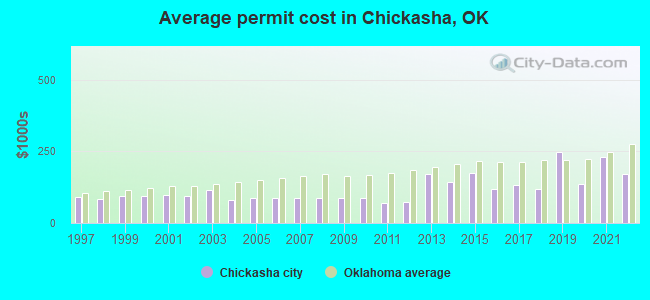
Single-family new house construction building permits:
- 2022: 52 buildings, average cost: $171,400
- 2021: 56 buildings, average cost: $229,600
- 2020: 85 buildings, average cost: $137,700
- 2019: 10 buildings, average cost: $247,600
- 2018: 50 buildings, average cost: $118,400
- 2017: 14 buildings, average cost: $133,700
- 2016: 18 buildings, average cost: $118,200
- 2015: 19 buildings, average cost: $174,300
- 2014: 14 buildings, average cost: $144,500
- 2013: 6 buildings, average cost: $172,800
- 2012: 12 buildings, average cost: $71,700
- 2011: 28 buildings, average cost: $71,400
- 2010: 5 buildings, average cost: $88,100
- 2009: 6 buildings, average cost: $88,100
- 2008: 7 buildings, average cost: $88,100
- 2007: 12 buildings, average cost: $88,200
- 2006: 23 buildings, average cost: $88,000
- 2005: 29 buildings, average cost: $88,600
- 2004: 25 buildings, average cost: $80,300
- 2003: 14 buildings, average cost: $116,500
- 2002: 26 buildings, average cost: $96,300
- 2001: 18 buildings, average cost: $97,000
- 2000: 14 buildings, average cost: $95,000
- 1999: 15 buildings, average cost: $95,000
- 1998: 28 buildings, average cost: $85,000
- 1997: 25 buildings, average cost: $89,900
| Here: | 2.8% |
| Oklahoma: | 3.2% |
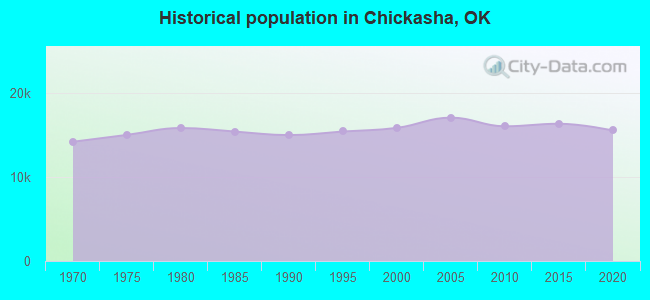
Population change in the 1990s: +398 (+2.6%).
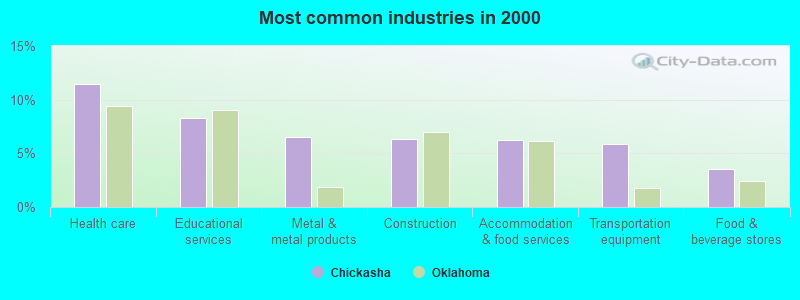
- Health care (11.5%)
- Educational services (8.3%)
- Metal & metal products (6.5%)
- Construction (6.3%)
- Accommodation & food services (6.3%)
- Transportation equipment (5.8%)
- Food & beverage stores (3.5%)
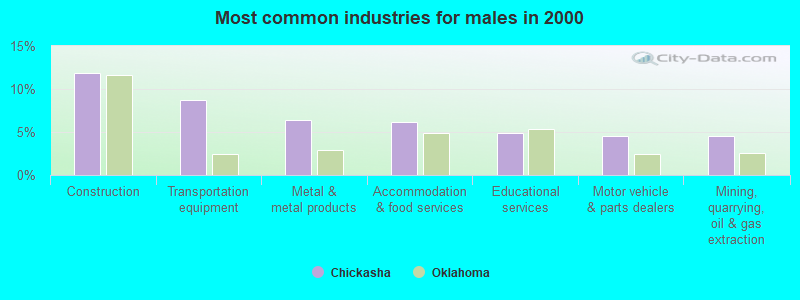
- Construction (11.8%)
- Transportation equipment (8.7%)
- Metal & metal products (6.3%)
- Accommodation & food services (6.1%)
- Educational services (4.9%)
- Motor vehicle & parts dealers (4.6%)
- Mining, quarrying, oil & gas extraction (4.5%)
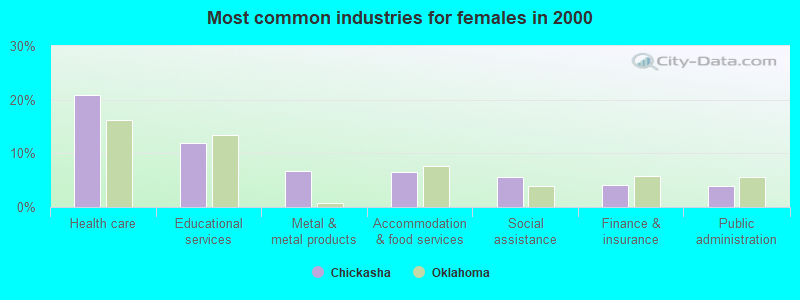
- Health care (20.9%)
- Educational services (11.8%)
- Metal & metal products (6.7%)
- Accommodation & food services (6.4%)
- Social assistance (5.6%)
- Finance & insurance (4.1%)
- Public administration (4.0%)
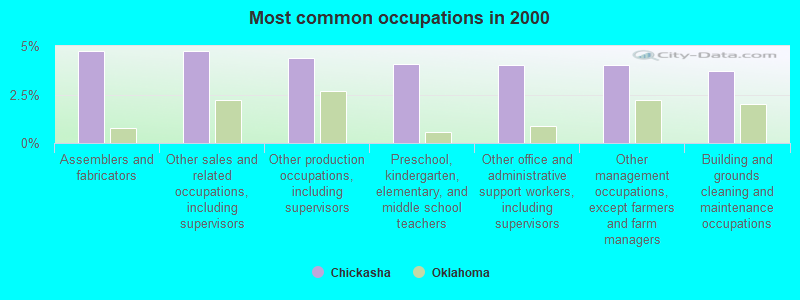
- Assemblers and fabricators (4.8%)
- Other sales and related occupations, including supervisors (4.7%)
- Other production occupations, including supervisors (4.4%)
- Preschool, kindergarten, elementary, and middle school teachers (4.1%)
- Other office and administrative support workers, including supervisors (4.0%)
- Other management occupations, except farmers and farm managers (4.0%)
- Building and grounds cleaning and maintenance occupations (3.7%)
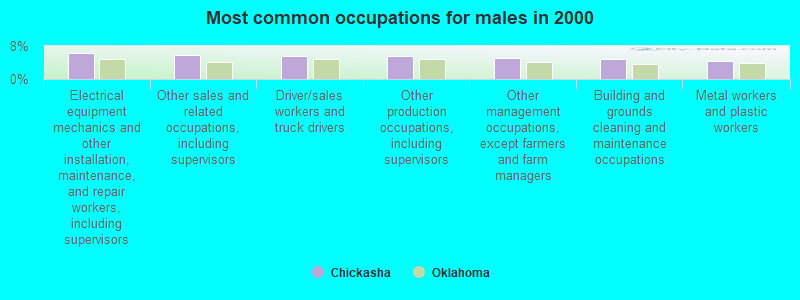
- Electrical equipment mechanics and other installation, maintenance, and repair workers, including supervisors (6.3%)
- Other sales and related occupations, including supervisors (5.8%)
- Driver/sales workers and truck drivers (5.6%)
- Other production occupations, including supervisors (5.5%)
- Other management occupations, except farmers and farm managers (5.1%)
- Building and grounds cleaning and maintenance occupations (4.8%)
- Metal workers and plastic workers (4.4%)
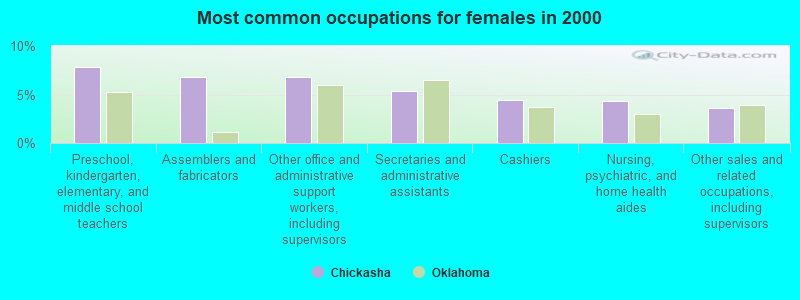
- Preschool, kindergarten, elementary, and middle school teachers (7.8%)
- Assemblers and fabricators (6.8%)
- Other office and administrative support workers, including supervisors (6.8%)
- Secretaries and administrative assistants (5.4%)
- Cashiers (4.4%)
- Nursing, psychiatric, and home health aides (4.3%)
- Other sales and related occupations, including supervisors (3.6%)
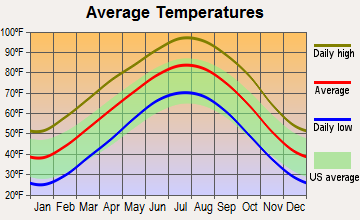
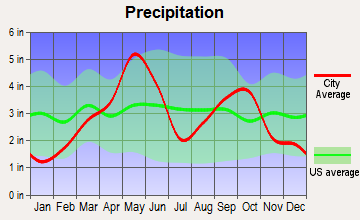
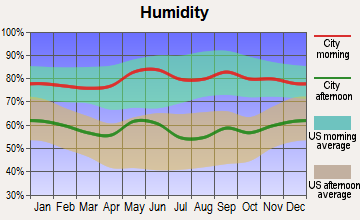
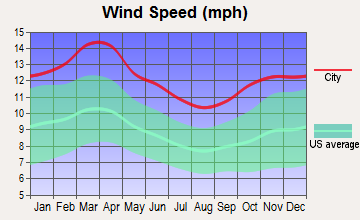
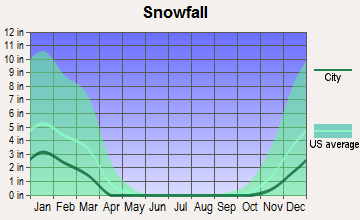
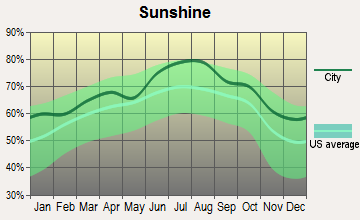
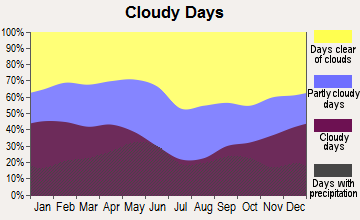
Average climate in Chickasha, Oklahoma
Based on data reported by over 4,000 weather stations
|
|

(lower is better)
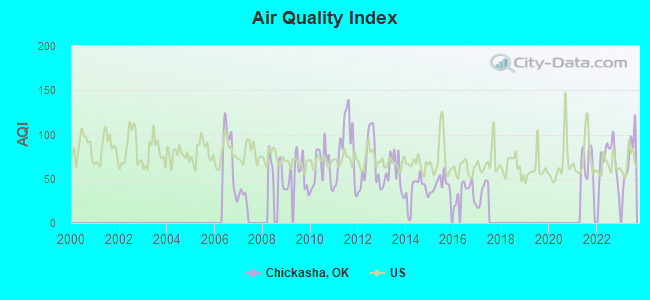
Air Quality Index (AQI) level in 2023 was 74.9. This is about average.
| City: | 74.9 |
| U.S.: | 72.6 |
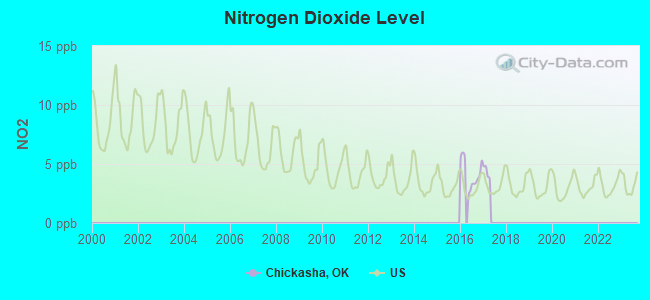
Nitrogen Dioxide (NO2) [ppb] level in 2016 was 4.15. This is better than average. Closest monitor was 17.5 miles away from the city center.
| City: | 4.15 |
| U.S.: | 5.11 |
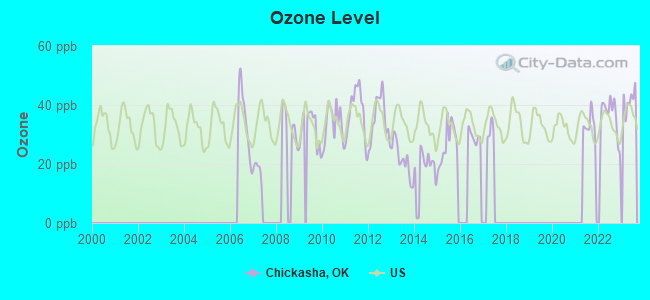
Ozone [ppb] level in 2023 was 41.8. This is worse than average. Closest monitor was 18.1 miles away from the city center.
| City: | 41.8 |
| U.S.: | 33.3 |
Tornado activity:
Chickasha-area historical tornado activity is slightly above Oklahoma state average. It is 228% greater than the overall U.S. average.
On 5/3/1999, a category F5 (max. wind speeds 261-318 mph) tornado 8.3 miles away from the Chickasha city center killed 36 people and injured 583 people and caused $1000 million in damages.
On 5/24/1973, a category F4 (max. wind speeds 207-260 mph) tornado 20.6 miles away from the city center killed 2 people and injured 4 people and caused between $500,000 and $5,000,000 in damages.
Earthquake activity:
Chickasha-area historical earthquake activity is significantly above Oklahoma state average. It is 770% greater than the overall U.S. average.On 11/6/2011 at 03:53:10, a magnitude 5.7 (5.7 MW, Depth: 3.2 mi, Class: Moderate, Intensity: VI - VII) earthquake occurred 74.9 miles away from Chickasha center
On 9/3/2016 at 12:02:44, a magnitude 5.8 (5.8 MW, Depth: 3.5 mi) earthquake occurred 111.6 miles away from the city center
On 2/13/2016 at 17:07:06, a magnitude 5.1 (5.1 MW, Depth: 5.2 mi) earthquake occurred 109.1 miles away from the city center
On 11/7/2016 at 01:44:24, a magnitude 5.0 (5.0 MW, Depth: 2.8 mi) earthquake occurred 92.1 miles away from Chickasha center
On 11/8/2011 at 02:46:57, a magnitude 4.8 (4.8 MW, Depth: 3.1 mi, Class: Light, Intensity: IV - V) earthquake occurred 73.7 miles away from the city center
On 11/5/2011 at 07:12:45, a magnitude 4.8 (4.8 MW, Depth: 1.9 mi) earthquake occurred 75.5 miles away from Chickasha center
Magnitude types: moment magnitude (MW)
Natural disasters:
The number of natural disasters in Grady County (31) is a lot greater than the US average (15).Major Disasters (Presidential) Declared: 24
Emergencies Declared: 6
Causes of natural disasters: Floods: 16, Storms: 16, Winter Storms: 11, Tornadoes: 9, Winds: 2, Fire: 1, Hurricane: 1, Ice Storm: 1, Snow: 1, Other: 1 (Note: some incidents may be assigned to more than one category).
Hospitals in Chickasha:
- CARE CHOICE HOSPICE OF DUNCAN (1000 N CHOCTAW, AVE)
- GRADY MEMORIAL HOSPITAL (Government - Hospital District or Authority, provides emergency services, 2220 IOWA STREET)
- LIFELINE HOSPICE (2210 S 16TH STREET)
Nursing Homes in Chickasha:
- CHICKASHA NURSING CENTER, INC (2701 SOUTH 9TH STREET)
- GLENHAVEN RETIREMENT VILLAGE (3003 IOWA)
- GRACE LIVING CENTER-CHICKASHA (2300 IOWA AVENUE)
- IDAHO AVENUE CARE CENTER (2027 IDAHO AVENUE)
- SHANOAN SPRINGS NURSING AND REHABILITATION (2500 SOUTH 12TH STREET)
Dialysis Facilities in Chickasha:
Home Health Centers in Chickasha:
Airports located in Chickasha:
- Chickasha Municipal Airport (CHK) (Runways: 3, Itinerant Ops: 1,000, Local Ops: 3,000)
- Good Life Ranch Airport (17OK) (Runways: 1)
- Redhills Airport (6OK2) (Runways: 1)
College/University in Chickasha:
Colleges/universities with over 2000 students nearest to Chickasha:
- Mid-America Christian University (about 30 miles; Oklahoma City, OK; Full-time enrollment: 2,869)
- University of Oklahoma-Norman Campus (about 31 miles; Norman, OK; FT enrollment: 22,496)
- Oklahoma City Community College (about 33 miles; Oklahoma City, OK; FT enrollment: 8,904)
- Oklahoma State University-Oklahoma City (about 37 miles; Oklahoma City, OK; FT enrollment: 4,784)
- Southern Nazarene University (about 38 miles; Bethany, OK; FT enrollment: 2,064)
- Oklahoma City University (about 39 miles; Oklahoma City, OK; FT enrollment: 2,547)
- University of Oklahoma-Health Sciences Center (about 40 miles; Oklahoma City, OK; FT enrollment: 2,507)
Public high school in Chickasha:
- CHICKASHA HS (Students: 803, Location: 101 JOHN P COWAN ST, Grades: 9-12)
Public elementary/middle schools in Chickasha:
- CHICKASHA MS (Students: 497, Location: 1000 SOUTH 9TH ST, Grades: 7-8)
- GRAND AVENUE ES (Students: 406, Location: 1415 GRAND AVE, Grades: 2-4)
- PIONEER PUBLIC SCHOOL (Students: 340, Location: 3686 STATE HIGHWAY 92, Grades: PK-8)
- BILL WALLACE EC CTR (Students: 334, Location: 2301 S 16TH ST, Grades: PK-1)
- LINCOLN ES (Students: 255, Location: 103 DAKOTA, Grades: 5-6)
- FRIEND PUBLIC SCHOOL (Students: 205, Location: 1307 COUNTY ROAD 1350, Grades: PK-8)
Private elementary/middle school in Chickasha:
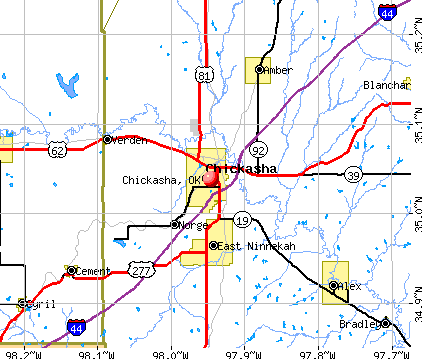
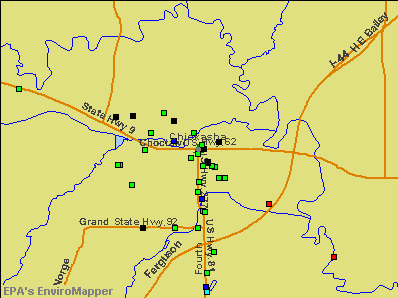
Points of interest:
Notable locations in Chickasha: Chickasha Square (A), Chickasha Fire and Emergency Medical Services Station 1 (B), Chickasha Fire and Emergency Medical Services Station 2 (C), Grady County Fire Department Headquarters (D). Display/hide their locations on the map
Shopping Centers: Southland Shopping Center (1), Grandview Shopping Center (2). Display/hide their locations on the map
Churches in Chickasha include: Word of Life Fellowship (A), United Pentecostal Church (B), Trinity Baptist Church (C), Saint Lukes Episcopal Church (D), Southern Oaks Church of Christ (E), Southern Hills Baptist Church (F), Parkview Christian Church (G), Northside Church of Christ (H), New Life Christian Church (I). Display/hide their locations on the map
Cemeteries: Fairview Park Cemetery (1), Rose Hill Cemetery (2). Display/hide their locations on the map
Reservoirs: Oknoname 051049 Reservoir (A), Little Washita Site 46 Reservoir (B), Oknoname 051030 Reservoir (C). Display/hide their locations on the map
Creek: Rock Hollow Creek (A). Display/hide its location on the map
Park in Chickasha: Shannon Springs Park (1). Display/hide its location on the map
Tourist attractions: Grady County Historical Society (Museums; 415 West Chickasha Avenue) (1), Game Station (Amusement & Theme Parks; 914 South 4th Street) (2), Friendly Travel (Tours & Charters; 804 South 3rd Street) (3). Display/hide their approximate locations on the map
Hotels: Deluxe Inn (2728 South 4th Street) (1), Hunter Kurley (2304 South 4th Street) (2), Holiday Inn Hotel & Suites (2610 South 4th Street) (3), Chickasha-Days Inn (2701 S 4th St) (4), Holiday Inn Express Hotel & Suites (2610 South 4th Street) (5), Budget Inn (1313 South 4th Street) (6), Kings Inn (702 South 4th Street) (7), Ranch House Motel (2304 South 4th Street) (8), Best Western Inn (South Of City) (9). Display/hide their approximate locations on the map
Courts: Grady County - County Court House- County Commissioners (326 West Choctaw Avenue) (1), Grady - County - District Court- Emergency Mgmt Agency (315 West Pennsylvania Avenue) (2), Grady County - County Court House- County Commissioners- District No 3 (326 West Choctaw) (3), Grady County - County Court House- County Commissioners- District No 2 (3900 South Highway 81) (4), Grady County - Victim Witness- County Court House- District Attorney (217 North 3rd Street) (5), Grady County - District Court- Special District Judge Timothy Brauer (Court House) (6), Grady County - District Court- Associate District Judge Oteka L Alford (Court House) (7), Grady County - County Court House- Sheriff- Office (215 North 3rd Street) (8), Grady County - County Court House- Sheriff- Central Control (326 West Choctaw Avenue) (9). Display/hide their approximate locations on the map
Birthplace of: Cleavon Little - Actor, Lee Pace - Actor, Merle Kilgore - Country singer, Orville Moody - Professional golfer, Sam Rayburn - 2005 NFL player (Philadelphia Eagles, born: Oct 20, 1980), Stephen Alexander - 2005 NFL player (Denver Broncos, born: Nov 7, 1975), Bill G. Chapman - Air Force officer, Carolyn Brady - Artist, Chet Allen - Opera singer, Patricia Barchas - Anthropologist and behavioral neurobiologist.
Drinking water stations with addresses in Chickasha and their reported violations in the past:
CHICKASHA MUNICIPAL AUTHORITY (Address: 1200 E. Georgia Ave. , Population served: 15,850, Surface water):Past health violations:CHICKASHA LAKE PARK (Address: 1200 E. Georgia Ave , Population served: 50, Groundwater):Past monitoring violations:
- MCL, Average - Between JAN-2014 and MAR-2014, Contaminant: TTHM. Follow-up actions: St AO (w/penalty) issued (MAY-05-2014), St Public Notif requested (MAY-05-2014), St Public Notif received (JUL-02-2014)
- MCL, Average - Between JAN-2014 and MAR-2014, Contaminant: TTHM. Follow-up actions: St AO (w/penalty) issued (MAY-05-2014), St Public Notif requested (MAY-05-2014), St Public Notif received (JUL-02-2014)
- MCL, Average - Between JAN-2014 and MAR-2014, Contaminant: TTHM. Follow-up actions: St AO (w/penalty) issued (MAY-05-2014), St Public Notif requested (MAY-05-2014), St Public Notif received (JUL-02-2014)
- MCL, Average - Between JAN-2014 and MAR-2014, Contaminant: TTHM. Follow-up actions: St AO (w/penalty) issued (MAY-05-2014), St Public Notif requested (MAY-05-2014), St Public Notif received (JUL-02-2014)
- MCL, Average - Between OCT-2013 and DEC-2013, Contaminant: TTHM. Follow-up actions: St Public Notif requested (MAY-05-2014), St AO (w/penalty) issued (MAY-05-2014)
- MCL, Average - Between OCT-2013 and DEC-2013, Contaminant: TTHM. Follow-up actions: St Public Notif requested (MAY-05-2014), St AO (w/penalty) issued (MAY-05-2014)
- 5 other older health violations
- Monitoring and Reporting (DBP) - Between JAN-2012 and MAR-2012, Contaminant: CARBON, TOTAL. Follow-up actions: St Compliance achieved (OCT-01-2013)
- Monitoring and Reporting (DBP) - Between OCT-2009 and DEC-2009, Contaminant: TTHM. Follow-up actions: St Public Notif requested (FEB-08-2010), St Violation/Reminder Notice (FEB-08-2010), St Compliance achieved (MAR-18-2011)
- Monitoring and Reporting (DBP) - Between OCT-2009 and DEC-2009, Contaminant: Total Haloacetic Acids (HAA5). Follow-up actions: St Public Notif requested (FEB-08-2010), St Violation/Reminder Notice (FEB-08-2010), St Compliance achieved (MAR-18-2011)
- Treatment Technique Precursor Removal - Between JUL-2007 and SEP-2007, Contaminant: CARBON, TOTAL. Follow-up actions: St AO (w/penalty) issued (MAR-07-2008), St Public Notif requested (MAR-07-2008), St Public Notif received (JUN-18-2008)
Past monitoring violations:
- Follow-up Or Routine LCR Tap M/R - In JAN-01-2010, Contaminant: Lead and Copper Rule. Follow-up actions: St Violation/Reminder Notice (JAN-27-2010), St Public Notif requested (JAN-27-2010), St Compliance achieved (OCT-22-2010)
- One regular monitoring violation
| This city: | 2.4 people |
| Oklahoma: | 2.5 people |
| This city: | 61.2% |
| Whole state: | 66.8% |
| This city: | 6.4% |
| Whole state: | 5.9% |
Likely homosexual households (counted as self-reported same-sex unmarried-partner households)
- Lesbian couples: 0.2% of all households
- Gay men: 0.3% of all households
People in group quarters in Chickasha in 2010:
- 590 people in local jails and other municipal confinement facilities
- 248 people in nursing facilities/skilled-nursing facilities
- 166 people in college/university student housing
- 18 people in other noninstitutional facilities
- 17 people in group homes for juveniles (non-correctional)
- 13 people in emergency and transitional shelters (with sleeping facilities) for people experiencing homelessness
People in group quarters in Chickasha in 2000:
- 320 people in nursing homes
- 314 people in college dormitories (includes college quarters off campus)
- 109 people in local jails and other confinement facilities (including police lockups)
- 52 people in other noninstitutional group quarters
Banks with branches in Chickasha (2011 data):
- The First National Bank and Trust Co., Chickasha, Oklahoma: Grand Avenue Branch, Chickasha Facility, The First National Bank And Trust Co., Chickasha, Oklahoma. Info updated 2007/03/14: Bank assets: $386.8 mil, Deposits: $332.5 mil, local headquarters, positive income, Commercial Lending Specialization, 11 total offices, Holding Company: First Independent Bancorp, Inc.
- The Stillwater National Bank and Trust Company: Chickasha Branch at 500 West Grand Avenue, branch established on 1898/01/01. Info updated 2006/10/04: Bank assets: $2,039.2 mil, Deposits: $1,673.8 mil, headquarters in Stillwater, OK, negative income in the last year, Commercial Lending Specialization, 16 total offices, Holding Company: Southwest Bancorp, Inc.
- Chickasha Bank & Trust Company: at 1924 South 4th Street, branch established on 1973/03/29. Info updated 2006/11/03: Bank assets: $179.9 mil, Deposits: $160.3 mil, local headquarters, positive income, Agricultural Specialization, 5 total offices, Holding Company: Chickasha Bancshares, Inc.
- MidFirst Bank: Chickasha Branch at 228 Chickasha Avenue, branch established on 1952/04/14. Info updated 2011/07/21: Bank assets: $9,790.2 mil, Deposits: $6,308.2 mil, headquarters in Oklahoma City, OK, positive income, Commercial Lending Specialization, 77 total offices
- International Bank of Commerce: Chickasha Branch at 628 Grand Avenue, branch established on 1921/01/01. Info updated 2007/03/28: Bank assets: $9,621.9 mil, Deposits: $6,548.8 mil, headquarters in Laredo, TX, positive income, Commercial Lending Specialization, 197 total offices, Holding Company: International Bancshares Corporation
- Arvest Bank: Chickasha Branch at 1927 South Fourth, branch established on 1988/07/29. Info updated 2010/11/29: Bank assets: $12,520.8 mil, Deposits: $10,446.2 mil, headquarters in Fayetteville, AR, positive income, Commercial Lending Specialization, 241 total offices, Holding Company: Arvest Bank Group, Inc.
- The City National Bank and Trust Company of Lawton, Oklahoma: Chickasha Branch at 2001 South 1st Street, branch established on 2006/01/31. Info updated 2006/11/03: Bank assets: $287.7 mil, Deposits: $245.8 mil, headquarters in Lawton, OK, positive income, Commercial Lending Specialization, 36 total offices, Holding Company: Jrmb Ii, Inc
For population 15 years and over in Chickasha:
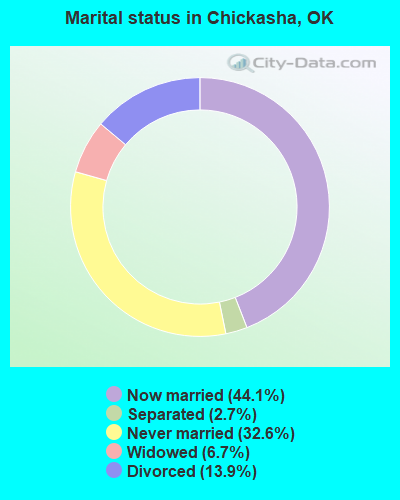
- Never married: 32.6%
- Now married: 44.1%
- Separated: 2.7%
- Widowed: 6.7%
- Divorced: 13.9%
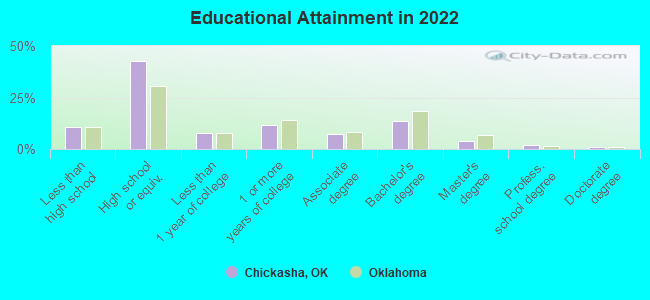
For population 25 years and over in Chickasha:
- High school or higher: 88.9%
- Bachelor's degree or higher: 19.4%
- Graduate or professional degree: 6.4%
- Unemployed: 7.5%
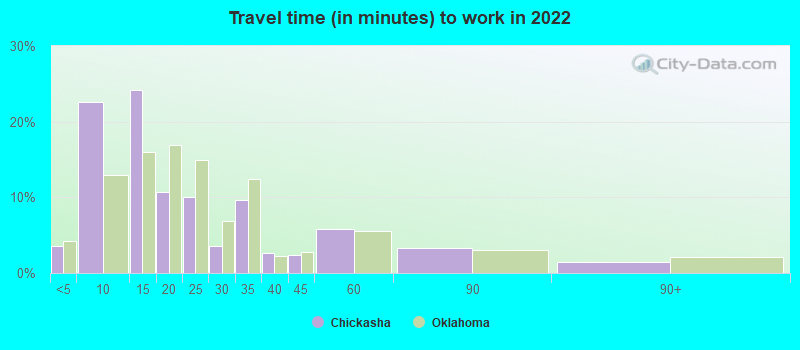
- Mean travel time to work (commute): 18.8 minutes
| Here: | 9.7 |
| Oklahoma average: | 11.3 |

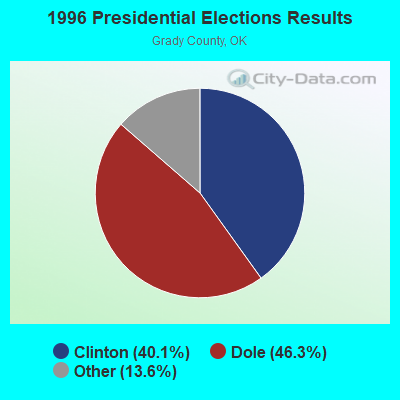
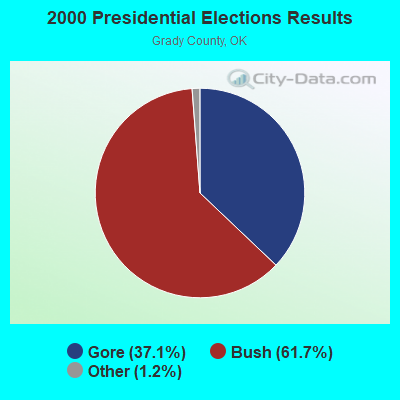
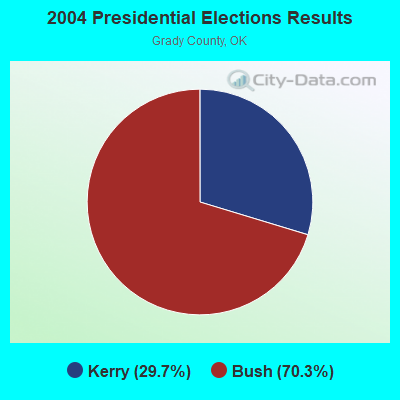
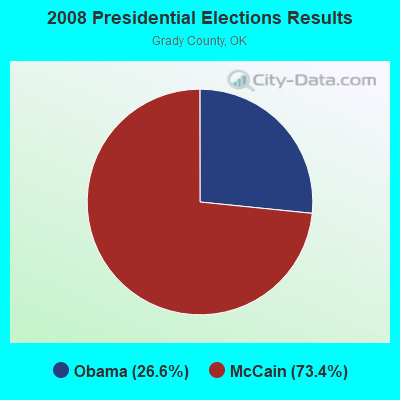
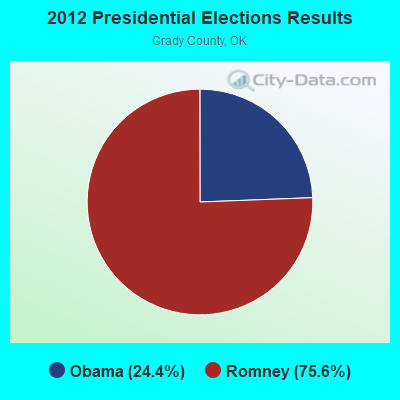
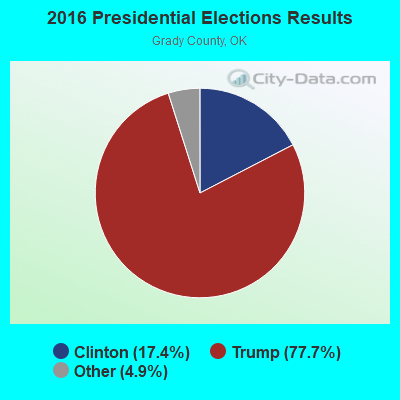
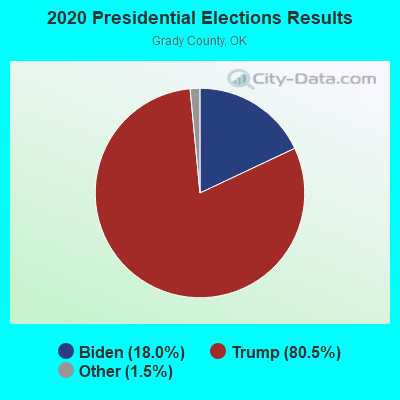
Graphs represent county-level data. Detailed 2008 Election Results
Religion statistics for Chickasha, OK (based on Grady County data)
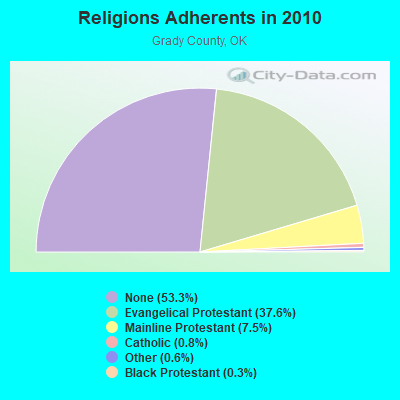
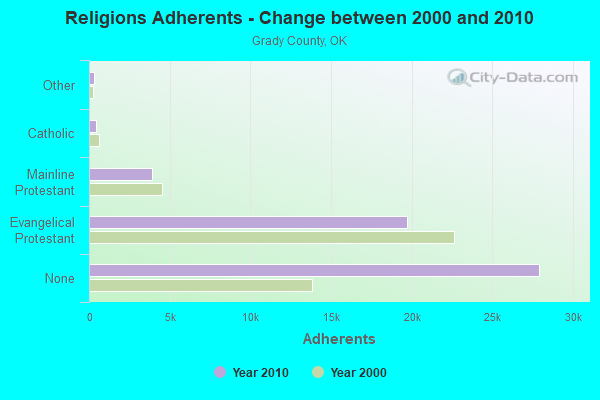
| Religion | Adherents | Congregations |
|---|---|---|
| Evangelical Protestant | 19,725 | 69 |
| Mainline Protestant | 3,909 | 13 |
| Catholic | 420 | 1 |
| Other | 291 | 2 |
| Black Protestant | 155 | 1 |
| None | 27,931 | - |
Food Environment Statistics:
| Grady County: | 1.59 / 10,000 pop. |
| Oklahoma: | 1.97 / 10,000 pop. |
| Grady County: | 0.79 / 10,000 pop. |
| Oklahoma: | 0.76 / 10,000 pop. |
| Grady County: | 6.15 / 10,000 pop. |
| Oklahoma: | 4.35 / 10,000 pop. |
| This county: | 3.96 / 10,000 pop. |
| State: | 6.89 / 10,000 pop. |
| This county: | 8.7% |
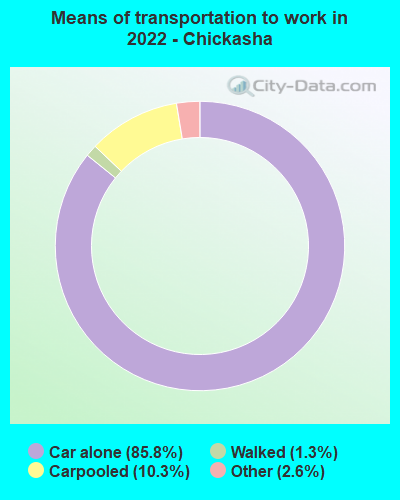
| Oklahoma: | 10.3% |
| Grady County: | 31.3% |
| Oklahoma: | 29.2% |
Health and Nutrition:
| Here: | 47.8% |
| Oklahoma: | 48.6% |
| Chickasha: | 43.5% |
| State: | 45.2% |
| Here: | 28.9 |
| State: | 28.7 |
| This city: | 21.5% |
| Oklahoma: | 21.4% |
| Chickasha: | 12.3% |
| Oklahoma: | 10.8% |
| Chickasha: | 6.8 |
| Oklahoma: | 6.8 |
| Chickasha: | 34.3% |
| State: | 33.9% |
| This city: | 53.7% |
| Oklahoma: | 55.2% |
| Here: | 77.2% |
| Oklahoma: | 78.4% |
More about Health and Nutrition of Chickasha, OK Residents
| Local government employment and payroll (March 2022) | |||||
| Function | Full-time employees | Monthly full-time payroll | Average yearly full-time wage | Part-time employees | Monthly part-time payroll |
|---|---|---|---|---|---|
| Firefighters | 37 | $212,295 | $68,852 | 0 | $0 |
| Police Protection - Officers | 19 | $101,594 | $64,165 | 0 | $0 |
| Other and Unallocable | 12 | $44,186 | $44,186 | 0 | $0 |
| Police - Other | 8 | $14,104 | $21,156 | 0 | $0 |
| Parks and Recreation | 8 | $27,236 | $40,854 | 0 | $0 |
| Water Supply | 6 | $21,906 | $43,812 | 0 | $0 |
| Local Libraries | 5 | $16,397 | $39,353 | 1 | $1,300 |
| Financial Administration | 4 | $36,886 | $110,658 | 0 | $0 |
| Streets and Highways | 4 | $11,284 | $33,852 | 0 | $0 |
| Other Government Administration | 3 | $23,186 | $92,744 | 0 | $0 |
| Airports | 2 | $4,823 | $28,938 | 0 | $0 |
| Fire - Other | 2 | $8,990 | $53,940 | 0 | $0 |
| Judicial and Legal | 2 | $4,648 | $27,888 | 0 | $0 |
| Solid Waste Management | 1 | $2,748 | $32,976 | 0 | $0 |
| Totals for Government | 113 | $530,280 | $56,313 | 1 | $1,300 |
Chickasha government finances - Expenditure in 2021 (per resident):
- Construction - Regular Highways: $1,287,000 ($77.77)
Water Utilities: $1,023,000 ($61.82)
Sewerage: $689,000 ($41.63)
Parks and Recreation: $27,000 ($1.63)
Air Transportation: $26,000 ($1.57)
- Current Operations - Police Protection: $4,220,000 ($255.00)
Water Utilities: $3,674,000 ($222.01)
Local Fire Protection: $2,861,000 ($172.88)
Solid Waste Management: $2,537,000 ($153.30)
Health - Other: $1,670,000 ($100.91)
Regular Highways: $1,606,000 ($97.05)
Housing and Community Development: $1,406,000 ($84.96)
Parks and Recreation: $1,354,000 ($81.82)
Central Staff Services: $1,313,000 ($79.34)
General - Other: $898,000 ($54.26)
Libraries: $472,000 ($28.52)
Air Transportation: $406,000 ($24.53)
- General - Interest on Debt: $7,000 ($0.42)
- Other Capital Outlay - Local Fire Protection: $963,000 ($58.19)
General - Other: $959,000 ($57.95)
Regular Highways: $535,000 ($32.33)
Parks and Recreation: $182,000 ($11.00)
Central Staff Services: $154,000 ($9.31)
Sewerage: $85,000 ($5.14)
Libraries: $79,000 ($4.77)
Water Utilities: $78,000 ($4.71)
Health - Other: $70,000 ($4.23)
Housing and Community Development: $43,000 ($2.60)
- Water Utilities - Interest on Debt: $189,000 ($11.42)
Chickasha government finances - Revenue in 2021 (per resident):
- Charges - Other: $1,815,000 ($109.67)
Solid Waste Management: $1,734,000 ($104.78)
Sewerage: $1,690,000 ($102.12)
Air Transportation: $279,000 ($16.86)
Parks and Recreation: $101,000 ($6.10)
- Federal Intergovernmental - Other: $35,000 ($2.11)
- Local Intergovernmental - Highways: $119,000 ($7.19)
General Local Government Support: $107,000 ($6.47)
- Miscellaneous - Royalties: $1,644,000 ($99.34)
Fines and Forfeits: $275,000 ($16.62)
General Revenue - Other: $202,000 ($12.21)
Rents: $172,000 ($10.39)
Interest Earnings: $68,000 ($4.11)
Sale of Property: $45,000 ($2.72)
- Revenue - Water Utilities: $2,519,000 ($152.21)
- State Intergovernmental - General Local Government Support: $80,000 ($4.83)
Other: $20,000 ($1.21)
Highways: $20,000 ($1.21)
- Tax - General Sales and Gross Receipts: $15,208,000 ($918.97)
Public Utilities Sales: $673,000 ($40.67)
Other Selective Sales: $502,000 ($30.33)
Occupation and Business License - Other: $247,000 ($14.93)
Other: $189,000 ($11.42)
Property: $157,000 ($9.49)
Chickasha government finances - Debt in 2021 (per resident):
- Long Term Debt - Beginning Outstanding - Unspecified Public Purpose: $4,630,000 ($279.78)
Outstanding Unspecified Public Purpose: $3,434,000 ($207.50)
Retired Unspecified Public Purpose: $1,196,000 ($72.27)
Chickasha government finances - Cash and Securities in 2021 (per resident):
- Bond Funds - Cash and Securities: $12,103,000 ($731.34)
- Other Funds - Cash and Securities: $33,337,000 ($2014.44)
- Sinking Funds - Cash and Securities: $536,000 ($32.39)
| Businesses in Chickasha, OK | ||||
| Name | Count | Name | Count | |
|---|---|---|---|---|
| AT&T | 1 | McDonald's | 2 | |
| Ace Hardware | 1 | Nike | 2 | |
| Arby's | 1 | Penske | 1 | |
| Ashley Furniture | 1 | Pizza Hut | 1 | |
| AutoZone | 1 | Quiznos | 1 | |
| Bath & Body Works | 1 | RadioShack | 1 | |
| Best Western | 1 | SONIC Drive-In | 1 | |
| CVS | 1 | Sears | 1 | |
| Chevrolet | 1 | Staples | 1 | |
| Circle K | 1 | Subway | 2 | |
| Dairy Queen | 1 | Super 8 | 1 | |
| Domino's Pizza | 1 | T-Mobile | 1 | |
| FedEx | 1 | Taco Bell | 1 | |
| Ford | 1 | True Value | 1 | |
| Goodwill | 1 | U-Haul | 1 | |
| H&R Block | 1 | U.S. Cellular | 1 | |
| Holiday Inn | 1 | UPS | 4 | |
| Jones New York | 1 | Verizon Wireless | 2 | |
| KFC | 1 | Walgreens | 1 | |
| Lane Furniture | 1 | Walmart | 1 | |
| Long John Silver's | 1 | YMCA | 1 | |
| Maurices | 1 | |||
Strongest AM radio stations in Chickasha:
- KOMA (1520 AM; 50 kW; OKLAHOMA CITY, OK; Owner: RENDA BROADCASTING CORP. OF NEVADA)
- KJON (850 AM; daytime; 5 kW; ANADARKO, OK; Owner: CARROLLTON BROADCASTING OF TEXAS, LP)
- WWLS (640 AM; 5 kW; MOORE, OK; Owner: CITADEL BROADCASTING COMPANY)
- KRMG (740 AM; 50 kW; TULSA, OK; Owner: CXR HOLDINGS, INC.)
- KTOK (1000 AM; 5 kW; OKLAHOMA CITY, OK; Owner: CLEAR CHANNEL BROADCASTING LICENSES, INC.)
- KQCV (800 AM; 2 kW; OKLAHOMA CITY, OK; Owner: BOTT BROADCASTING COMPANY)
- WKY (930 AM; 5 kW; OKLAHOMA CITY, OK; Owner: CITADEL BROADCASTING COMPANY)
- KFAQ (1170 AM; 50 kW; TULSA, OK; Owner: JOURNAL BROADCAST CORPORATION)
- WBAP (820 AM; 50 kW; FORT WORTH, TX; Owner: WBAP-KSCS OPERATING, LTD.)
- KRLD (1080 AM; 50 kW; DALLAS, TX; Owner: TEXAS INFINITY BROADCASTING L.P.)
- KAHZ (1360 AM; 50 kW; HURST, TX)
- KESS (1270 AM; 50 kW; FORT WORTH, TX; Owner: KESS-AM LICENSE CORP.)
- KFXR (1190 AM; 50 kW; DALLAS, TX; Owner: CLEAR CHANNEL BROADCASTING LICENSES, INC.)
Strongest FM radio stations in Chickasha:
- KWCO-FM (105.5 FM; CHICKASHA, OK; Owner: TYLER ENTERPRISES, L.L.C.)
- K209DJ (89.7 FM; CHICKASHA, OK; Owner: CALVARY CHAPEL OF TWIN FALLS, INC.)
- K219KL (91.7 FM; NINNEKAH, OK; Owner: CALVARY CHAPEL OF TWIN FALLS, INC.)
- KKNG-FM (93.3 FM; NEWCASTLE, OK; Owner: TYLER BROADCASTING CORPORATION)
- KSYY (105.3 FM; KINGFISHER, OK; Owner: CITADEL BROADCASTING COMPANY)
- KRMP (103.5 FM; ANADARKO, OK; Owner: PERRY BROADCASTING OF SOUTHWEST OKLAHOMA, INC.)
- KFXI (92.1 FM; MARLOW, OK; Owner: DFWU, INC.)
- KHBZ-FM (94.7 FM; OKLAHOMA CITY, OK; Owner: CLEAR CHANNEL BROADCASTING LICENSES, INC.)
- KTST (101.9 FM; OKLAHOMA CITY, OK; Owner: CLEAR CHANNEL BROADCASTING LICENSES, INC.)
- KMSI (88.1 FM; MOORE, OK; Owner: CREATIVE EDUCATIONAL MEDIA CORPORATION, INC.)
- KMGL (104.1 FM; OKLAHOMA CITY, OK; Owner: RENDA BROADCASTING CORP. OF NEVADA)
- KBLP (105.1 FM; LINDSAY, OK; Owner: SO. CENTRAL OKLA. B/C & ADVERTISING)
- KJYO (102.7 FM; OKLAHOMA CITY, OK; Owner: CLEAR CHANNEL BROADCASTING LICENSES, INC.)
- KXXY-FM (96.1 FM; OKLAHOMA CITY, OK; Owner: CLEAR CHANNEL BROADCASTING LICENSES, INC.)
- KATT-FM (100.5 FM; OKLAHOMA CITY, OK; Owner: CITADEL BROADCASTING COMPANY)
- KTUZ-FM (106.7 FM; OKARCHE, OK; Owner: TYLER BROADCASTING CORPORATION)
- KYIS (98.9 FM; OKLAHOMA CITY, OK; Owner: CITADEL BROADCASTING COMPANY)
- KRXO (107.7 FM; OKLAHOMA CITY, OK; Owner: RENDA BROADCASTING CORPORATION OF NV)
- KOMA-FM (92.5 FM; OKLAHOMA CITY, OK; Owner: RENDA BROADCASTING CORPORATION OF NV)
- KJRF (91.1 FM; LAWTON, OK; Owner: THE CHRISTIAN CENTER INC)
TV broadcast stations around Chickasha:
- KWTV (Channel 9; OKLAHOMA CITY, OK; Owner: GRIFFIN ENTITIES, L.L.C.)
- KOCO-TV (Channel 5; OKLAHOMA CITY, OK; Owner: OHIO/OKLAHOMA HEARST- ARGYLE TELEVISION)
- KOKH-TV (Channel 25; OKLAHOMA CITY, OK; Owner: KOKH LICENSEE, LLC)
- KETA-TV (Channel 13; OKLAHOMA CITY, OK; Owner: OKLAHOMA EDUCATIONAL TELEVISION AUTHORITY)
- KOCB (Channel 34; OKLAHOMA CITY, OK; Owner: KOCB LICENSEE, LLC)
- KOPX (Channel 62; OKLAHOMA CITY, OK; Owner: PAXSON OKLAHOMA CITY LICENSE, INC.)
- KFOR-TV (Channel 4; OKLAHOMA CITY, OK; Owner: NEW YORK TIMES MANAGEMENT SERVICES)
- KSBI (Channel 52; OKLAHOMA CITY, OK; Owner: LOCKE SUPPLY CO.)
- KKCC-LP (Channel 19; OKLAHOMA CITY, OK; Owner: EICB-TV, LLC)
- KDSA-LP (Channel 11; NORMAN, OK; Owner: DAY STAR BROADCASTING CORPORATION)
- KQOK (Channel 30; SHAWNEE, OK; Owner: SHAWNEE BROADCASTING, INC.)
- KTBO-TV (Channel 14; OKLAHOMA CITY, OK; Owner: TRINITY BROADCASTING OF OKLAHOMA CITY, INC.)
- KTOU-LP (Channel 21; OKLAHOMA CITY, OK; Owner: MAKO COMMUNICATIONS, LLC)
- National Bridge Inventory (NBI) Statistics
- 114Number of bridges
- 1,266ft / 386mTotal length
- $105,614,000Total costs
- 558,927Total average daily traffic
- 128,066Total average daily truck traffic
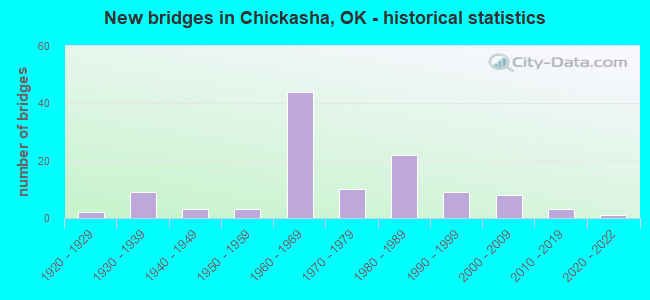
- New bridges - historical statistics
- 21920-1929
- 91930-1939
- 31940-1949
- 31950-1959
- 441960-1969
- 101970-1979
- 221980-1989
- 91990-1999
- 82000-2009
- 32010-2019
- 12020-2022
FCC Registered Antenna Towers: 163 (See the full list of FCC Registered Antenna Towers)
FCC Registered Private Land Mobile Towers: 3 (See the full list of FCC Registered Private Land Mobile Towers in Chickasha, OK)
FCC Registered Broadcast Land Mobile Towers: 28 (See the full list of FCC Registered Broadcast Land Mobile Towers)
FCC Registered Microwave Towers: 26 (See the full list of FCC Registered Microwave Towers in this town)
FCC Registered Paging Towers: 6 (See the full list of FCC Registered Paging Towers)
FCC Registered Maritime Coast & Aviation Ground Towers: 3 (See the full list of FCC Registered Maritime Coast & Aviation Ground Towers)
FCC Registered Amateur Radio Licenses: 77 (See the full list of FCC Registered Amateur Radio Licenses in Chickasha)
FAA Registered Aircraft Manufacturers and Dealers: 2 (See the full list of FAA Registered Manufacturers and Dealers in Chickasha)
FAA Registered Aircraft: 32 (See the full list of FAA Registered Aircraft)
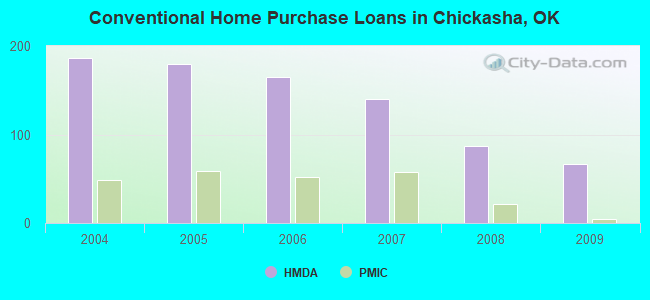
| Home Mortgage Disclosure Act Aggregated Statistics For Year 2009 (Based on 3 full and 2 partial tracts) | ||||||||||||
| A) FHA, FSA/RHS & VA Home Purchase Loans | B) Conventional Home Purchase Loans | C) Refinancings | D) Home Improvement Loans | F) Non-occupant Loans on < 5 Family Dwellings (A B C & D) | G) Loans On Manufactured Home Dwelling (A B C & D) | |||||||
|---|---|---|---|---|---|---|---|---|---|---|---|---|
| Number | Average Value | Number | Average Value | Number | Average Value | Number | Average Value | Number | Average Value | Number | Average Value | |
| LOANS ORIGINATED | 64 | $84,458 | 67 | $56,783 | 133 | $94,431 | 39 | $44,045 | 64 | $55,586 | 6 | $51,032 |
| APPLICATIONS APPROVED, NOT ACCEPTED | 8 | $70,699 | 0 | $0 | 16 | $91,811 | 1 | $13,000 | 1 | $162,860 | 1 | $33,150 |
| APPLICATIONS DENIED | 12 | $62,911 | 25 | $51,814 | 82 | $85,868 | 34 | $23,887 | 8 | $32,333 | 8 | $41,074 |
| APPLICATIONS WITHDRAWN | 1 | $109,530 | 6 | $79,372 | 30 | $104,923 | 8 | $36,905 | 3 | $17,937 | 1 | $48,280 |
| FILES CLOSED FOR INCOMPLETENESS | 0 | $0 | 3 | $57,800 | 12 | $87,829 | 0 | $0 | 0 | $0 | 1 | $88,000 |
Detailed HMDA statistics for the following Tracts: 0001.00 , 0002.00, 0003.00, 0004.00, 0005.00
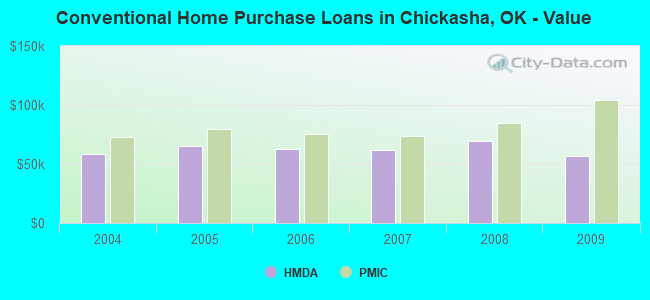
| Private Mortgage Insurance Companies Aggregated Statistics For Year 2009 (Based on 2 full and 1 partial tracts) | ||||
| A) Conventional Home Purchase Loans | B) Refinancings | |||
|---|---|---|---|---|
| Number | Average Value | Number | Average Value | |
| LOANS ORIGINATED | 4 | $104,488 | 0 | $0 |
| APPLICATIONS APPROVED, NOT ACCEPTED | 3 | $110,553 | 2 | $166,200 |
| APPLICATIONS DENIED | 2 | $148,445 | 4 | $182,672 |
| APPLICATIONS WITHDRAWN | 1 | $88,630 | 1 | $38,190 |
| FILES CLOSED FOR INCOMPLETENESS | 0 | $0 | 0 | $0 |
Detailed PMIC statistics for the following Tracts: 0001.00 , 0002.00, 0003.00, 0004.00, 0005.00
2002 - 2018 National Fire Incident Reporting System (NFIRS) incidents
- Fire incident types reported to NFIRS in Chickasha, OK
- 1,50155.0%Outside Fires
- 75727.7%Structure Fires
- 31811.7%Mobile Property/Vehicle Fires
- 1535.6%Other
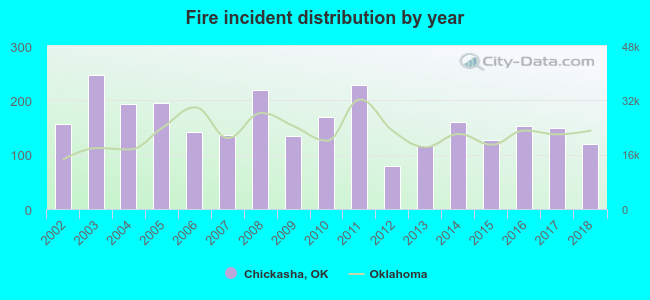 According to the data from the years 2002 - 2018 the average number of fire incidents per year is 161. The highest number of fire incidents - 246 took place in 2003, and the least - 80 in 2012. The data has a decreasing trend.
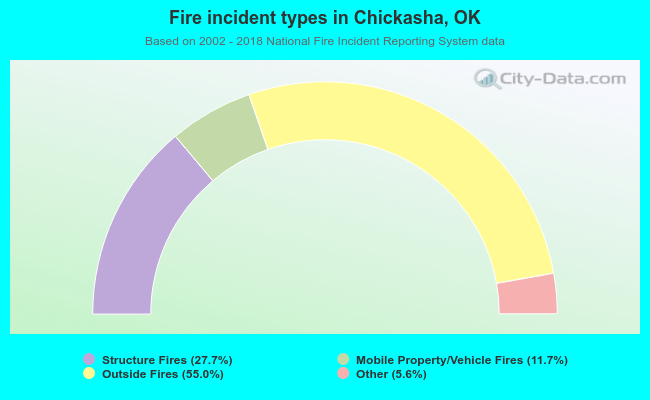 When looking into fire subcategories, the most reports belonged to: Outside Fires (55.0%), and Structure Fires (27.7%).
Fire-safe hotels and motels in Chickasha, Oklahoma:
- Days Inn, 2701 S 4th St, Chickasha, Oklahoma 73018 , Phone: (405) 222-5800, Fax: (405) 222-5800
- Super 8 Motel, 2728 S 4th St, Chickasha, Oklahoma 73018 , Phone: (405) 222-3710, Fax: (405) 222-3712
- Hampton Inn, 3004 S 4th St, Chickasha, Oklahoma 73018 , Phone: (405) 320-5955, Fax: (405) 320-5977
- Quality Inn, 2101 S 4th, Chickasha, Oklahoma 73018 , Phone: (405) 224-4890, Fax: (405) 224-3411
- Fairfield Inn & Suites, 2812 S 4th St, Chickasha, Oklahoma 73018 , Phone: (405) 224-0152, Fax: (405) 224-0154
| Most common first names in Chickasha, OK among deceased individuals | ||
| Name | Count | Lived (average) |
|---|---|---|
| Mary | 190 | 81.1 years |
| James | 173 | 75.3 years |
| William | 161 | 76.8 years |
| John | 157 | 76.6 years |
| Robert | 127 | 72.8 years |
| George | 81 | 76.7 years |
| Charles | 71 | 71.5 years |
| Willie | 66 | 78.4 years |
| Ruby | 54 | 79.3 years |
| Dorothy | 50 | 79.2 years |
| Most common last names in Chickasha, OK among deceased individuals | ||
| Last name | Count | Lived (average) |
|---|---|---|
| Smith | 120 | 77.0 years |
| Johnson | 85 | 73.4 years |
| Williams | 74 | 78.3 years |
| Jones | 64 | 74.2 years |
| Brown | 63 | 78.1 years |
| Davis | 48 | 76.5 years |
| Taylor | 48 | 74.8 years |
| Moore | 44 | 72.2 years |
| Wilson | 36 | 76.2 years |
| Hill | 36 | 76.6 years |
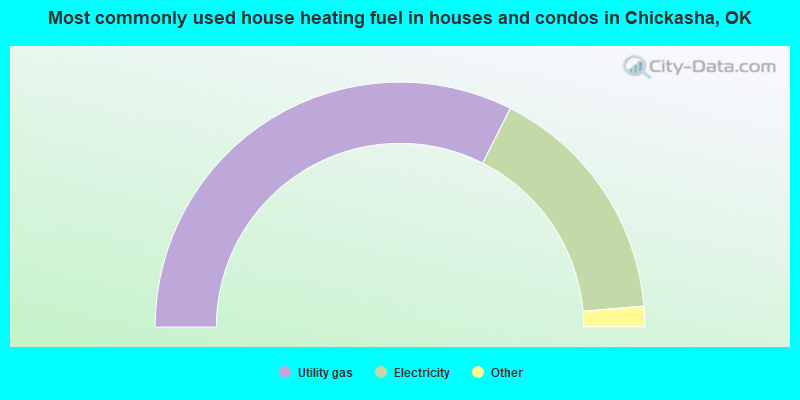
- 64.9%Utility gas
- 32.4%Electricity
- 1.1%Bottled, tank, or LP gas
- 1.0%No fuel used
- 0.4%Wood
- 0.2%Fuel oil, kerosene, etc.
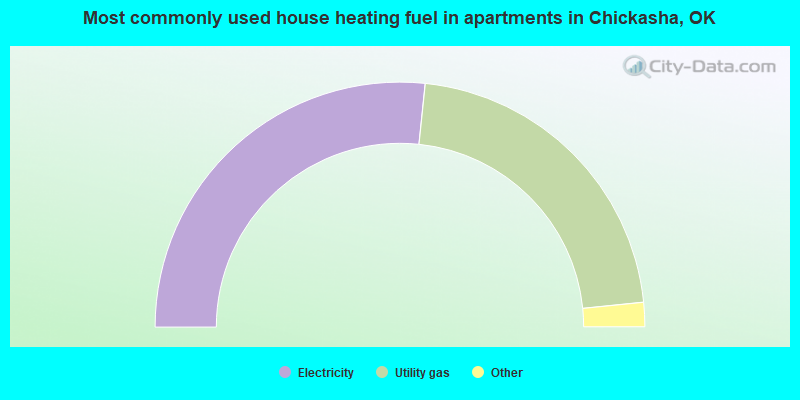
- 53.3%Electricity
- 43.5%Utility gas
- 2.0%No fuel used
- 0.6%Wood
- 0.3%Bottled, tank, or LP gas
- 0.3%Fuel oil, kerosene, etc.
Chickasha compared to Oklahoma state average:
- Median house value below state average.
- Unemployed percentage below state average.
- Foreign-born population percentage significantly below state average.
- Length of stay since moving in significantly above state average.
- House age above state average.
- Institutionalized population percentage above state average.
Chickasha on our top lists:
- #91 on the list of "Top 101 cities with largest percentage of females in industries: mining, quarrying, and oil and gas extraction (population 5,000+)"
- #67 on the list of "Top 101 counties with the lowest surface withdrawal of fresh water for public supply"
State forum archive:

|
|
Total of 63 patent applications in 2008-2024.