Pell City, Alabama Submit your own pictures of this city and show them to the world
OSM Map
General Map
Google Map
MSN Map
OSM Map
General Map
Google Map
MSN Map
OSM Map
General Map
Google Map
MSN Map
OSM Map
General Map
Google Map
MSN Map
Please wait while loading the map...
Population in 2022: 13,638 (73% urban, 27% rural). Population change since 2000: +42.6%Males: 6,584 Females: 7,054
March 2022 cost of living index in Pell City: 86.7 (less than average, U.S. average is 100) Percentage of residents living in poverty in 2022: 12.1%for White Non-Hispanic residents , 22.1% for Black residents , 47.6% for Hispanic or Latino residents , 29.9% for two or more races residents )
Profiles of local businesses
Business Search - 14 Million verified businesses
Data:
Median household income ($)
Median household income (% change since 2000)
Household income diversity
Ratio of average income to average house value (%)
Ratio of average income to average rent
Median household income ($) - White
Median household income ($) - Black or African American
Median household income ($) - Asian
Median household income ($) - Hispanic or Latino
Median household income ($) - American Indian and Alaska Native
Median household income ($) - Multirace
Median household income ($) - Other Race
Median household income for houses/condos with a mortgage ($)
Median household income for apartments without a mortgage ($)
Races - White alone (%)
Races - White alone (% change since 2000)
Races - Black alone (%)
Races - Black alone (% change since 2000)
Races - American Indian alone (%)
Races - American Indian alone (% change since 2000)
Races - Asian alone (%)
Races - Asian alone (% change since 2000)
Races - Hispanic (%)
Races - Hispanic (% change since 2000)
Races - Native Hawaiian and Other Pacific Islander alone (%)
Races - Native Hawaiian and Other Pacific Islander alone (% change since 2000)
Races - Two or more races (%)
Races - Two or more races (% change since 2000)
Races - Other race alone (%)
Races - Other race alone (% change since 2000)
Racial diversity
Unemployment (%)
Unemployment (% change since 2000)
Unemployment (%) - White
Unemployment (%) - Black or African American
Unemployment (%) - Asian
Unemployment (%) - Hispanic or Latino
Unemployment (%) - American Indian and Alaska Native
Unemployment (%) - Multirace
Unemployment (%) - Other Race
Population density (people per square mile)
Population - Males (%)
Population - Females (%)
Population - Males (%) - White
Population - Males (%) - Black or African American
Population - Males (%) - Asian
Population - Males (%) - Hispanic or Latino
Population - Males (%) - American Indian and Alaska Native
Population - Males (%) - Multirace
Population - Males (%) - Other Race
Population - Females (%) - White
Population - Females (%) - Black or African American
Population - Females (%) - Asian
Population - Females (%) - Hispanic or Latino
Population - Females (%) - American Indian and Alaska Native
Population - Females (%) - Multirace
Population - Females (%) - Other Race
Coronavirus confirmed cases (May 04, 2024)
Deaths caused by coronavirus (May 04, 2024)
Coronavirus confirmed cases (per 100k population) (May 04, 2024)
Deaths caused by coronavirus (per 100k population) (May 04, 2024)
Daily increase in number of cases (May 04, 2024)
Weekly increase in number of cases (May 04, 2024)
Cases doubled (in days) (May 04, 2024)
Hospitalized patients (Apr 18, 2022)
Negative test results (Apr 18, 2022)
Total test results (Apr 18, 2022)
COVID Vaccine doses distributed (per 100k population) (Sep 19, 2023)
COVID Vaccine doses administered (per 100k population) (Sep 19, 2023)
COVID Vaccine doses distributed (Sep 19, 2023)
COVID Vaccine doses administered (Sep 19, 2023)
Likely homosexual households (%)
Likely homosexual households (% change since 2000)
Likely homosexual households - Lesbian couples (%)
Likely homosexual households - Lesbian couples (% change since 2000)
Likely homosexual households - Gay men (%)
Likely homosexual households - Gay men (% change since 2000)
Cost of living index
Median gross rent ($)
Median contract rent ($)
Median monthly housing costs ($)
Median house or condo value ($)
Median house or condo value ($ change since 2000)
Mean house or condo value by units in structure - 1, detached ($)
Mean house or condo value by units in structure - 1, attached ($)
Mean house or condo value by units in structure - 2 ($)
Mean house or condo value by units in structure by units in structure - 3 or 4 ($)
Mean house or condo value by units in structure - 5 or more ($)
Mean house or condo value by units in structure - Boat, RV, van, etc. ($)
Mean house or condo value by units in structure - Mobile home ($)
Median house or condo value ($) - White
Median house or condo value ($) - Black or African American
Median house or condo value ($) - Asian
Median house or condo value ($) - Hispanic or Latino
Median house or condo value ($) - American Indian and Alaska Native
Median house or condo value ($) - Multirace
Median house or condo value ($) - Other Race
Median resident age
Resident age diversity
Median resident age - Males
Median resident age - Females
Median resident age - White
Median resident age - Black or African American
Median resident age - Asian
Median resident age - Hispanic or Latino
Median resident age - American Indian and Alaska Native
Median resident age - Multirace
Median resident age - Other Race
Median resident age - Males - White
Median resident age - Males - Black or African American
Median resident age - Males - Asian
Median resident age - Males - Hispanic or Latino
Median resident age - Males - American Indian and Alaska Native
Median resident age - Males - Multirace
Median resident age - Males - Other Race
Median resident age - Females - White
Median resident age - Females - Black or African American
Median resident age - Females - Asian
Median resident age - Females - Hispanic or Latino
Median resident age - Females - American Indian and Alaska Native
Median resident age - Females - Multirace
Median resident age - Females - Other Race
Commute - mean travel time to work (minutes)
Travel time to work - Less than 5 minutes (%)
Travel time to work - Less than 5 minutes (% change since 2000)
Travel time to work - 5 to 9 minutes (%)
Travel time to work - 5 to 9 minutes (% change since 2000)
Travel time to work - 10 to 19 minutes (%)
Travel time to work - 10 to 19 minutes (% change since 2000)
Travel time to work - 20 to 29 minutes (%)
Travel time to work - 20 to 29 minutes (% change since 2000)
Travel time to work - 30 to 39 minutes (%)
Travel time to work - 30 to 39 minutes (% change since 2000)
Travel time to work - 40 to 59 minutes (%)
Travel time to work - 40 to 59 minutes (% change since 2000)
Travel time to work - 60 to 89 minutes (%)
Travel time to work - 60 to 89 minutes (% change since 2000)
Travel time to work - 90 or more minutes (%)
Travel time to work - 90 or more minutes (% change since 2000)
Marital status - Never married (%)
Marital status - Now married (%)
Marital status - Separated (%)
Marital status - Widowed (%)
Marital status - Divorced (%)
Median family income ($)
Median family income (% change since 2000)
Median non-family income ($)
Median non-family income (% change since 2000)
Median per capita income ($)
Median per capita income (% change since 2000)
Median family income ($) - White
Median family income ($) - Black or African American
Median family income ($) - Asian
Median family income ($) - Hispanic or Latino
Median family income ($) - American Indian and Alaska Native
Median family income ($) - Multirace
Median family income ($) - Other Race
Median year house/condo built
Median year apartment built
Year house built - Built 2005 or later (%)
Year house built - Built 2000 to 2004 (%)
Year house built - Built 1990 to 1999 (%)
Year house built - Built 1980 to 1989 (%)
Year house built - Built 1970 to 1979 (%)
Year house built - Built 1960 to 1969 (%)
Year house built - Built 1950 to 1959 (%)
Year house built - Built 1940 to 1949 (%)
Year house built - Built 1939 or earlier (%)
Average household size
Household density (households per square mile)
Average household size - White
Average household size - Black or African American
Average household size - Asian
Average household size - Hispanic or Latino
Average household size - American Indian and Alaska Native
Average household size - Multirace
Average household size - Other Race
Occupied housing units (%)
Vacant housing units (%)
Owner occupied housing units (%)
Renter occupied housing units (%)
Vacancy status - For rent (%)
Vacancy status - For sale only (%)
Vacancy status - Rented or sold, not occupied (%)
Vacancy status - For seasonal, recreational, or occasional use (%)
Vacancy status - For migrant workers (%)
Vacancy status - Other vacant (%)
Residents with income below the poverty level (%)
Residents with income below 50% of the poverty level (%)
Children below poverty level (%)
Poor families by family type - Married-couple family (%)
Poor families by family type - Male, no wife present (%)
Poor families by family type - Female, no husband present (%)
Poverty status for native-born residents (%)
Poverty status for foreign-born residents (%)
Poverty among high school graduates not in families (%)
Poverty among people who did not graduate high school not in families (%)
Residents with income below the poverty level (%) - White
Residents with income below the poverty level (%) - Black or African American
Residents with income below the poverty level (%) - Asian
Residents with income below the poverty level (%) - Hispanic or Latino
Residents with income below the poverty level (%) - American Indian and Alaska Native
Residents with income below the poverty level (%) - Multirace
Residents with income below the poverty level (%) - Other Race
Air pollution - Air Quality Index (AQI)
Air pollution - CO
Air pollution - NO2
Air pollution - SO2
Air pollution - Ozone
Air pollution - PM10
Air pollution - PM25
Air pollution - Pb
Crime - Murders per 100,000 population
Crime - Rapes per 100,000 population
Crime - Robberies per 100,000 population
Crime - Assaults per 100,000 population
Crime - Burglaries per 100,000 population
Crime - Thefts per 100,000 population
Crime - Auto thefts per 100,000 population
Crime - Arson per 100,000 population
Crime - City-data.com crime index
Crime - Violent crime index
Crime - Property crime index
Crime - Murders per 100,000 population (5 year average)
Crime - Rapes per 100,000 population (5 year average)
Crime - Robberies per 100,000 population (5 year average)
Crime - Assaults per 100,000 population (5 year average)
Crime - Burglaries per 100,000 population (5 year average)
Crime - Thefts per 100,000 population (5 year average)
Crime - Auto thefts per 100,000 population (5 year average)
Crime - Arson per 100,000 population (5 year average)
Crime - City-data.com crime index (5 year average)
Crime - Violent crime index (5 year average)
Crime - Property crime index (5 year average)
1996 Presidential Elections Results (%) - Democratic Party (Clinton)
1996 Presidential Elections Results (%) - Republican Party (Dole)
1996 Presidential Elections Results (%) - Other
2000 Presidential Elections Results (%) - Democratic Party (Gore)
2000 Presidential Elections Results (%) - Republican Party (Bush)
2000 Presidential Elections Results (%) - Other
2004 Presidential Elections Results (%) - Democratic Party (Kerry)
2004 Presidential Elections Results (%) - Republican Party (Bush)
2004 Presidential Elections Results (%) - Other
2008 Presidential Elections Results (%) - Democratic Party (Obama)
2008 Presidential Elections Results (%) - Republican Party (McCain)
2008 Presidential Elections Results (%) - Other
2012 Presidential Elections Results (%) - Democratic Party (Obama)
2012 Presidential Elections Results (%) - Republican Party (Romney)
2012 Presidential Elections Results (%) - Other
2016 Presidential Elections Results (%) - Democratic Party (Clinton)
2016 Presidential Elections Results (%) - Republican Party (Trump)
2016 Presidential Elections Results (%) - Other
2020 Presidential Elections Results (%) - Democratic Party (Biden)
2020 Presidential Elections Results (%) - Republican Party (Trump)
2020 Presidential Elections Results (%) - Other
Ancestries Reported - Arab (%)
Ancestries Reported - Czech (%)
Ancestries Reported - Danish (%)
Ancestries Reported - Dutch (%)
Ancestries Reported - English (%)
Ancestries Reported - French (%)
Ancestries Reported - French Canadian (%)
Ancestries Reported - German (%)
Ancestries Reported - Greek (%)
Ancestries Reported - Hungarian (%)
Ancestries Reported - Irish (%)
Ancestries Reported - Italian (%)
Ancestries Reported - Lithuanian (%)
Ancestries Reported - Norwegian (%)
Ancestries Reported - Polish (%)
Ancestries Reported - Portuguese (%)
Ancestries Reported - Russian (%)
Ancestries Reported - Scotch-Irish (%)
Ancestries Reported - Scottish (%)
Ancestries Reported - Slovak (%)
Ancestries Reported - Subsaharan African (%)
Ancestries Reported - Swedish (%)
Ancestries Reported - Swiss (%)
Ancestries Reported - Ukrainian (%)
Ancestries Reported - United States (%)
Ancestries Reported - Welsh (%)
Ancestries Reported - West Indian (%)
Ancestries Reported - Other (%)
Educational Attainment - No schooling completed (%)
Educational Attainment - Less than high school (%)
Educational Attainment - High school or equivalent (%)
Educational Attainment - Less than 1 year of college (%)
Educational Attainment - 1 or more years of college (%)
Educational Attainment - Associate degree (%)
Educational Attainment - Bachelor's degree (%)
Educational Attainment - Master's degree (%)
Educational Attainment - Professional school degree (%)
Educational Attainment - Doctorate degree (%)
School Enrollment - Nursery, preschool (%)
School Enrollment - Kindergarten (%)
School Enrollment - Grade 1 to 4 (%)
School Enrollment - Grade 5 to 8 (%)
School Enrollment - Grade 9 to 12 (%)
School Enrollment - College undergrad (%)
School Enrollment - Graduate or professional (%)
School Enrollment - Not enrolled in school (%)
School enrollment - Public schools (%)
School enrollment - Private schools (%)
School enrollment - Not enrolled (%)
Median number of rooms in houses and condos
Median number of rooms in apartments
Housing units lacking complete plumbing facilities (%)
Housing units lacking complete kitchen facilities (%)
Density of houses
Urban houses (%)
Rural houses (%)
Households with people 60 years and over (%)
Households with people 65 years and over (%)
Households with people 75 years and over (%)
Households with one or more nonrelatives (%)
Households with no nonrelatives (%)
Population in households (%)
Family households (%)
Nonfamily households (%)
Population in families (%)
Family households with own children (%)
Median number of bedrooms in owner occupied houses
Mean number of bedrooms in owner occupied houses
Median number of bedrooms in renter occupied houses
Mean number of bedrooms in renter occupied houses
Median number of vehichles in owner occupied houses
Mean number of vehichles in owner occupied houses
Median number of vehichles in renter occupied houses
Mean number of vehichles in renter occupied houses
Mortgage status - with mortgage (%)
Mortgage status - with second mortgage (%)
Mortgage status - with home equity loan (%)
Mortgage status - with both second mortgage and home equity loan (%)
Mortgage status - without a mortgage (%)
Average family size
Average family size - White
Average family size - Black or African American
Average family size - Asian
Average family size - Hispanic or Latino
Average family size - American Indian and Alaska Native
Average family size - Multirace
Average family size - Other Race
Geographical mobility - Same house 1 year ago (%)
Geographical mobility - Moved within same county (%)
Geographical mobility - Moved from different county within same state (%)
Geographical mobility - Moved from different state (%)
Geographical mobility - Moved from abroad (%)
Place of birth - Born in state of residence (%)
Place of birth - Born in other state (%)
Place of birth - Native, outside of US (%)
Place of birth - Foreign born (%)
Housing units in structures - 1, detached (%)
Housing units in structures - 1, attached (%)
Housing units in structures - 2 (%)
Housing units in structures - 3 or 4 (%)
Housing units in structures - 5 to 9 (%)
Housing units in structures - 10 to 19 (%)
Housing units in structures - 20 to 49 (%)
Housing units in structures - 50 or more (%)
Housing units in structures - Mobile home (%)
Housing units in structures - Boat, RV, van, etc. (%)
House/condo owner moved in on average (years ago)
Renter moved in on average (years ago)
Year householder moved into unit - Moved in 1999 to March 2000 (%)
Year householder moved into unit - Moved in 1995 to 1998 (%)
Year householder moved into unit - Moved in 1990 to 1994 (%)
Year householder moved into unit - Moved in 1980 to 1989 (%)
Year householder moved into unit - Moved in 1970 to 1979 (%)
Year householder moved into unit - Moved in 1969 or earlier (%)
Means of transportation to work - Drove car alone (%)
Means of transportation to work - Carpooled (%)
Means of transportation to work - Public transportation (%)
Means of transportation to work - Bus or trolley bus (%)
Means of transportation to work - Streetcar or trolley car (%)
Means of transportation to work - Subway or elevated (%)
Means of transportation to work - Railroad (%)
Means of transportation to work - Ferryboat (%)
Means of transportation to work - Taxicab (%)
Means of transportation to work - Motorcycle (%)
Means of transportation to work - Bicycle (%)
Means of transportation to work - Walked (%)
Means of transportation to work - Other means (%)
Working at home (%)
Industry diversity
Most Common Industries - Agriculture, forestry, fishing and hunting, and mining (%)
Most Common Industries - Agriculture, forestry, fishing and hunting (%)
Most Common Industries - Mining, quarrying, and oil and gas extraction (%)
Most Common Industries - Construction (%)
Most Common Industries - Manufacturing (%)
Most Common Industries - Wholesale trade (%)
Most Common Industries - Retail trade (%)
Most Common Industries - Transportation and warehousing, and utilities (%)
Most Common Industries - Transportation and warehousing (%)
Most Common Industries - Utilities (%)
Most Common Industries - Information (%)
Most Common Industries - Finance and insurance, and real estate and rental and leasing (%)
Most Common Industries - Finance and insurance (%)
Most Common Industries - Real estate and rental and leasing (%)
Most Common Industries - Professional, scientific, and management, and administrative and waste management services (%)
Most Common Industries - Professional, scientific, and technical services (%)
Most Common Industries - Management of companies and enterprises (%)
Most Common Industries - Administrative and support and waste management services (%)
Most Common Industries - Educational services, and health care and social assistance (%)
Most Common Industries - Educational services (%)
Most Common Industries - Health care and social assistance (%)
Most Common Industries - Arts, entertainment, and recreation, and accommodation and food services (%)
Most Common Industries - Arts, entertainment, and recreation (%)
Most Common Industries - Accommodation and food services (%)
Most Common Industries - Other services, except public administration (%)
Most Common Industries - Public administration (%)
Occupation diversity
Most Common Occupations - Management, business, science, and arts occupations (%)
Most Common Occupations - Management, business, and financial occupations (%)
Most Common Occupations - Management occupations (%)
Most Common Occupations - Business and financial operations occupations (%)
Most Common Occupations - Computer, engineering, and science occupations (%)
Most Common Occupations - Computer and mathematical occupations (%)
Most Common Occupations - Architecture and engineering occupations (%)
Most Common Occupations - Life, physical, and social science occupations (%)
Most Common Occupations - Education, legal, community service, arts, and media occupations (%)
Most Common Occupations - Community and social service occupations (%)
Most Common Occupations - Legal occupations (%)
Most Common Occupations - Education, training, and library occupations (%)
Most Common Occupations - Arts, design, entertainment, sports, and media occupations (%)
Most Common Occupations - Healthcare practitioners and technical occupations (%)
Most Common Occupations - Health diagnosing and treating practitioners and other technical occupations (%)
Most Common Occupations - Health technologists and technicians (%)
Most Common Occupations - Service occupations (%)
Most Common Occupations - Healthcare support occupations (%)
Most Common Occupations - Protective service occupations (%)
Most Common Occupations - Fire fighting and prevention, and other protective service workers including supervisors (%)
Most Common Occupations - Law enforcement workers including supervisors (%)
Most Common Occupations - Food preparation and serving related occupations (%)
Most Common Occupations - Building and grounds cleaning and maintenance occupations (%)
Most Common Occupations - Personal care and service occupations (%)
Most Common Occupations - Sales and office occupations (%)
Most Common Occupations - Sales and related occupations (%)
Most Common Occupations - Office and administrative support occupations (%)
Most Common Occupations - Natural resources, construction, and maintenance occupations (%)
Most Common Occupations - Farming, fishing, and forestry occupations (%)
Most Common Occupations - Construction and extraction occupations (%)
Most Common Occupations - Installation, maintenance, and repair occupations (%)
Most Common Occupations - Production, transportation, and material moving occupations (%)
Most Common Occupations - Production occupations (%)
Most Common Occupations - Transportation occupations (%)
Most Common Occupations - Material moving occupations (%)
People in Group quarters - Institutionalized population (%)
People in Group quarters - Correctional institutions (%)
People in Group quarters - Federal prisons and detention centers (%)
People in Group quarters - Halfway houses (%)
People in Group quarters - Local jails and other confinement facilities (including police lockups) (%)
People in Group quarters - Military disciplinary barracks (%)
People in Group quarters - State prisons (%)
People in Group quarters - Other types of correctional institutions (%)
People in Group quarters - Nursing homes (%)
People in Group quarters - Hospitals/wards, hospices, and schools for the handicapped (%)
People in Group quarters - Hospitals/wards and hospices for chronically ill (%)
People in Group quarters - Hospices or homes for chronically ill (%)
People in Group quarters - Military hospitals or wards for chronically ill (%)
People in Group quarters - Other hospitals or wards for chronically ill (%)
People in Group quarters - Hospitals or wards for drug/alcohol abuse (%)
People in Group quarters - Mental (Psychiatric) hospitals or wards (%)
People in Group quarters - Schools, hospitals, or wards for the mentally retarded (%)
People in Group quarters - Schools, hospitals, or wards for the physically handicapped (%)
People in Group quarters - Institutions for the deaf (%)
People in Group quarters - Institutions for the blind (%)
People in Group quarters - Orthopedic wards and institutions for the physically handicapped (%)
People in Group quarters - Wards in general hospitals for patients who have no usual home elsewhere (%)
People in Group quarters - Wards in military hospitals for patients who have no usual home elsewhere (%)
People in Group quarters - Juvenile institutions (%)
People in Group quarters - Long-term care (%)
People in Group quarters - Homes for abused, dependent, and neglected children (%)
People in Group quarters - Residential treatment centers for emotionally disturbed children (%)
People in Group quarters - Training schools for juvenile delinquents (%)
People in Group quarters - Short-term care, detention or diagnostic centers for delinquent children (%)
People in Group quarters - Type of juvenile institution unknown (%)
People in Group quarters - Noninstitutionalized population (%)
People in Group quarters - College dormitories (includes college quarters off campus) (%)
People in Group quarters - Military quarters (%)
People in Group quarters - On base (%)
People in Group quarters - Barracks, unaccompanied personnel housing (UPH), (Enlisted/Officer), ;and similar group living quarters for military personnel (%)
People in Group quarters - Transient quarters for temporary residents (%)
People in Group quarters - Military ships (%)
People in Group quarters - Group homes (%)
People in Group quarters - Homes or halfway houses for drug/alcohol abuse (%)
People in Group quarters - Homes for the mentally ill (%)
People in Group quarters - Homes for the mentally retarded (%)
People in Group quarters - Homes for the physically handicapped (%)
People in Group quarters - Other group homes (%)
People in Group quarters - Religious group quarters (%)
People in Group quarters - Dormitories (%)
People in Group quarters - Agriculture workers' dormitories on farms (%)
People in Group quarters - Job Corps and vocational training facilities (%)
People in Group quarters - Other workers' dormitories (%)
People in Group quarters - Crews of maritime vessels (%)
People in Group quarters - Other nonhousehold living situations (%)
People in Group quarters - Other noninstitutional group quarters (%)
Residents speaking English at home (%)
Residents speaking English at home - Born in the United States (%)
Residents speaking English at home - Native, born elsewhere (%)
Residents speaking English at home - Foreign born (%)
Residents speaking Spanish at home (%)
Residents speaking Spanish at home - Born in the United States (%)
Residents speaking Spanish at home - Native, born elsewhere (%)
Residents speaking Spanish at home - Foreign born (%)
Residents speaking other language at home (%)
Residents speaking other language at home - Born in the United States (%)
Residents speaking other language at home - Native, born elsewhere (%)
Residents speaking other language at home - Foreign born (%)
Class of Workers - Employee of private company (%)
Class of Workers - Self-employed in own incorporated business (%)
Class of Workers - Private not-for-profit wage and salary workers (%)
Class of Workers - Local government workers (%)
Class of Workers - State government workers (%)
Class of Workers - Federal government workers (%)
Class of Workers - Self-employed workers in own not incorporated business and Unpaid family workers (%)
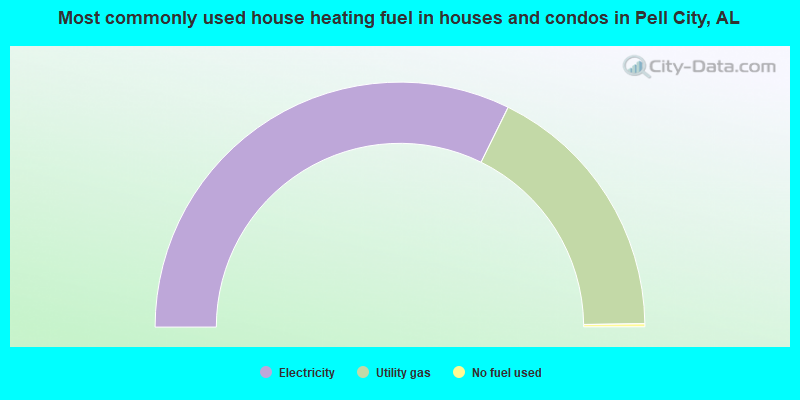
House heating fuel used in houses and condos - Utility gas (%)
House heating fuel used in houses and condos - Bottled, tank, or LP gas (%)
House heating fuel used in houses and condos - Electricity (%)
House heating fuel used in houses and condos - Fuel oil, kerosene, etc. (%)
House heating fuel used in houses and condos - Coal or coke (%)
House heating fuel used in houses and condos - Wood (%)
House heating fuel used in houses and condos - Solar energy (%)
House heating fuel used in houses and condos - Other fuel (%)
House heating fuel used in houses and condos - No fuel used (%)
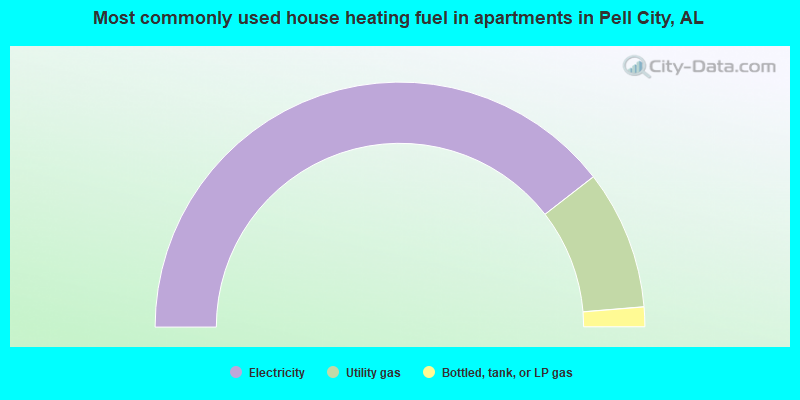
House heating fuel used in apartments - Utility gas (%)
House heating fuel used in apartments - Bottled, tank, or LP gas (%)
House heating fuel used in apartments - Electricity (%)
House heating fuel used in apartments - Fuel oil, kerosene, etc. (%)
House heating fuel used in apartments - Coal or coke (%)
House heating fuel used in apartments - Wood (%)
House heating fuel used in apartments - Solar energy (%)
House heating fuel used in apartments - Other fuel (%)
House heating fuel used in apartments - No fuel used (%)
Armed forces status - In Armed Forces (%)
Armed forces status - Civilian (%)
Armed forces status - Civilian - Veteran (%)
Armed forces status - Civilian - Nonveteran (%)
Fatal accidents locations in years 2005-2021
Fatal accidents locations in 2005
Fatal accidents locations in 2006
Fatal accidents locations in 2007
Fatal accidents locations in 2008
Fatal accidents locations in 2009
Fatal accidents locations in 2010
Fatal accidents locations in 2011
Fatal accidents locations in 2012
Fatal accidents locations in 2013
Fatal accidents locations in 2014
Fatal accidents locations in 2015
Fatal accidents locations in 2016
Fatal accidents locations in 2017
Fatal accidents locations in 2018
Fatal accidents locations in 2019
Fatal accidents locations in 2020
Fatal accidents locations in 2021
Alcohol use - People drinking some alcohol every month (%)
Alcohol use - People not drinking at all (%)
Alcohol use - Average days/month drinking alcohol
Alcohol use - Average drinks/week
Alcohol use - Average days/year people drink much
Audiometry - Average condition of hearing (%)
Audiometry - People that can hear a whisper from across a quiet room (%)
Audiometry - People that can hear normal voice from across a quiet room (%)
Audiometry - Ears ringing, roaring, buzzing (%)
Audiometry - Had a job exposure to loud noise (%)
Audiometry - Had off-work exposure to loud noise (%)
Blood Pressure & Cholesterol - Has high blood pressure (%)
Blood Pressure & Cholesterol - Checking blood pressure at home (%)
Blood Pressure & Cholesterol - Frequently checking blood cholesterol (%)
Blood Pressure & Cholesterol - Has high cholesterol level (%)
Consumer Behavior - Money monthly spent on food at supermarket/grocery store
Consumer Behavior - Money monthly spent on food at other stores
Consumer Behavior - Money monthly spent on eating out
Consumer Behavior - Money monthly spent on carryout/delivered foods
Consumer Behavior - Income spent on food at supermarket/grocery store (%)
Consumer Behavior - Income spent on food at other stores (%)
Consumer Behavior - Income spent on eating out (%)
Consumer Behavior - Income spent on carryout/delivered foods (%)
Current Health Status - General health condition (%)
Current Health Status - Blood donors (%)
Current Health Status - Has blood ever tested for HIV virus (%)
Current Health Status - Left-handed people (%)
Dermatology - People using sunscreen (%)
Diabetes - Diabetics (%)
Diabetes - Had a blood test for high blood sugar (%)
Diabetes - People taking insulin (%)
Diet Behavior & Nutrition - Diet health (%)
Diet Behavior & Nutrition - Milk product consumption (# of products/month)
Diet Behavior & Nutrition - Meals not home prepared (#/week)
Diet Behavior & Nutrition - Meals from fast food or pizza place (#/week)
Diet Behavior & Nutrition - Ready-to-eat foods (#/month)
Diet Behavior & Nutrition - Frozen meals/pizza (#/month)
Drug Use - People that ever used marijuana or hashish (%)
Drug Use - Ever used hard drugs (%)
Drug Use - Ever used any form of cocaine (%)
Drug Use - Ever used heroin (%)
Drug Use - Ever used methamphetamine (%)
Health Insurance - People covered by health insurance (%)
Kidney Conditions-Urology - Avg. # of times urinating at night
Medical Conditions - People with asthma (%)
Medical Conditions - People with anemia (%)
Medical Conditions - People with psoriasis (%)
Medical Conditions - People with overweight (%)
Medical Conditions - Elderly people having difficulties in thinking or remembering (%)
Medical Conditions - People who ever received blood transfusion (%)
Medical Conditions - People having trouble seeing even with glass/contacts (%)
Medical Conditions - People with arthritis (%)
Medical Conditions - People with gout (%)
Medical Conditions - People with congestive heart failure (%)
Medical Conditions - People with coronary heart disease (%)
Medical Conditions - People with angina pectoris (%)
Medical Conditions - People who ever had heart attack (%)
Medical Conditions - People who ever had stroke (%)
Medical Conditions - People with emphysema (%)
Medical Conditions - People with thyroid problem (%)
Medical Conditions - People with chronic bronchitis (%)
Medical Conditions - People with any liver condition (%)
Medical Conditions - People who ever had cancer or malignancy (%)
Mental Health - People who have little interest in doing things (%)
Mental Health - People feeling down, depressed, or hopeless (%)
Mental Health - People who have trouble sleeping or sleeping too much (%)
Mental Health - People feeling tired or having little energy (%)
Mental Health - People with poor appetite or overeating (%)
Mental Health - People feeling bad about themself (%)
Mental Health - People who have trouble concentrating on things (%)
Mental Health - People moving or speaking slowly or too fast (%)
Mental Health - People having thoughts they would be better off dead (%)
Oral Health - Average years since last visit a dentist
Oral Health - People embarrassed because of mouth (%)
Oral Health - People with gum disease (%)
Oral Health - General health of teeth and gums (%)
Oral Health - Average days a week using dental floss/device
Oral Health - Average days a week using mouthwash for dental problem
Oral Health - Average number of teeth
Pesticide Use - Households using pesticides to control insects (%)
Pesticide Use - Households using pesticides to kill weeds (%)
Physical Activity - People doing vigorous-intensity work activities (%)
Physical Activity - People doing moderate-intensity work activities (%)
Physical Activity - People walking or bicycling (%)
Physical Activity - People doing vigorous-intensity recreational activities (%)
Physical Activity - People doing moderate-intensity recreational activities (%)
Physical Activity - Average hours a day doing sedentary activities
Physical Activity - Average hours a day watching TV or videos
Physical Activity - Average hours a day using computer
Physical Functioning - People having limitations keeping them from working (%)
Physical Functioning - People limited in amount of work they can do (%)
Physical Functioning - People that need special equipment to walk (%)
Physical Functioning - People experiencing confusion/memory problems (%)
Physical Functioning - People requiring special healthcare equipment (%)
Prescription Medications - Average number of prescription medicines taking
Preventive Aspirin Use - Adults 40+ taking low-dose aspirin (%)
Reproductive Health - Vaginal deliveries (%)
Reproductive Health - Cesarean deliveries (%)
Reproductive Health - Deliveries resulted in a live birth (%)
Reproductive Health - Pregnancies resulted in a delivery (%)
Reproductive Health - Women breastfeeding newborns (%)
Reproductive Health - Women that had a hysterectomy (%)
Reproductive Health - Women that had both ovaries removed (%)
Reproductive Health - Women that have ever taken birth control pills (%)
Reproductive Health - Women taking birth control pills (%)
Reproductive Health - Women that have ever used Depo-Provera or injectables (%)
Reproductive Health - Women that have ever used female hormones (%)
Sexual Behavior - People 18+ that ever had sex (vaginal, anal, or oral) (%)
Sexual Behavior - Males 18+ that ever had vaginal sex with a woman (%)
Sexual Behavior - Males 18+ that ever performed oral sex on a woman (%)
Sexual Behavior - Males 18+ that ever had anal sex with a woman (%)
Sexual Behavior - Males 18+ that ever had any sex with a man (%)
Sexual Behavior - Females 18+ that ever had vaginal sex with a man (%)
Sexual Behavior - Females 18+ that ever performed oral sex on a man (%)
Sexual Behavior - Females 18+ that ever had anal sex with a man (%)
Sexual Behavior - Females 18+ that ever had any kind of sex with a woman (%)
Sexual Behavior - Average age people first had sex
Sexual Behavior - Average number of female sex partners in lifetime (males 18+)
Sexual Behavior - Average number of female vaginal sex partners in lifetime (males 18+)
Sexual Behavior - Average age people first performed oral sex on a woman (18+)
Sexual Behavior - Average number of woman performed oral sex on in lifetime (18+)
Sexual Behavior - Average number of male sex partners in lifetime (males 18+)
Sexual Behavior - Average number of male anal sex partners in lifetime (males 18+)
Sexual Behavior - Average age people first performed oral sex on a man (18+)
Sexual Behavior - Average number of male oral sex partners in lifetime (18+)
Sexual Behavior - People using protection when performing oral sex (%)
Sexual Behavior - Average number of times people have vaginal or anal sex a year
Sexual Behavior - People having sex without condom (%)
Sexual Behavior - Average number of male sex partners in lifetime (females 18+)
Sexual Behavior - Average number of male vaginal sex partners in lifetime (females 18+)
Sexual Behavior - Average number of female sex partners in lifetime (females 18+)
Sexual Behavior - Circumcised males 18+ (%)
Sleep Disorders - Average hours sleeping at night
Sleep Disorders - People that has trouble sleeping (%)
Smoking-Cigarette Use - People smoking cigarettes (%)
Taste & Smell - People 40+ having problems with smell (%)
Taste & Smell - People 40+ having problems with taste (%)
Taste & Smell - People 40+ that ever had wisdom teeth removed (%)
Taste & Smell - People 40+ that ever had tonsils teeth removed (%)
Taste & Smell - People 40+ that ever had a loss of consciousness because of a head injury (%)
Taste & Smell - People 40+ that ever had a broken nose or other serious injury to face or skull (%)
Taste & Smell - People 40+ that ever had two or more sinus infections (%)
Weight - Average height (inches)
Weight - Average weight (pounds)
Weight - Average BMI
Weight - People that are obese (%)
Weight - People that ever were obese (%)
Weight - People trying to lose weight (%)
10,172 76.7% White alone 2,132 16.1% Black alone 367 2.8% Two or more races 235 1.8% Asian alone 205 1.5% Hispanic 152 1.1% Other race alone 13 0.10% American Indian alone
Officers per 1,000 residents here:
2.56Alabama average:
2.40
Latest news from Pell City, AL collected exclusively by city-data.com from local newspapers, TV, and radio stations
Ancestries: American (18.9%), English (14.2%), Irish (7.0%), European (7.0%), Italian (2.9%), German (1.8%).
Current Local Time:
Incorporated on 05/06/1891
Land area: 24.6 square miles.
Population density: 555 people per square mile (low).
315 residents are foreign born (1.2% Asia , 0.5% Europe , 0.5% Latin America ).
This city:
2.3%Alabama:
3.5%
Median real estate property taxes paid for housing units with mortgages in 2022: $870 (0.4%)Median real estate property taxes paid for housing units with no mortgage in 2022: $787 (0.3%)
Nearest city with pop. 50,000+: Birmingham, AL
Nearest city with pop. 1,000,000+: Chicago, IL
Nearest cities:
Latitude: 33.57 N, Longitude: 86.27 W
Daytime population change due to commuting: +2,449 (+18.2%)Workers who live and work in this city: 3,674 (54.7%)
Single-family new house construction building permits:
2022: 144 buildings , average cost: $272,4002021: 194 buildings , average cost: $174,6002020: 144 buildings , average cost: $137,7002019: 97 buildings , average cost: $182,6002018: 80 buildings , average cost: $167,1002017: 47 buildings , average cost: $204,0002016: 32 buildings , average cost: $194,4002015: 30 buildings , average cost: $204,1002014: 26 buildings , average cost: $196,9002013: 46 buildings , average cost: $188,4002012: 27 buildings , average cost: $137,3002011: 93 buildings , average cost: $126,6002010: 42 buildings , average cost: $126,3002009: 20 buildings , average cost: $174,9002008: 47 buildings , average cost: $159,0002007: 85 buildings , average cost: $159,3002006: 154 buildings , average cost: $144,4002005: 168 buildings , average cost: $128,4002004: 74 buildings , average cost: $124,9002003: 81 buildings , average cost: $135,0002002: 57 buildings , average cost: $131,5002001: 59 buildings , average cost: $122,0002000: 73 buildings , average cost: $103,3001999: 52 buildings , average cost: $96,3001998: 55 buildings , average cost: $91,4001997: 72 buildings , average cost: $108,900Unemployment in December 2023:
Population change in the 1990s: +1,051 (+12.3%).
Most common occupations in Pell City, AL (%)
Both Males Females
Other production occupations, including supervisors (5.4%)
Other management occupations, except farmers and farm managers (4.9%)
Secretaries and administrative assistants (4.7%)
Driver/sales workers and truck drivers (4.6%)
Other sales and related occupations, including supervisors (4.5%)
Other office and administrative support workers, including supervisors (3.9%)
Sales representatives, services, wholesale and manufacturing (3.3%)
Driver/sales workers and truck drivers (7.2%)
Sales representatives, services, wholesale and manufacturing (5.9%)
Other production occupations, including supervisors (5.9%)
Other management occupations, except farmers and farm managers (5.8%)
Other sales and related occupations, including supervisors (5.3%)
Electrical equipment mechanics and other installation, maintenance, and repair workers, including supervisors (4.7%)
Operations specialties managers, except financial managers (3.4%)
Secretaries and administrative assistants (10.1%)
Preschool, kindergarten, elementary, and middle school teachers (6.7%)
Other office and administrative support workers, including supervisors (5.6%)
Registered nurses (5.0%)
Other production occupations, including supervisors (4.8%)
Cashiers (4.7%)
Other management occupations, except farmers and farm managers (3.9%)
Tornado activity:
Pell City-area historical tornado activity is slightly above Alabama state average. It is 143% greater than the overall U.S. average.
On 4/4/1977, a category F5 (max. wind speeds 261-318 mph) tornado 24.6 miles away from the Pell City city center killed 22 people and injured 130 people and caused between $5,000,000 and $50,000,000 in damages.
On 3/27/1994, a category F4 (max. wind speeds 207-260 mph) tornado 12.5 miles away from the city center killed 22 people and injured 150 people and caused between $5,000,000 and $50,000,000 in damages.
Earthquake activity:
Pell City-area historical earthquake activity is significantly above Alabama state average. It is 111% greater than the overall U.S. average. On 4/29/2003 at 08:59:39, a magnitude 4.9 (4.4 MB, 4.6 MW, 4.9 LG, Class: Light, Intensity: IV - V) earthquake occurred 73.8 miles away from the city center On 1/18/1999 at 07:00:53, a magnitude 4.8 (4.8 MB, 4.0 LG, Depth: 0.6 mi) earthquake occurred 57.7 miles away from Pell City center On 4/29/2003 at 08:59:39, a magnitude 4.6 (4.6 MW, Depth: 12.3 mi) earthquake occurred 73.7 miles away from Pell City center On 6/24/1975 at 11:11:36, a magnitude 4.5 (4.5 MB) earthquake occurred 90.8 miles away from Pell City center On 10/24/1997 at 08:35:17, a magnitude 4.9 (4.8 MB, 4.2 MS, 4.9 LG, Depth: 6.2 mi) earthquake occurred 179.1 miles away from the city center On 8/2/1974 at 08:52:09, a magnitude 4.9 (4.3 MB, 4.9 LG) earthquake occurred 218.8 miles away from Pell City center Magnitude types: regional Lg-wave magnitude (LG), body-wave magnitude (MB), surface-wave magnitude (MS), moment magnitude (MW) Natural disasters: The number of natural disasters in St. Clair County (3) is a lot smaller than the US average (15).Major Disasters (Presidential) Declared: 1Storms: 2, Tornadoes: 2, Flood: 1, Wind: 1, Other: 1 (Note: some incidents may be assigned to more than one category). Hospitals and medical centers in Pell City: LAKESIDE HOSPICE INC (4010 MASTERS ROAD) ST VINCENT'S ST CLAIR (Voluntary non-profit - Private, 7063 VETERANS PARKWAY) GOLDEN LIVING CENTER - PELL CITY (510 WOLF CREEK ROAD, NORTH)
MEADOWVIEW NURSING CENTER (7300 OLD HIGHWAY 78 EAST)
DCI PELL CITY (62 COGSWELL DRIVE)
RCG PELL CITY (2804 DR. JOHN HAYNES DRIVE)
CARE FIRST HOME HEALTH OF ST CLAIR COUNTY (2401 STEMLEY BRIDGE ROAD, SUITE 7)
MID SOUTH HOME HEALTH AGENCY INC (3319 DR JOHN HAYNES DRIVE SUITE 4)
Colleges/universities with over 2000 students nearest to Pell City:
Jefferson State Community College (about 26 miles; Birmingham, AL ; Full-time enrollment: 6,041)
Samford University (about 31 miles; Birmingham, AL ; FT enrollment: 3,829)
University of Alabama at Birmingham (about 32 miles; Birmingham, AL ; FT enrollment: 14,853)
Virginia College-Birmingham (about 33 miles; Birmingham, AL ; FT enrollment: 8,167)
Gadsden State Community College (about 34 miles; Gadsden, AL ; FT enrollment: 4,650)
Jacksonville State University (about 34 miles; Jacksonville, AL ; FT enrollment: 7,566)
Lawson State Community College-Birmingham Campus (about 37 miles; Birmingham, AL ; FT enrollment: 2,695)
Public high schools in Pell City: PELL CITY HIGH SCH Students: 1,209, Location: 1300 COGSWELL AVE, Grades: 9-12)RISE ACADEMY Location: 1300 COGSWELL AVENUE, Grades: PK-12)
Private high schools in Pell City: VICTORY CHRISTIAN SCHOOL Students: 437, Location: 154 VICTORY DR, Grades: PK-12)
BIBLE METHODIST CHRISTIAN SCHOOL Students: 66, Location: 1355 CHULA VISTA DR, Grades: PK-12)
Public elementary/middle schools in Pell City: DURAN JR HIGH SCH Students: 642, Location: 309 WILLIAMSON DR, Grades: 8)WALTER M KENNEDY SCH Students: 607, Location: 250 OTIS PERRY DR, Grades: KG-4)EDEN ELEM SCH Students: 562, Location: 412 WOLF CREEK RD N, Grades: PK-4)IOLA ROBERTS ELEM SCH Students: 346, Location: 810 MARTIN ST N, Grades: KG-4)DURAN SOUTH Students: 321, Location: 813 16TH ST S, Grades: 7)WILLIAMS INTERMEDIATE SCHOOL Location: 2000 HARDWICK ROAD, Grades: 5-6)
Private elementary/middle school in Pell City: MOUNTAIN VIEW ADVENTIST SCHOOL Students: 5, Location: 925 ACADEMY CIR, Grades: 3-8)
See full list of schools located in Pell City Library in Pell City: PELL CITY PUBLIC LIBRARY Operating income: $319,413; Location: 1923 1ST AVENUE NORTH; 30,807 books ; 1,309 audio materials ; 886 video materials ; 1 local licensed databases ; 81 state licensed databases )
User-submitted facts and corrections:
the zip code 35054 should be included in the Pell City zip codes.
Notable locations in Pell City: (A) , Knoxs Landing (B) , Cogswell Avenue Industrial Park (C) , Comer Avenue Industrial Park (D) , Pell City City Hall (E) , Pell City Civic Center (F) , Pell City Fire and Rescue Station 1 (G) , Pell City Fire and Rescue Station 2 (H) , Pell City Fire and Rescue Station 4 (I) , Pell City Fire and Rescue Station 3 (J) . Display/hide their locations on the map
Shopping Center: (1) . Display/hide its location on the map
Churches in Pell City include: (A) , Rocky Zion Missionary Baptist Church (B) , Arbor Baptist Church (C) , Bible Methodist Church (D) , Bible Missionary Church (E) , Church of God of Prophecy (F) , Church of God in Christ (G) , Coosa Valley Baptist Church (H) , Cropwell Baptist Church (I) . Display/hide their locations on the map
Cemeteries: (1) , Seddon Cemetery (2) , Valley Hill Cemetery (3) , Robert Chapel Cemetery (4) , Oak Ridge Cemetery (5) . Display/hide their locations on the map
Lakes and reservoirs: (A) , Lake Lewis (B) . Display/hide their locations on the map
Streams, rivers, and creeks: (A) , Cropwell Branch (B) , Dunlap Spring Branch (C) , Easonville Creek (D) , Fannin Branch (E) . Display/hide their locations on the map
Hotels: (1) , Big Bull Motel (Highway 231 South) (2) . Display/hide their approximate locations on the map
Courts: (1) , Court Refferal (1815 Cogswell Suite 217) (2) . Display/hide their approximate locations on the map
Birthplace of: Jeanne Pruett - Country musician, David Gulledge - Football player.
St. Clair County has a predicted average indoor radon screening level between 2 and 4 pCi/L (pico curies per liter) - Moderate Potential Drinking water stations with addresses in Pell City and their reported violations in the past:
PELL CITY WATER WORKS (Address: 1905 1st AVE NORTH Population served: 15,150, Purch surface water):
Past monitoring violations:
14 regular monitoring violations
Address: 120 L Cooke Drive Population served: 4,171, Groundwater):
Past monitoring violations:
One routine major monitoring violation
Average household size: This city:
2.4 peopleAlabama:
2.5 people
Percentage of family households: This city:
68.8%Whole state:
67.8%
Percentage of households with unmarried partners: This city:
5.1%Whole state:
4.7%
Likely homosexual households (counted as self-reported same-sex unmarried-partner households)
Lesbian couples: 0.4% of all households Gay men: 0.2% of all households
People in group quarters in Pell City in 2010:
126 people in local jails and other municipal confinement facilities
90 people in nursing facilities/skilled-nursing facilities
15 people in group homes intended for adults
people in nursing homes in 2000people in homes for the mentally ill in 2000Banks with branches in Pell City (2011 data):
Union State Bank: Plaza Branch, at 1st Avenue And 20th Street North, Cropwell Branch, Drive-In Teller Facility. Info updated 2011/02/24: Bank assets: $274.5 mil, Deposits: $250.5 mil, local headquarters , negative income in the last year , Commercial Lending Specialization, 15 total offices , Holding Company: Union Bancshares, Inc.
Metro Bank: at 800 Martin Street South, Martin Street Branch, Pell City Remote Branch. Info updated 2011/02/24: Bank assets: $627.7 mil, Deposits: $557.5 mil, local headquarters , positive income , Commercial Lending Specialization, 9 total offices
USAmeriBank: Pell City Branch at 2401 Stemley Bridge Road Suite 13a, branch established on 2007/12/18. Info updated 2012/01/04: Bank assets: $2,120.8 mil, Deposits: $1,722.4 mil, headquarters in Largo, FL, positive income , Commercial Lending Specialization, 23 total offices , Holding Company: Usameribancorp, Inc.
PNC Bank, National Association: 308 Martin Street Branch at 308 Martin Street, branch established on 1956/01/01. Info updated 2012/03/20: Bank assets: $263,309.6 mil, Deposits: $197,343.0 mil, headquarters in Wilmington, DE, positive income , Commercial Lending Specialization, 3085 total offices , Holding Company: Pnc Financial Services Group, Inc., The
Branch Banking and Trust Company: Pell City Branch at 2203 1st Ave N, branch established on 1973/10/11. Info updated 2010/03/29: Bank assets: $168,867.6 mil, Deposits: $127,549.5 mil, headquarters in Winston Salem, NC, positive income , Commercial Lending Specialization, 1793 total offices , Holding Company: Bb&T Corporation
Regions Bank: Pell City Branch at 1031 Martin Street South, branch established on 1994/01/18. Info updated 2011/02/24: Bank assets: $123,368.2 mil, Deposits: $98,301.3 mil, headquarters in Birmingham, AL, positive income , Commercial Lending Specialization, 1778 total offices , Holding Company: Regions Financial Corporation
For population 15 years and over in Pell City:
Never married: 22.7%Now married: 52.1%Separated: 1.5%Widowed: 6.2%Divorced: 17.4% For population 25 years and over in Pell City:
High school or higher: 88.9%Bachelor's degree or higher: 20.7%Graduate or professional degree: 5.2%Unemployed: 5.1%Mean travel time to work (commute): 25.2 minutes
Education Gini index (Inequality in education) Here:
8.7Alabama average:
11.5
Religion statistics for Pell City, AL (based on St. Clair County data)
Religion Adherents Congregations Evangelical Protestant 34,066 121 Mainline Protestant 2,856 18 Black Protestant 1,778 12 Catholic 1,056 1 Other 12 2 None 43,825 -
Source: Clifford Grammich, Kirk Hadaway, Richard Houseal, Dale E.Jones, Alexei Krindatch, Richie Stanley and Richard H.Taylor. 2012. 2010 U.S.Religion Census: Religious Congregations & Membership Study. Association of Statisticians of American Religious Bodies. Jones, Dale E., et al. 2002. Congregations and Membership in the United States 2000. Nashville, TN: Glenmary Research Center. Graphs represent county-level data
Food Environment Statistics: Number of grocery stores : 14St. Clair County :
1.79 / 10,000 pop.Alabama :
1.89 / 10,000 pop.
Number of supercenters and club stores : 1St. Clair County :
0.13 / 10,000 pop.Alabama :
0.20 / 10,000 pop.
Number of convenience stores (no gas) : 2This county :
0.26 / 10,000 pop.Alabama :
0.65 / 10,000 pop.
Number of convenience stores (with gas) : 44St. Clair County :
5.64 / 10,000 pop.Alabama :
6.32 / 10,000 pop.
Number of full-service restaurants : 45St. Clair County :
5.77 / 10,000 pop.Alabama :
5.75 / 10,000 pop.
Adult diabetes rate : St. Clair County :
10.7%Alabama :
11.8%
Adult obesity rate : St. Clair County :
33.9%Alabama :
31.7%
Low-income preschool obesity rate : This county :
9.2%Alabama :
13.5%
Health and Nutrition:
Average overall health of teeth and gums : Pell City:
45.4%Alabama:
45.7%
People feeling badly about themselves : Pell City:
22.0%State:
20.7%
People not drinking alcohol at all : Pell City:
7.9%State:
11.0%
Average hours sleeping at night : Overweight people : Pell City:
33.4%Alabama:
34.4%
General health condition : Average condition of hearing : This city:
77.5%Alabama:
79.3%
More about Health and Nutrition of Pell City, AL Residents
Local government employment and payroll (March 2022)
Function
Full-time employees
Monthly full-time payroll
Average yearly full-time wage
Part-time employees
Monthly part-time payroll
Firefighters
36 $181,947 $60,649 12 $14,629 Police Protection - Officers
34 $192,411 $67,910 2 $3,734 Streets and Highways
18 $65,363 $43,575 0 $0 Parks and Recreation
15 $53,685 $42,948 10 $5,656 Sewerage
8 $44,277 $66,416 0 $0 Water Supply
7 $27,945 $47,906 0 $0 Financial Administration
6 $24,170 $48,340 0 $0 Other Government Administration
6 $16,786 $33,572 6 $5,747 Local Libraries
5 $18,726 $44,942 2 $1,584 Health
4 $11,889 $35,667 4 $4,195 Judicial and Legal
3 $13,787 $55,148 0 $0 Welfare
2 $6,653 $39,918 0 $0 Police - Other
2 $5,887 $35,322 4 $1,731
Totals for Government
146 $663,526 $54,536 40 $37,276
Pell City government finances - Expenditure in 2021 (per resident):
Construction - General - Other: $3,305,000 ($242.34)
Water Utilities: $2,138,000 ($156.77)Regular Highways: $1,527,000 ($111.97)Sewerage: $867,000 ($63.57)Current Operations - Local Fire Protection: $3,755,000 ($275.33)
Police Protection: $3,601,000 ($264.04)Water Utilities: $3,323,000 ($243.66)Central Staff Services: $2,191,000 ($160.65)Regular Highways: $2,115,000 ($155.08)Parks and Recreation: $1,871,000 ($137.19)Sewerage: $1,066,000 ($78.16)Judicial and Legal Services: $545,000 ($39.96)Libraries: $465,000 ($34.10)Financial Administration: $270,000 ($19.80)Health - Other: $248,000 ($18.18)General - Other: $162,000 ($11.88)General - Interest on Debt: $938,000 ($68.78)
Other Capital Outlay - General - Other: $496,000 ($36.37)
Police Protection: $235,000 ($17.23)Central Staff Services: $84,000 ($6.16)Health - Other: $22,000 ($1.61)Local Fire Protection: $11,000 ($0.81)Regular Highways: $9,000 ($0.66)Water Utilities - Interest on Debt: $1,266,000 ($92.83)
Pell City government finances - Revenue in 2021 (per resident):
Charges - Sewerage: $1,593,000 ($116.81)
Parks and Recreation: $406,000 ($29.77)Other: $37,000 ($2.71)Miscellaneous - Fines and Forfeits: $481,000 ($35.27)
General Revenue - Other: $179,000 ($13.13)Rents: $137,000 ($10.05)Interest Earnings: $29,000 ($2.13)Sale of Property: $28,000 ($2.05)Donations From Private Sources: $28,000 ($2.05)Revenue - Water Utilities: $4,846,000 ($355.33)
State Intergovernmental - Other: $2,418,000 ($177.30)
General Local Government Support: $411,000 ($30.14)Health and Hospitals: $273,000 ($20.02)Highways: $239,000 ($17.52)Tax - General Sales and Gross Receipts: $20,194,000 ($1480.72)
Property: $1,011,000 ($74.13)Other Selective Sales: $664,000 ($48.69)Motor Fuels Sales: $209,000 ($15.32)Public Utilities Sales: $194,000 ($14.22)Alcoholic Beverage Sales: $162,000 ($11.88)Other License: $159,000 ($11.66)Occupation and Business License - Other: $28,000 ($2.05)
Pell City government finances - Debt in 2021 (per resident):
Long Term Debt - Beginning Outstanding - Unspecified Public Purpose: $59,590,000 ($4369.41)
Outstanding Unspecified Public Purpose: $57,793,000 ($4237.64)Retired Unspecified Public Purpose: $1,797,000 ($131.76)
Pell City government finances - Cash and Securities in 2021 (per resident):
Bond Funds - Cash and Securities: $809,000 ($59.32)
Other Funds - Cash and Securities: $14,807,000 ($1085.72)
Sinking Funds - Cash and Securities: $1,059,000 ($77.65)
Businesses in Pell City, AL
Name Count Name Count
AT&T 1 Kmart 1 Advance Auto Parts 1 Lane Furniture 1 Arby's 1 Little Caesars Pizza 1 AutoZone 1 McDonald's 1 Blockbuster 1 Papa John's Pizza 1 Burger King 1 Penske 1 CVS 1 Pizza Hut 1 Comfort Suites 1 Quality 1 Cracker Barrel 1 RadioShack 1 Curves 1 SONIC Drive-In 1 Domino's Pizza 1 Sears 1 FedEx 2 Subway 2 Ford 1 T-Mobile 1 GameStop 1 Taco Bell 1 H&R Block 2 U-Haul 3 Hardee's 1 UPS 3 Hilton 1 Waffle House 1 Holiday Inn 1 Walgreens 1 Home Depot 1 Walmart 1 KFC 1
Strongest AM radio stations in Pell City:
WFHK (1430 AM; 5 kW; PELL CITY, AL; Owner: STOCKS BROADCASTING, INC.)
WDJC (850 AM; 50 kW; BIRMINGHAM, AL; Owner: KIMTRON, INC.)
WNSI (810 AM; 50 kW; JACKSONVILLE, AL; Owner: UNITED BROADCASTING NETWORK, INC.)
WJOX (690 AM; 50 kW; BIRMINGHAM, AL; Owner: CITADEL BROADCASTING COMPANY)
WAPI (1070 AM; 50 kW; BIRMINGHAM, AL; Owner: CITADEL BROADCASTING COMPANY)
WKNG (1060 AM; daytime; 50 kW; TALLAPOOSA, GA; Owner: WKNG, INC.)
WURL (760 AM; daytime; 1 kW; MOODY, AL; Owner: THE BILL DAVISON EVANGELISTIC ASSOC)
WAAX (570 AM; 5 kW; GADSDEN, AL; Owner: CAPSTAR TX LIMITED PARTNERSHIP)
WVOK (1580 AM; 2 kW; OXFORD, AL; Owner: WOODARD B/CING. CO., INC.)
WLPH (1480 AM; daytime; 5 kW; IRONDALE, AL; Owner: BIRMINGHAM CHRISTIAN RADIO, INC.)
WGST (640 AM; 50 kW; ATLANTA, GA; Owner: CITICASTERS LICENSES, L.P.)
WHMA (1390 AM; 5 kW; ANNISTON, AL; Owner: CASEY NETWORK, LLC)
WZZX (780 AM; daytime; 5 kW; LINEVILLE, AL; Owner: ROBERT A. PERRY)
Strongest FM radio stations in Pell City:
WTDR (92.7 FM; TALLADEGA, AL; Owner: JACOBS BROADCAST GROUP, INC.)
WTBJ (91.3 FM; OXFORD, AL; Owner: TRINITY CHRISTIAN ACADEMY)
WRAX (107.7 FM; BIRMINGHAM, AL; Owner: CITADEL BROADCASTING COMPANY)
WVOK-FM (97.9 FM; OXFORD, AL; Owner: WOODARD BROADCASTING CO. INC.)
WGIB (91.9 FM; BIRMINGHAM, AL; Owner: GLEN IRIS BAPTIST SCHOOL)
WSSY-FM (97.5 FM; TALLADEGA, AL; Owner: GREAT SOUTH RFDC, LLC)
WBPT (106.9 FM; BIRMINGHAM, AL; Owner: CXR HOLDINGS, INC.)
WBHK (98.7 FM; WARRIOR, AL; Owner: CXR HOLDINGS, INC.)
WZZK-FM (104.7 FM; BIRMINGHAM, AL; Owner: CXR HOLDINGS, INC.)
WBHM (90.3 FM; BIRMINGHAM, AL; Owner: BD OF TRUSTEES/U OF AL AT BIRMINGHAM)
WODL (97.3 FM; HOMEWOOD, AL; Owner: CXR HOLDINGS, INC.)
WYSF (94.5 FM; BIRMINGHAM, AL; Owner: CITADEL BROADCASTING COMPANY)
WMJJ (96.5 FM; BIRMINGHAM, AL; Owner: CAPSTAR TX LIMITED PARTNERSHIP)
WENN (105.9 FM; TRUSSVILLE, AL; Owner: CAPSTAR TX LIMITED PARTNERSHIP)
WQEN (103.7 FM; GADSDEN, AL; Owner: CAPSTAR TX LIMITED PARTNERSHIP)
WLJS-FM (91.9 FM; JACKSONVILLE, AL; Owner: BD. OF TRUSTEES/JACKSONVILLE STATE UNIVERSITY)
WDJC-FM (93.7 FM; BIRMINGHAM, AL; Owner: KIMTRON, INC.)
WZRR (99.5 FM; BIRMINGHAM, AL; Owner: CITADEL BROADCASTING COMPANY)
WLJR (88.5 FM; BIRMINGHAM, AL; Owner: BRIARWOOD PRESBYTERIAN CHURCH)
WKXX (102.9 FM; ATTALLA, AL; Owner: BROADCAST MEDIA LLC)
TV broadcast stations around Pell City:
WJSU-TV (Channel 40; ANNISTON, AL; Owner: TV ALABAMA, INC.)
WTJP (Channel 60; GADSDEN, AL; Owner: TRINITY BROADCASTING NETWORK)
WPXH (Channel 44; GADSDEN, AL; Owner: PAXSON COMMUNICATIONS LICENSE COMPANY, LLC)
WIAT (Channel 42; BIRMINGHAM, AL; Owner: MEDIA GENERAL COMMUNICATIONS, INC.)
WBIQ (Channel 10; BIRMINGHAM, AL; Owner: ALABAMA EDUCATIONAL TELEVISION COMMISSION)
WBRC (Channel 6; BIRMINGHAM, AL; Owner: WBRC LICENSE, INC.)
WTTO (Channel 21; HOMEWOOD, AL; Owner: WTTO LICENSEE, LLC)
WVTM-TV (Channel 13; BIRMINGHAM, AL; Owner: BIRMINGHAM BROADCASTING (WVTM-TV), LLC)
WABM (Channel 68; BIRMINGHAM, AL; Owner: BIRMINGHAM (WABM-TV) LICENSEE, INC.)
WCIQ (Channel 7; MOUNT CHEAHA, AL; Owner: ALABAMA EDUCATIONAL TELEVISION COMMISSION)
W27CM (Channel 27; BIRMINGHAM, AL; Owner: EQUITY BROADCASTING CORPORATION)
W46DK (Channel 46; BIRMINGHAM, AL; Owner: TRINITY BROADCASTING NETWORK)
W63CK (Channel 63; TALLADEGA, AL; Owner: BOWLIN BROADCAST NETWORK, INC.)
WOIL-LP (Channel 47; TALLADEGA, AL; Owner: BOWLIN BROADCAST NETWORK, INC.)
WBMG-LP (Channel 38; MOODY, AL; Owner: TIGER EYE BROADCASTING CORPORATION)
W50BO (Channel 50; ASHVILLE, AL; Owner: BOWLIN AND JOHNSON)
National Bridge Inventory (NBI) Statistics 29 Number of bridges410ft / 125m Total length $54,394,000 Total costs498,462 Total average daily traffic123,759 Total average daily truck traffic
New bridges - historical statistics
1 1900-1909 4 1940-1949 2 1950-1959 10 1960-1969 1 1970-1979 5 1990-1999 6 2000-2009
See full National Bridge Inventory statistics for Pell City, AL
Home Mortgage Disclosure Act Aggregated Statistics For Year 2009(Based on 5 partial tracts) A) FHA, FSA/RHS & VA B) Conventional C) Refinancings D) Home Improvement Loans F) Non-occupant Loans on G) Loans On Manufactured Number Average Value Number Average Value Number Average Value Number Average Value Number Average Value Number Average Value
LOANS ORIGINATED 14 $131,557 28 $146,988 129 $148,054 15 $53,768 34 $132,536 17 $29,049 APPLICATIONS APPROVED, NOT ACCEPTED 0 $0 0 $0 8 $183,131 1 $8,550 0 $0 2 $87,345 APPLICATIONS DENIED 3 $105,780 10 $80,220 48 $172,837 5 $44,556 6 $106,395 8 $33,466 APPLICATIONS WITHDRAWN 6 $144,767 3 $203,467 42 $192,776 1 $60,510 3 $241,650 1 $121,480 FILES CLOSED FOR INCOMPLETENESS 0 $0 1 $193,890 4 $173,498 0 $0 1 $157,370 1 $31,000
Aggregated Statistics For Year 2008(Based on 5 partial tracts) A) FHA, FSA/RHS & VA B) Conventional C) Refinancings D) Home Improvement Loans F) Non-occupant Loans on G) Loans On Manufactured Number Average Value Number Average Value Number Average Value Number Average Value Number Average Value Number Average Value
LOANS ORIGINATED 10 $147,211 47 $147,080 85 $182,118 18 $36,552 20 $132,371 15 $31,336 APPLICATIONS APPROVED, NOT ACCEPTED 1 $95,380 6 $103,720 9 $195,393 2 $89,910 3 $128,297 3 $53,473 APPLICATIONS DENIED 5 $141,648 13 $77,628 43 $158,155 10 $57,725 2 $53,670 11 $54,742 APPLICATIONS WITHDRAWN 1 $117,810 4 $173,108 27 $186,816 2 $167,675 2 $206,165 1 $16,010 FILES CLOSED FOR INCOMPLETENESS 0 $0 1 $183,880 10 $225,284 1 $80,560 0 $0 0 $0
Aggregated Statistics For Year 2007(Based on 5 partial tracts) A) FHA, FSA/RHS & VA B) Conventional C) Refinancings D) Home Improvement Loans F) Non-occupant Loans on G) Loans On Manufactured Number Average Value Number Average Value Number Average Value Number Average Value Number Average Value Number Average Value
LOANS ORIGINATED 11 $129,054 86 $172,520 101 $160,831 24 $41,199 29 $203,301 18 $49,613 APPLICATIONS APPROVED, NOT ACCEPTED 1 $52,120 8 $122,201 13 $171,089 1 $27,020 1 $174,940 4 $58,445 APPLICATIONS DENIED 4 $114,770 21 $87,886 48 $128,718 13 $65,489 1 $112,050 15 $49,766 APPLICATIONS WITHDRAWN 1 $155,460 10 $115,356 27 $157,313 3 $66,920 2 $76,805 1 $25,930 FILES CLOSED FOR INCOMPLETENESS 1 $143,180 6 $151,417 11 $208,115 1 $109,530 1 $194,670 1 $41,640
Aggregated Statistics For Year 2006(Based on 5 partial tracts) A) FHA, FSA/RHS & VA B) Conventional C) Refinancings D) Home Improvement Loans F) Non-occupant Loans on G) Loans On Manufactured Number Average Value Number Average Value Number Average Value Number Average Value Number Average Value Number Average Value
LOANS ORIGINATED 8 $147,822 117 $143,709 83 $140,713 27 $35,043 25 $158,004 15 $48,835 APPLICATIONS APPROVED, NOT ACCEPTED 0 $0 16 $99,912 11 $128,614 4 $30,300 1 $296,820 8 $48,698 APPLICATIONS DENIED 2 $187,210 23 $103,011 44 $124,900 12 $27,445 3 $171,993 12 $44,935 APPLICATIONS WITHDRAWN 1 $181,730 13 $129,381 27 $122,016 2 $62,165 2 $183,300 1 $66,980 FILES CLOSED FOR INCOMPLETENESS 0 $0 4 $121,078 16 $155,670 0 $0 0 $0 0 $0
Aggregated Statistics For Year 2005(Based on 5 partial tracts) A) FHA, FSA/RHS & VA B) Conventional C) Refinancings D) Home Improvement Loans F) Non-occupant Loans on G) Loans On Manufactured Number Average Value Number Average Value Number Average Value Number Average Value Number Average Value Number Average Value
LOANS ORIGINATED 6 $138,360 113 $122,332 99 $134,099 26 $26,940 24 $128,120 18 $47,815 APPLICATIONS APPROVED, NOT ACCEPTED 0 $0 15 $98,840 17 $107,760 0 $0 2 $107,295 7 $56,323 APPLICATIONS DENIED 1 $88,740 25 $69,881 57 $120,505 17 $57,408 2 $136,610 21 $48,875 APPLICATIONS WITHDRAWN 0 $0 8 $115,834 44 $145,319 7 $164,090 2 $145,530 5 $74,754 FILES CLOSED FOR INCOMPLETENESS 0 $0 5 $119,222 9 $155,422 0 $0 1 $125,870 0 $0
Aggregated Statistics For Year 2004(Based on 5 partial tracts) A) FHA, FSA/RHS & VA B) Conventional C) Refinancings D) Home Improvement Loans F) Non-occupant Loans on G) Loans On Manufactured Number Average Value Number Average Value Number Average Value Number Average Value Number Average Value Number Average Value
LOANS ORIGINATED 7 $123,706 83 $124,208 96 $139,912 21 $31,802 21 $137,981 13 $47,776 APPLICATIONS APPROVED, NOT ACCEPTED 0 $0 10 $112,868 21 $109,934 3 $50,053 2 $79,570 6 $52,235 APPLICATIONS DENIED 1 $92,370 19 $89,573 56 $105,582 15 $50,936 3 $168,373 16 $50,909 APPLICATIONS WITHDRAWN 1 $61,630 9 $146,462 25 $148,755 4 $56,560 1 $160,730 2 $71,675 FILES CLOSED FOR INCOMPLETENESS 0 $0 2 $94,360 26 $140,025 2 $49,430 1 $245,120 1 $81,370
Aggregated Statistics For Year 2003(Based on 5 partial tracts) A) FHA, FSA/RHS & VA B) Conventional C) Refinancings D) Home Improvement Loans F) Non-occupant Loans on Number Average Value Number Average Value Number Average Value Number Average Value Number Average Value
LOANS ORIGINATED 5 $92,480 80 $106,769 181 $125,411 27 $16,750 15 $115,573 APPLICATIONS APPROVED, NOT ACCEPTED 0 $0 9 $96,732 27 $106,235 2 $53,815 1 $141,050 APPLICATIONS DENIED 1 $64,230 20 $61,974 66 $111,732 7 $36,816 2 $50,215 APPLICATIONS WITHDRAWN 0 $0 4 $110,432 37 $128,869 2 $49,540 1 $50,130 FILES CLOSED FOR INCOMPLETENESS 0 $0 3 $105,550 7 $133,349 0 $0 0 $0
Aggregated Statistics For Year 2002(Based on 5 partial tracts) A) FHA, FSA/RHS & VA B) Conventional C) Refinancings D) Home Improvement Loans F) Non-occupant Loans on Number Average Value Number Average Value Number Average Value Number Average Value Number Average Value
LOANS ORIGINATED 4 $110,155 58 $112,927 150 $131,093 28 $20,545 10 $126,668 APPLICATIONS APPROVED, NOT ACCEPTED 1 $87,100 8 $84,260 16 $103,717 0 $0 1 $140,140 APPLICATIONS DENIED 0 $0 26 $41,865 42 $112,225 5 $21,364 4 $95,828 APPLICATIONS WITHDRAWN 1 $80,090 4 $125,158 18 $107,260 0 $0 1 $64,330 FILES CLOSED FOR INCOMPLETENESS 0 $0 1 $125,620 13 $436,029 0 $0 0 $0
Aggregated Statistics For Year 2001(Based on 5 partial tracts) A) FHA, FSA/RHS & VA B) Conventional C) Refinancings D) Home Improvement Loans F) Non-occupant Loans on Number Average Value Number Average Value Number Average Value Number Average Value Number Average Value
LOANS ORIGINATED 5 $88,960 70 $90,030 128 $118,542 20 $21,150 12 $102,837 APPLICATIONS APPROVED, NOT ACCEPTED 0 $0 16 $49,101 11 $93,125 1 $54,470 1 $50,280 APPLICATIONS DENIED 1 $39,980 43 $43,329 36 $90,102 5 $15,538 2 $66,810 APPLICATIONS WITHDRAWN 0 $0 2 $121,090 18 $103,745 3 $37,330 1 $77,850 FILES CLOSED FOR INCOMPLETENESS 0 $0 1 $124,890 10 $137,587 0 $0 0 $0
Aggregated Statistics For Year 2000(Based on 5 partial tracts) A) FHA, FSA/RHS & VA B) Conventional C) Refinancings D) Home Improvement Loans F) Non-occupant Loans on Number Average Value Number Average Value Number Average Value Number Average Value Number Average Value
LOANS ORIGINATED 6 $87,887 82 $79,155 46 $90,602 18 $18,506 9 $82,190 APPLICATIONS APPROVED, NOT ACCEPTED 1 $52,200 21 $54,365 5 $47,302 2 $12,040 1 $8,780 APPLICATIONS DENIED 1 $85,210 103 $38,529 21 $57,353 4 $7,355 4 $51,168 APPLICATIONS WITHDRAWN 2 $71,150 7 $75,883 9 $72,946 1 $3,360 0 $0 FILES CLOSED FOR INCOMPLETENESS 0 $0 0 $0 3 $49,063 0 $0 0 $0
Aggregated Statistics For Year 1999(Based on 5 partial tracts) A) FHA, FSA/RHS & VA B) Conventional C) Refinancings D) Home Improvement Loans F) Non-occupant Loans on Number Average Value Number Average Value Number Average Value Number Average Value Number Average Value
LOANS ORIGINATED 9 $97,180 89 $80,171 63 $90,428 20 $18,464 14 $61,309 APPLICATIONS APPROVED, NOT ACCEPTED 0 $0 16 $69,216 6 $74,372 3 $10,477 1 $64,040 APPLICATIONS DENIED 0 $0 77 $46,769 18 $70,270 6 $11,537 5 $43,114 APPLICATIONS WITHDRAWN 0 $0 8 $81,512 10 $90,590 1 $3,550 1 $20,780 FILES CLOSED FOR INCOMPLETENESS 0 $0 1 $75,310 2 $80,635 0 $0 0 $0
Detailed HMDA statistics for the following Tracts:
0401.02
, 0402.01 , 0402.02 , 0402.03
Private Mortgage Insurance Companies Aggregated Statistics For Year 2009(Based on 5 partial tracts) A) Conventional B) Refinancings Number Average Value Number Average Value
LOANS ORIGINATED 3 $263,983 4 $208,882 APPLICATIONS APPROVED, NOT ACCEPTED 1 $234,100 1 $284,890 APPLICATIONS DENIED 0 $0 2 $165,385 APPLICATIONS WITHDRAWN 0 $0 1 $187,280 FILES CLOSED FOR INCOMPLETENESS 0 $0 0 $0
Aggregated Statistics For Year 2008(Based on 5 partial tracts) A) Conventional B) Refinancings C) Non-occupant Loans on Number Average Value Number Average Value Number Average Value
LOANS ORIGINATED 15 $184,533 6 $221,182 2 $180,930 APPLICATIONS APPROVED, NOT ACCEPTED 2 $151,175 5 $214,696 0 $0 APPLICATIONS DENIED 1 $265,400 0 $0 0 $0 APPLICATIONS WITHDRAWN 0 $0 0 $0 0 $0 FILES CLOSED FOR INCOMPLETENESS 0 $0 0 $0 0 $0
Aggregated Statistics For Year 2007(Based on 5 partial tracts) A) Conventional B) Refinancings C) Non-occupant Loans on Number Average Value Number Average Value Number Average Value
LOANS ORIGINATED 27 $176,813 14 $194,921 2 $170,250 APPLICATIONS APPROVED, NOT ACCEPTED 3 $167,020 1 $247,350 0 $0 APPLICATIONS DENIED 1 $255,640 0 $0 0 $0 APPLICATIONS WITHDRAWN 0 $0 0 $0 0 $0 FILES CLOSED FOR INCOMPLETENESS 0 $0 0 $0 0 $0
Aggregated Statistics For Year 2006(Based on 5 partial tracts) A) Conventional B) Refinancings C) Non-occupant Loans on D) Loans On Manufactured Number Average Value Number Average Value Number Average Value Number Average Value
LOANS ORIGINATED 19 $141,855 7 $169,507 2 $138,110 1 $83,760 APPLICATIONS APPROVED, NOT ACCEPTED 4 $122,752 1 $129,130 0 $0 0 $0 APPLICATIONS DENIED 1 $147,990 0 $0 0 $0 0 $0 APPLICATIONS WITHDRAWN 1 $120,710 0 $0 0 $0 0 $0 FILES CLOSED FOR INCOMPLETENESS 1 $130,050 0 $0 0 $0 0 $0
Aggregated Statistics For Year 2005(Based on 5 partial tracts) A) Conventional B) Refinancings C) Non-occupant Loans on Number Average Value Number Average Value Number Average Value
LOANS ORIGINATED 20 $148,059 7 $160,344 1 $203,300 APPLICATIONS APPROVED, NOT ACCEPTED 3 $154,823 1 $279,410 0 $0 APPLICATIONS DENIED 1 $34,450 0 $0 0 $0 APPLICATIONS WITHDRAWN 1 $114,540 1 $170,490 0 $0 FILES CLOSED FOR INCOMPLETENESS 0 $0 0 $0 0 $0
Aggregated Statistics For Year 2004(Based on 5 partial tracts) A) Conventional B) Refinancings C) Non-occupant Loans on Number Average Value Number Average Value Number Average Value
LOANS ORIGINATED 23 $132,232 12 $154,225 2 $87,335 APPLICATIONS APPROVED, NOT ACCEPTED 3 $129,743 4 $177,278 0 $0 APPLICATIONS DENIED 0 $0 0 $0 0 $0 APPLICATIONS WITHDRAWN 1 $94,780 0 $0 0 $0 FILES CLOSED FOR INCOMPLETENESS 0 $0 0 $0 0 $0
Aggregated Statistics For Year 2003(Based on 5 partial tracts) A) Conventional B) Refinancings C) Non-occupant Loans on Number Average Value Number Average Value Number Average Value
LOANS ORIGINATED 22 $129,378 21 $133,273 4 $108,000 APPLICATIONS APPROVED, NOT ACCEPTED 5 $129,788 7 $123,570 0 $0 APPLICATIONS DENIED 0 $0 0 $0 0 $0 APPLICATIONS WITHDRAWN 2 $86,385 2 $154,365 1 $72,550 FILES CLOSED FOR INCOMPLETENESS 0 $0 0 $0 0 $0
Aggregated Statistics For Year 2002(Based on 5 partial tracts) A) Conventional B) Refinancings C) Non-occupant Loans on Number Average Value Number Average Value Number Average Value
LOANS ORIGINATED 18 $123,340 22 $141,136 2 $80,295 APPLICATIONS APPROVED, NOT ACCEPTED 3 $129,713 6 $128,752 2 $89,885 APPLICATIONS DENIED 1 $98,660 0 $0 0 $0 APPLICATIONS WITHDRAWN 1 $121,960 1 $102,610 0 $0 FILES CLOSED FOR INCOMPLETENESS 0 $0 0 $0 0 $0
Aggregated Statistics For Year 2001(Based on 5 partial tracts) A) Conventional B) Refinancings C) Non-occupant Loans on Number Average Value Number Average Value Number Average Value
LOANS ORIGINATED 17 $124,518 11 $156,134 1 $90,570 APPLICATIONS APPROVED, NOT ACCEPTED 3 $135,780 1 $111,340 1 $201,800 APPLICATIONS DENIED 0 $0 1 $98,310 0 $0 APPLICATIONS WITHDRAWN 0 $0 0 $0 0 $0 FILES CLOSED FOR INCOMPLETENESS 0 $0 0 $0 0 $0
Aggregated Statistics For Year 2000(Based on 5 partial tracts) A) Conventional B) Refinancings C) Non-occupant Loans on Number Average Value Number Average Value Number Average Value
LOANS ORIGINATED 12 $125,262 4 $156,245 1 $97,920 APPLICATIONS APPROVED, NOT ACCEPTED 2 $101,615 1 $85,620 0 $0 APPLICATIONS DENIED 0 $0 0 $0 0 $0 APPLICATIONS WITHDRAWN 1 $198,330 0 $0 0 $0 FILES CLOSED FOR INCOMPLETENESS 0 $0 0 $0 0 $0
Aggregated Statistics For Year 1999(Based on 5 partial tracts) A) Conventional B) Refinancings C) Non-occupant Loans on Number Average Value Number Average Value Number Average Value
LOANS ORIGINATED 14 $111,754 7 $95,616 1 $124,630 APPLICATIONS APPROVED, NOT ACCEPTED 1 $86,820 0 $0 0 $0 APPLICATIONS DENIED 0 $0 0 $0 0 $0 APPLICATIONS WITHDRAWN 0 $0 0 $0 0 $0 FILES CLOSED FOR INCOMPLETENESS 1 $71,280 0 $0 0 $0
Detailed PMIC statistics for the following Tracts:
0401.02
, 0402.01 , 0402.02 , 0402.03 Fire-safe hotels and motels in Pell City, Alabama:
Quality Inn, 1410 Parkhill Pkwy, Pell City, Alabama 35125 Phone: (205) 338-1314, Fax: (205) 338-1512
Holiday Inn Express Hotel & Suites, Pell City, 240 Vaughn Ln, Pell City, Alabama 35125 Phone: (205) 884-0047, Fax: (205) 884-0015
Comfort Suites, 270 Vaughan Ln, Pell City, Alabama 35125 Phone: (205) 338-5570, Fax: (205) 338-5576
Holiday Inn Express & Suites, 240 Vaughan Ln, Pell city, Alabama 35125 Phone: (205) 884-0047, Fax: (205) 884-0015
All 4 fire-safe hotels and motels in Pell City, Alabama
Most common first names in Pell City, AL among deceased individuals Name Count Lived (average)
James 142 71.5 years William 129 73.0 years John 103 70.2 years Mary 100 75.5 years Charles 68 69.2 years Robert 63 68.6 years George 51 75.1 years Willie 47 74.2 years Annie 36 78.3 years Joseph 34 72.6 years
Most common last names in Pell City, AL among deceased individuals Last name Count Lived (average)
Smith 97 73.1 years Williams 42 70.1 years Rich 38 73.3 years Davis 37 71.4 years Bowman 36 72.9 years Lee 33 70.1 years Brown 32 76.3 years Jones 32 75.3 years Barber 31 73.7 years Harris 27 68.6 years
Pell City compared to Alabama state average:
Unemployed percentage below state average. Hispanic race population percentage below state average. Median age below state average. Length of stay since moving in significantly below state average.
Top Patent Applicants
John Michael Golden (5)
Bradley Smith (2)
Kevin Newton (1)
John Michael Scelsi (1)
David J. Shibilia (1)
Charles Rosato (1)
Gregory C. Benson (1)
Charles Leon Rosato (1)
Scott Allen Farr (1)
Samuel Ross Stanley, Jr. (1)
Total of 29 patent applications in 2008-2024.


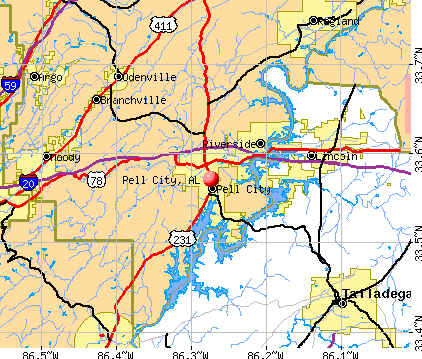


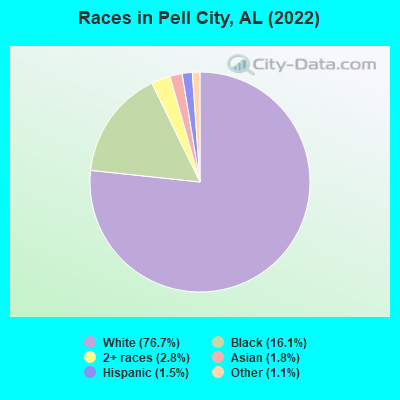
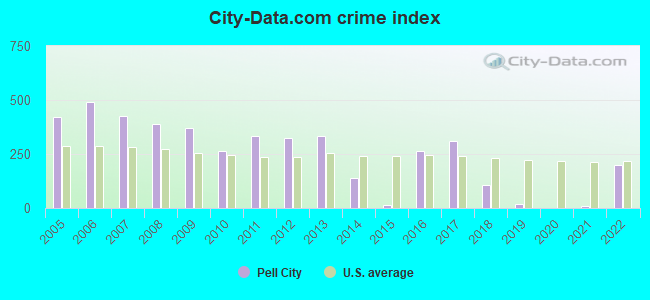
 Recent articles from our blog. Our writers, many of them Ph.D. graduates or candidates, create easy-to-read articles on a wide variety of topics.

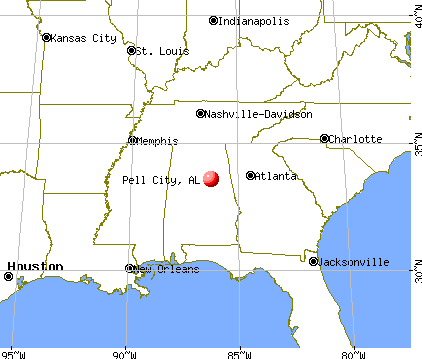
 (31.2 miles
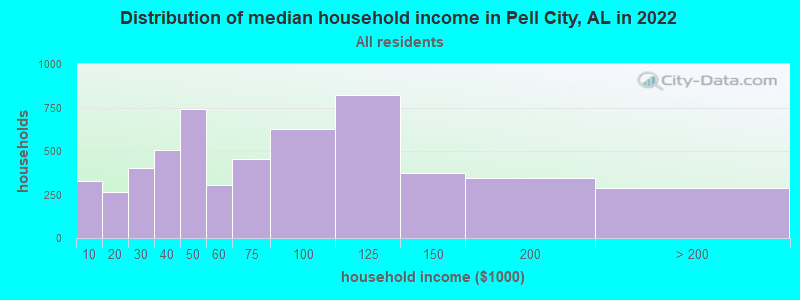
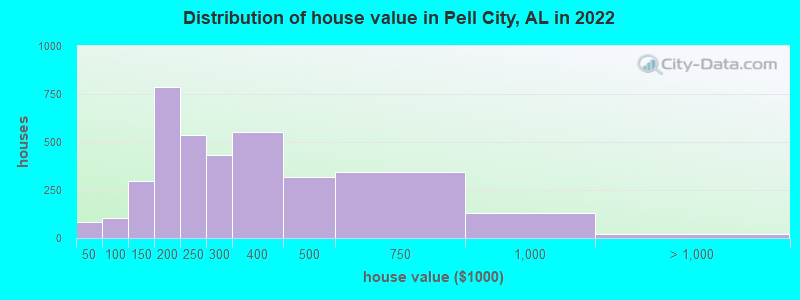
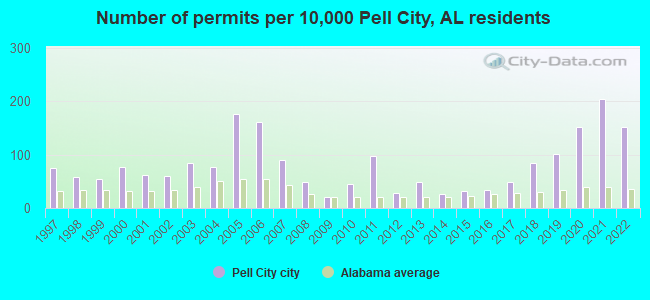
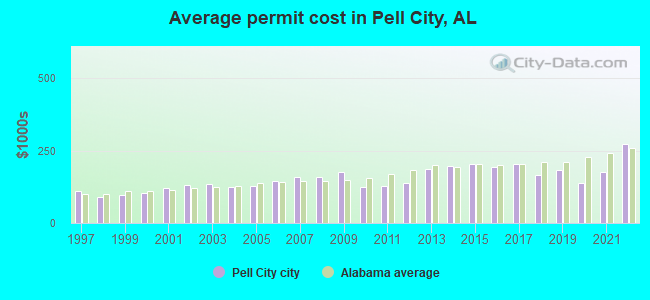
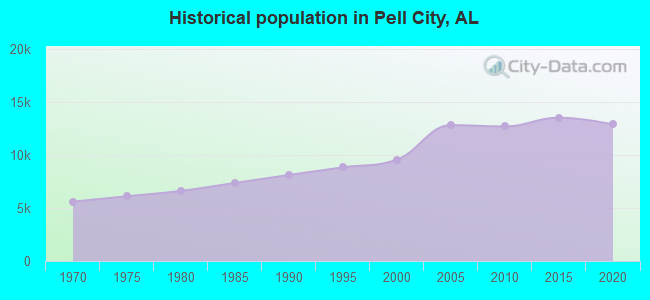
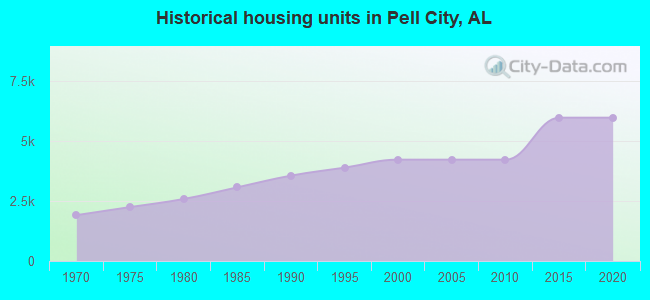
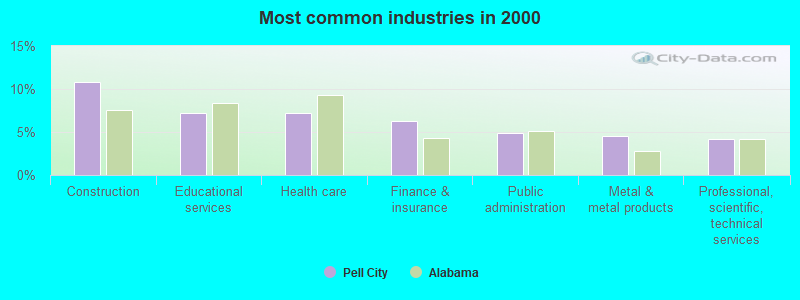
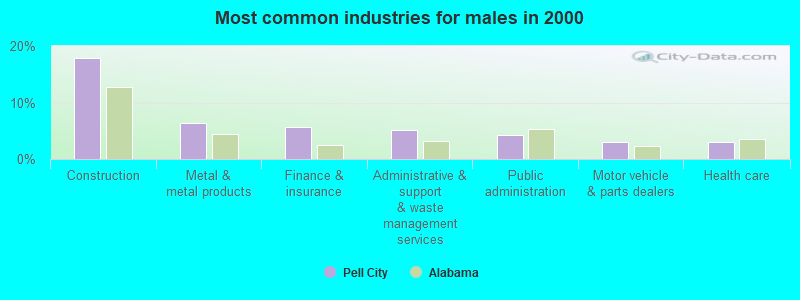
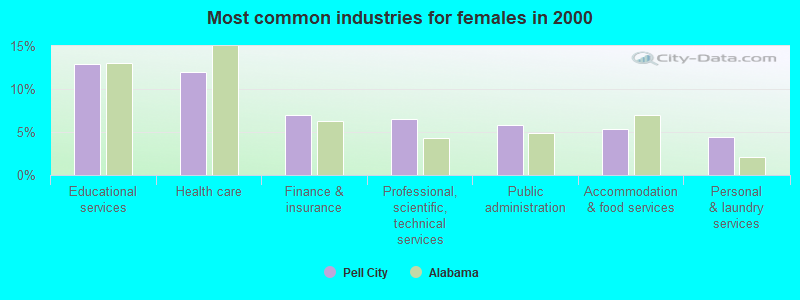
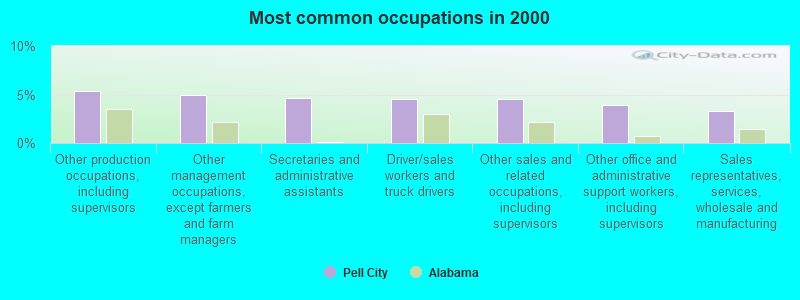

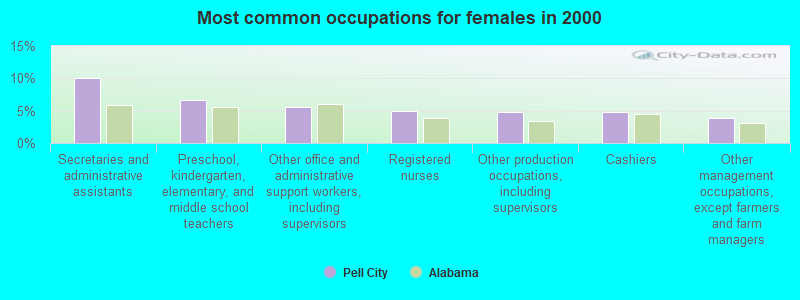
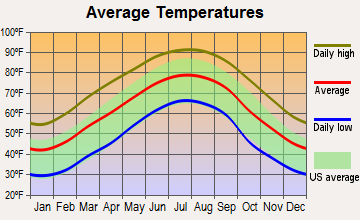
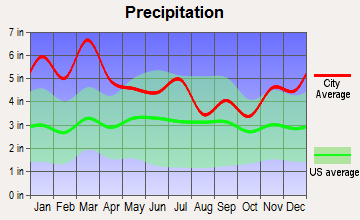
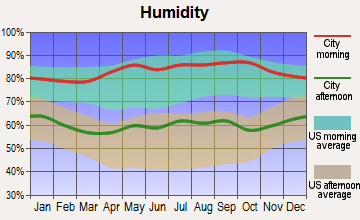
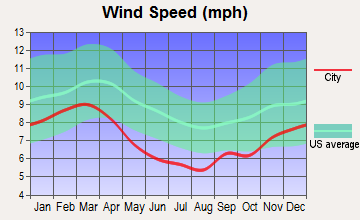
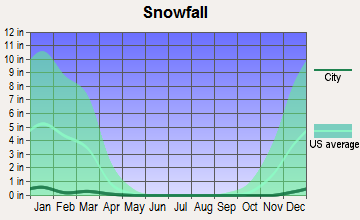
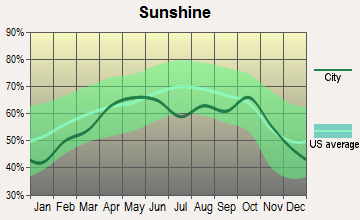
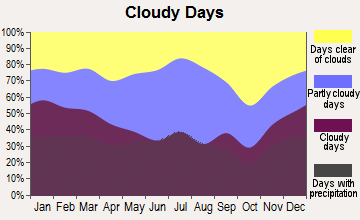


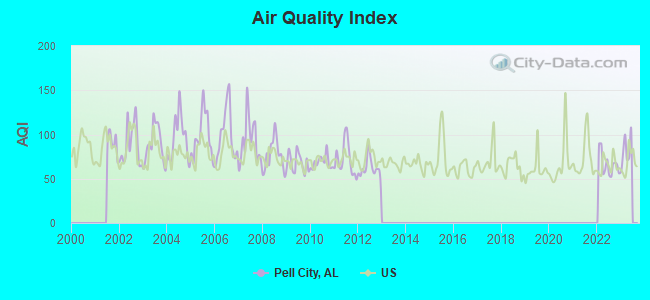
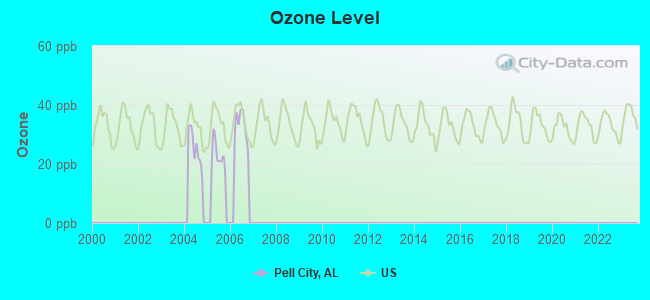
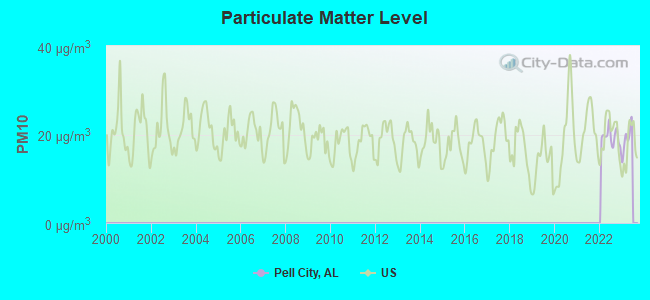
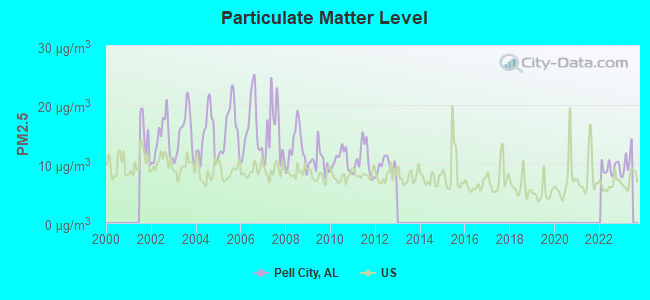
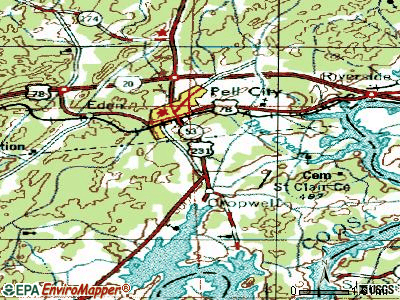

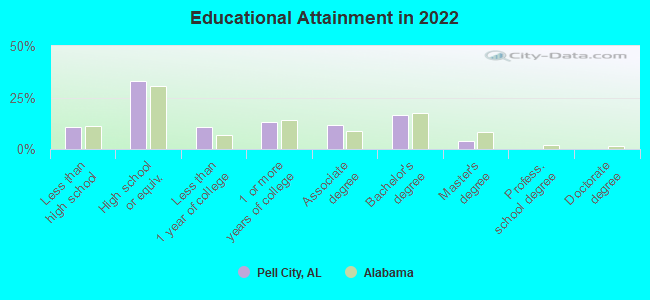
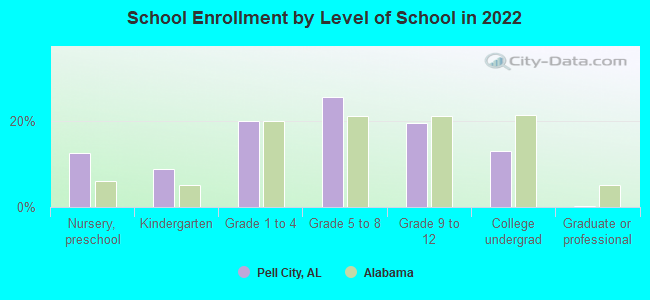
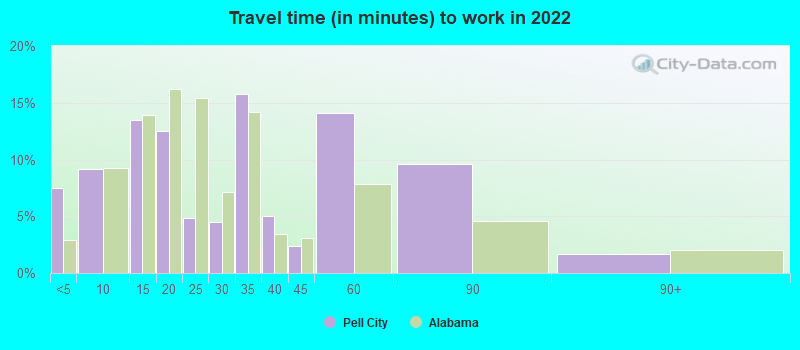

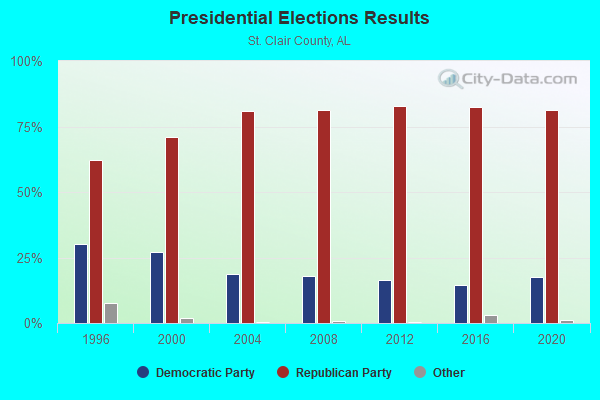
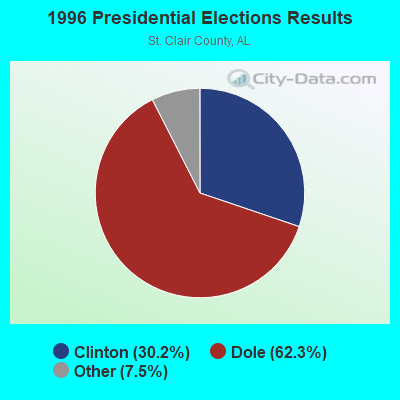
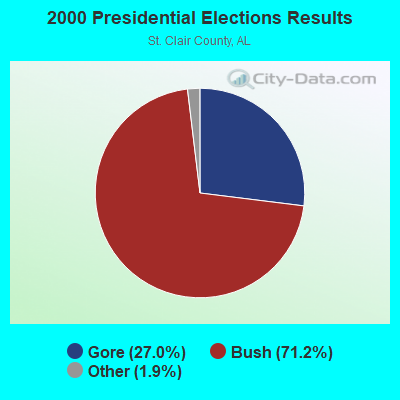
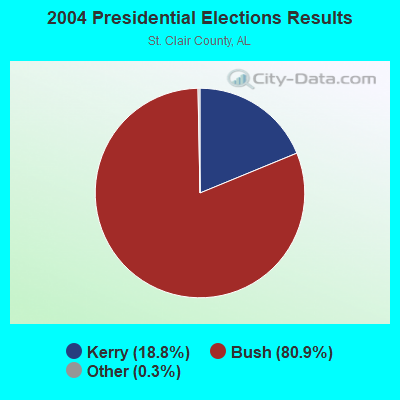
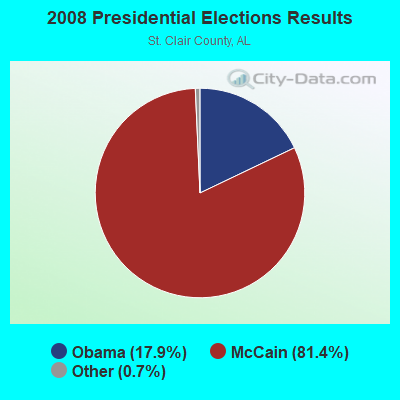
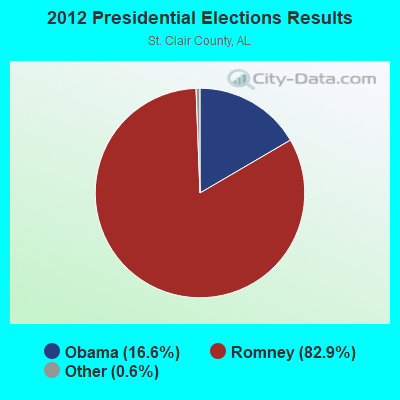

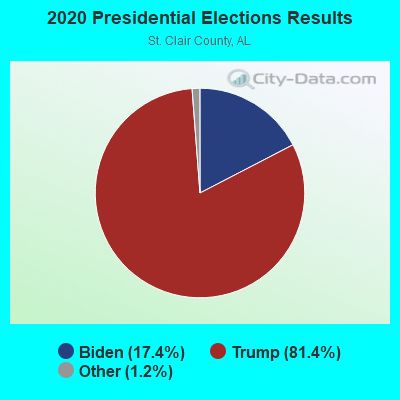
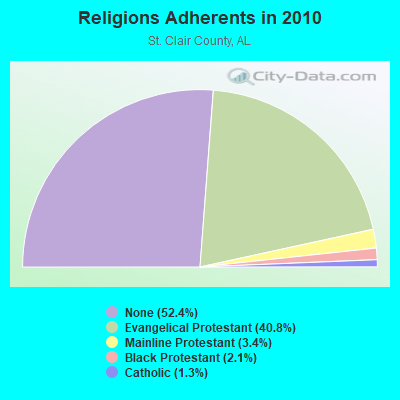
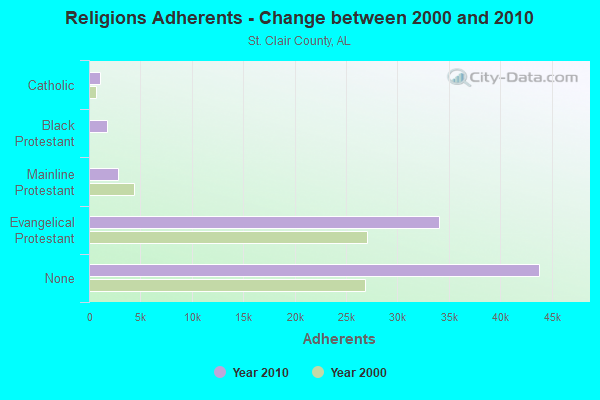

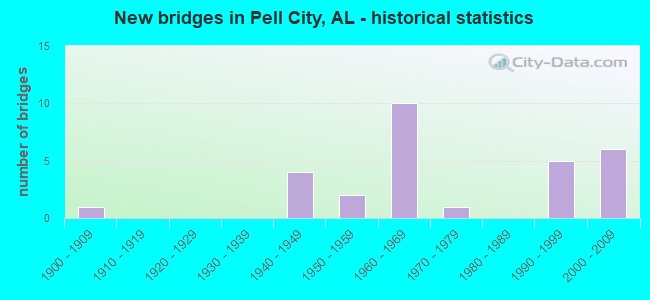
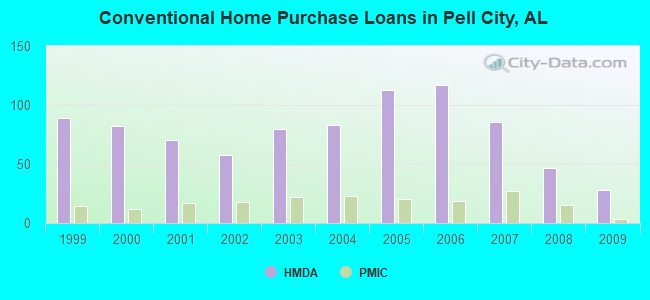
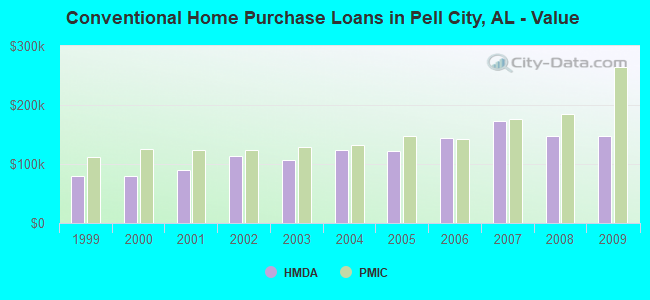
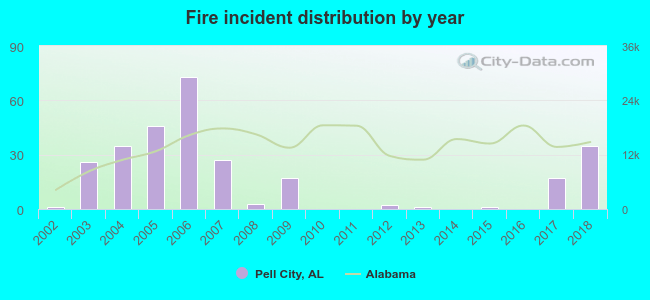 Based on the data from the years 2002 - 2018 the average number of fire incidents per year is 17. The highest number of reported fire incidents - 73 took place in 2006, and the least - 0 in 2010. The data has an increasing trend.
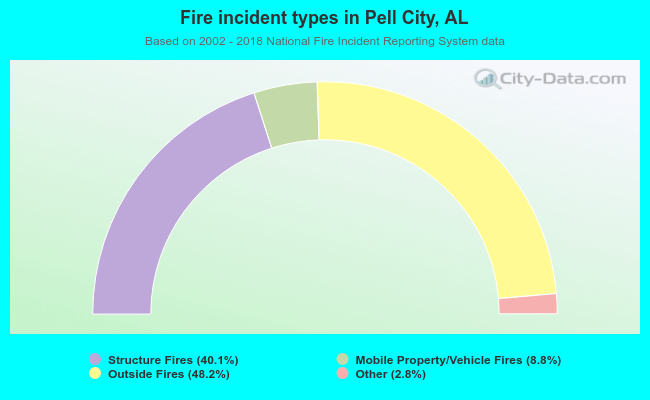 When looking into fire subcategories, the most reports belonged to: Outside Fires (48.2%), and Structure Fires (40.1%).