Flushing, Michigan Submit your own pictures of this city and show them to the world
OSM Map
General Map
Google Map
MSN Map
OSM Map
General Map
Google Map
MSN Map
OSM Map
General Map
Google Map
MSN Map
OSM Map
General Map
Google Map
MSN Map
Please wait while loading the map...
Population in 2022: 8,272 (100% urban, 0% rural). Population change since 2000: -0.9%Males: 3,955 Females: 4,317
March 2022 cost of living index in Flushing: 80.5 (low, U.S. average is 100) Percentage of residents living in poverty in 2022: 6.9%for White Non-Hispanic residents , 8.8% for Hispanic or Latino residents , 4.4% for two or more races residents )Business Search - 14 Million verified businesses
Data:
Median household income ($)
Median household income (% change since 2000)
Household income diversity
Ratio of average income to average house value (%)
Ratio of average income to average rent
Median household income ($) - White
Median household income ($) - Black or African American
Median household income ($) - Asian
Median household income ($) - Hispanic or Latino
Median household income ($) - American Indian and Alaska Native
Median household income ($) - Multirace
Median household income ($) - Other Race
Median household income for houses/condos with a mortgage ($)
Median household income for apartments without a mortgage ($)
Races - White alone (%)
Races - White alone (% change since 2000)
Races - Black alone (%)
Races - Black alone (% change since 2000)
Races - American Indian alone (%)
Races - American Indian alone (% change since 2000)
Races - Asian alone (%)
Races - Asian alone (% change since 2000)
Races - Hispanic (%)
Races - Hispanic (% change since 2000)
Races - Native Hawaiian and Other Pacific Islander alone (%)
Races - Native Hawaiian and Other Pacific Islander alone (% change since 2000)
Races - Two or more races (%)
Races - Two or more races (% change since 2000)
Races - Other race alone (%)
Races - Other race alone (% change since 2000)
Racial diversity
Unemployment (%)
Unemployment (% change since 2000)
Unemployment (%) - White
Unemployment (%) - Black or African American
Unemployment (%) - Asian
Unemployment (%) - Hispanic or Latino
Unemployment (%) - American Indian and Alaska Native
Unemployment (%) - Multirace
Unemployment (%) - Other Race
Population density (people per square mile)
Population - Males (%)
Population - Females (%)
Population - Males (%) - White
Population - Males (%) - Black or African American
Population - Males (%) - Asian
Population - Males (%) - Hispanic or Latino
Population - Males (%) - American Indian and Alaska Native
Population - Males (%) - Multirace
Population - Males (%) - Other Race
Population - Females (%) - White
Population - Females (%) - Black or African American
Population - Females (%) - Asian
Population - Females (%) - Hispanic or Latino
Population - Females (%) - American Indian and Alaska Native
Population - Females (%) - Multirace
Population - Females (%) - Other Race
Coronavirus confirmed cases (Jun 15, 2024)
Deaths caused by coronavirus (Jun 15, 2024)
Coronavirus confirmed cases (per 100k population) (Jun 15, 2024)
Deaths caused by coronavirus (per 100k population) (Jun 15, 2024)
Daily increase in number of cases (Jun 15, 2024)
Weekly increase in number of cases (Jun 15, 2024)
Cases doubled (in days) (Jun 15, 2024)
Hospitalized patients (Apr 18, 2022)
Negative test results (Apr 18, 2022)
Total test results (Apr 18, 2022)
COVID Vaccine doses distributed (per 100k population) (Sep 19, 2023)
COVID Vaccine doses administered (per 100k population) (Sep 19, 2023)
COVID Vaccine doses distributed (Sep 19, 2023)
COVID Vaccine doses administered (Sep 19, 2023)
Likely homosexual households (%)
Likely homosexual households (% change since 2000)
Likely homosexual households - Lesbian couples (%)
Likely homosexual households - Lesbian couples (% change since 2000)
Likely homosexual households - Gay men (%)
Likely homosexual households - Gay men (% change since 2000)
Cost of living index
Median gross rent ($)
Median contract rent ($)
Median monthly housing costs ($)
Median house or condo value ($)
Median house or condo value ($ change since 2000)
Mean house or condo value by units in structure - 1, detached ($)
Mean house or condo value by units in structure - 1, attached ($)
Mean house or condo value by units in structure - 2 ($)
Mean house or condo value by units in structure by units in structure - 3 or 4 ($)
Mean house or condo value by units in structure - 5 or more ($)
Mean house or condo value by units in structure - Boat, RV, van, etc. ($)
Mean house or condo value by units in structure - Mobile home ($)
Median house or condo value ($) - White
Median house or condo value ($) - Black or African American
Median house or condo value ($) - Asian
Median house or condo value ($) - Hispanic or Latino
Median house or condo value ($) - American Indian and Alaska Native
Median house or condo value ($) - Multirace
Median house or condo value ($) - Other Race
Median resident age
Resident age diversity
Median resident age - Males
Median resident age - Females
Median resident age - White
Median resident age - Black or African American
Median resident age - Asian
Median resident age - Hispanic or Latino
Median resident age - American Indian and Alaska Native
Median resident age - Multirace
Median resident age - Other Race
Median resident age - Males - White
Median resident age - Males - Black or African American
Median resident age - Males - Asian
Median resident age - Males - Hispanic or Latino
Median resident age - Males - American Indian and Alaska Native
Median resident age - Males - Multirace
Median resident age - Males - Other Race
Median resident age - Females - White
Median resident age - Females - Black or African American
Median resident age - Females - Asian
Median resident age - Females - Hispanic or Latino
Median resident age - Females - American Indian and Alaska Native
Median resident age - Females - Multirace
Median resident age - Females - Other Race
Commute - mean travel time to work (minutes)
Travel time to work - Less than 5 minutes (%)
Travel time to work - Less than 5 minutes (% change since 2000)
Travel time to work - 5 to 9 minutes (%)
Travel time to work - 5 to 9 minutes (% change since 2000)
Travel time to work - 10 to 19 minutes (%)
Travel time to work - 10 to 19 minutes (% change since 2000)
Travel time to work - 20 to 29 minutes (%)
Travel time to work - 20 to 29 minutes (% change since 2000)
Travel time to work - 30 to 39 minutes (%)
Travel time to work - 30 to 39 minutes (% change since 2000)
Travel time to work - 40 to 59 minutes (%)
Travel time to work - 40 to 59 minutes (% change since 2000)
Travel time to work - 60 to 89 minutes (%)
Travel time to work - 60 to 89 minutes (% change since 2000)
Travel time to work - 90 or more minutes (%)
Travel time to work - 90 or more minutes (% change since 2000)
Marital status - Never married (%)
Marital status - Now married (%)
Marital status - Separated (%)
Marital status - Widowed (%)
Marital status - Divorced (%)
Median family income ($)
Median family income (% change since 2000)
Median non-family income ($)
Median non-family income (% change since 2000)
Median per capita income ($)
Median per capita income (% change since 2000)
Median family income ($) - White
Median family income ($) - Black or African American
Median family income ($) - Asian
Median family income ($) - Hispanic or Latino
Median family income ($) - American Indian and Alaska Native
Median family income ($) - Multirace
Median family income ($) - Other Race
Median year house/condo built
Median year apartment built
Year house built - Built 2005 or later (%)
Year house built - Built 2000 to 2004 (%)
Year house built - Built 1990 to 1999 (%)
Year house built - Built 1980 to 1989 (%)
Year house built - Built 1970 to 1979 (%)
Year house built - Built 1960 to 1969 (%)
Year house built - Built 1950 to 1959 (%)
Year house built - Built 1940 to 1949 (%)
Year house built - Built 1939 or earlier (%)
Average household size
Household density (households per square mile)
Average household size - White
Average household size - Black or African American
Average household size - Asian
Average household size - Hispanic or Latino
Average household size - American Indian and Alaska Native
Average household size - Multirace
Average household size - Other Race
Occupied housing units (%)
Vacant housing units (%)
Owner occupied housing units (%)
Renter occupied housing units (%)
Vacancy status - For rent (%)
Vacancy status - For sale only (%)
Vacancy status - Rented or sold, not occupied (%)
Vacancy status - For seasonal, recreational, or occasional use (%)
Vacancy status - For migrant workers (%)
Vacancy status - Other vacant (%)
Residents with income below the poverty level (%)
Residents with income below 50% of the poverty level (%)
Children below poverty level (%)
Poor families by family type - Married-couple family (%)
Poor families by family type - Male, no wife present (%)
Poor families by family type - Female, no husband present (%)
Poverty status for native-born residents (%)
Poverty status for foreign-born residents (%)
Poverty among high school graduates not in families (%)
Poverty among people who did not graduate high school not in families (%)
Residents with income below the poverty level (%) - White
Residents with income below the poverty level (%) - Black or African American
Residents with income below the poverty level (%) - Asian
Residents with income below the poverty level (%) - Hispanic or Latino
Residents with income below the poverty level (%) - American Indian and Alaska Native
Residents with income below the poverty level (%) - Multirace
Residents with income below the poverty level (%) - Other Race
Air pollution - Air Quality Index (AQI)
Air pollution - CO
Air pollution - NO2
Air pollution - SO2
Air pollution - Ozone
Air pollution - PM10
Air pollution - PM25
Air pollution - Pb
Crime - Murders per 100,000 population
Crime - Rapes per 100,000 population
Crime - Robberies per 100,000 population
Crime - Assaults per 100,000 population
Crime - Burglaries per 100,000 population
Crime - Thefts per 100,000 population
Crime - Auto thefts per 100,000 population
Crime - Arson per 100,000 population
Crime - City-data.com crime index
Crime - Violent crime index
Crime - Property crime index
Crime - Murders per 100,000 population (5 year average)
Crime - Rapes per 100,000 population (5 year average)
Crime - Robberies per 100,000 population (5 year average)
Crime - Assaults per 100,000 population (5 year average)
Crime - Burglaries per 100,000 population (5 year average)
Crime - Thefts per 100,000 population (5 year average)
Crime - Auto thefts per 100,000 population (5 year average)
Crime - Arson per 100,000 population (5 year average)
Crime - City-data.com crime index (5 year average)
Crime - Violent crime index (5 year average)
Crime - Property crime index (5 year average)
1996 Presidential Elections Results (%) - Democratic Party (Clinton)
1996 Presidential Elections Results (%) - Republican Party (Dole)
1996 Presidential Elections Results (%) - Other
2000 Presidential Elections Results (%) - Democratic Party (Gore)
2000 Presidential Elections Results (%) - Republican Party (Bush)
2000 Presidential Elections Results (%) - Other
2004 Presidential Elections Results (%) - Democratic Party (Kerry)
2004 Presidential Elections Results (%) - Republican Party (Bush)
2004 Presidential Elections Results (%) - Other
2008 Presidential Elections Results (%) - Democratic Party (Obama)
2008 Presidential Elections Results (%) - Republican Party (McCain)
2008 Presidential Elections Results (%) - Other
2012 Presidential Elections Results (%) - Democratic Party (Obama)
2012 Presidential Elections Results (%) - Republican Party (Romney)
2012 Presidential Elections Results (%) - Other
2016 Presidential Elections Results (%) - Democratic Party (Clinton)
2016 Presidential Elections Results (%) - Republican Party (Trump)
2016 Presidential Elections Results (%) - Other
2020 Presidential Elections Results (%) - Democratic Party (Biden)
2020 Presidential Elections Results (%) - Republican Party (Trump)
2020 Presidential Elections Results (%) - Other
Ancestries Reported - Arab (%)
Ancestries Reported - Czech (%)
Ancestries Reported - Danish (%)
Ancestries Reported - Dutch (%)
Ancestries Reported - English (%)
Ancestries Reported - French (%)
Ancestries Reported - French Canadian (%)
Ancestries Reported - German (%)
Ancestries Reported - Greek (%)
Ancestries Reported - Hungarian (%)
Ancestries Reported - Irish (%)
Ancestries Reported - Italian (%)
Ancestries Reported - Lithuanian (%)
Ancestries Reported - Norwegian (%)
Ancestries Reported - Polish (%)
Ancestries Reported - Portuguese (%)
Ancestries Reported - Russian (%)
Ancestries Reported - Scotch-Irish (%)
Ancestries Reported - Scottish (%)
Ancestries Reported - Slovak (%)
Ancestries Reported - Subsaharan African (%)
Ancestries Reported - Swedish (%)
Ancestries Reported - Swiss (%)
Ancestries Reported - Ukrainian (%)
Ancestries Reported - United States (%)
Ancestries Reported - Welsh (%)
Ancestries Reported - West Indian (%)
Ancestries Reported - Other (%)
Educational Attainment - No schooling completed (%)
Educational Attainment - Less than high school (%)
Educational Attainment - High school or equivalent (%)
Educational Attainment - Less than 1 year of college (%)
Educational Attainment - 1 or more years of college (%)
Educational Attainment - Associate degree (%)
Educational Attainment - Bachelor's degree (%)
Educational Attainment - Master's degree (%)
Educational Attainment - Professional school degree (%)
Educational Attainment - Doctorate degree (%)
School Enrollment - Nursery, preschool (%)
School Enrollment - Kindergarten (%)
School Enrollment - Grade 1 to 4 (%)
School Enrollment - Grade 5 to 8 (%)
School Enrollment - Grade 9 to 12 (%)
School Enrollment - College undergrad (%)
School Enrollment - Graduate or professional (%)
School Enrollment - Not enrolled in school (%)
School enrollment - Public schools (%)
School enrollment - Private schools (%)
School enrollment - Not enrolled (%)
Median number of rooms in houses and condos
Median number of rooms in apartments
Housing units lacking complete plumbing facilities (%)
Housing units lacking complete kitchen facilities (%)
Density of houses
Urban houses (%)
Rural houses (%)
Households with people 60 years and over (%)
Households with people 65 years and over (%)
Households with people 75 years and over (%)
Households with one or more nonrelatives (%)
Households with no nonrelatives (%)
Population in households (%)
Family households (%)
Nonfamily households (%)
Population in families (%)
Family households with own children (%)
Median number of bedrooms in owner occupied houses
Mean number of bedrooms in owner occupied houses
Median number of bedrooms in renter occupied houses
Mean number of bedrooms in renter occupied houses
Median number of vehichles in owner occupied houses
Mean number of vehichles in owner occupied houses
Median number of vehichles in renter occupied houses
Mean number of vehichles in renter occupied houses
Mortgage status - with mortgage (%)
Mortgage status - with second mortgage (%)
Mortgage status - with home equity loan (%)
Mortgage status - with both second mortgage and home equity loan (%)
Mortgage status - without a mortgage (%)
Average family size
Average family size - White
Average family size - Black or African American
Average family size - Asian
Average family size - Hispanic or Latino
Average family size - American Indian and Alaska Native
Average family size - Multirace
Average family size - Other Race
Geographical mobility - Same house 1 year ago (%)
Geographical mobility - Moved within same county (%)
Geographical mobility - Moved from different county within same state (%)
Geographical mobility - Moved from different state (%)
Geographical mobility - Moved from abroad (%)
Place of birth - Born in state of residence (%)
Place of birth - Born in other state (%)
Place of birth - Native, outside of US (%)
Place of birth - Foreign born (%)
Housing units in structures - 1, detached (%)
Housing units in structures - 1, attached (%)
Housing units in structures - 2 (%)
Housing units in structures - 3 or 4 (%)
Housing units in structures - 5 to 9 (%)
Housing units in structures - 10 to 19 (%)
Housing units in structures - 20 to 49 (%)
Housing units in structures - 50 or more (%)
Housing units in structures - Mobile home (%)
Housing units in structures - Boat, RV, van, etc. (%)
House/condo owner moved in on average (years ago)
Renter moved in on average (years ago)
Year householder moved into unit - Moved in 1999 to March 2000 (%)
Year householder moved into unit - Moved in 1995 to 1998 (%)
Year householder moved into unit - Moved in 1990 to 1994 (%)
Year householder moved into unit - Moved in 1980 to 1989 (%)
Year householder moved into unit - Moved in 1970 to 1979 (%)
Year householder moved into unit - Moved in 1969 or earlier (%)
Means of transportation to work - Drove car alone (%)
Means of transportation to work - Carpooled (%)
Means of transportation to work - Public transportation (%)
Means of transportation to work - Bus or trolley bus (%)
Means of transportation to work - Streetcar or trolley car (%)
Means of transportation to work - Subway or elevated (%)
Means of transportation to work - Railroad (%)
Means of transportation to work - Ferryboat (%)
Means of transportation to work - Taxicab (%)
Means of transportation to work - Motorcycle (%)
Means of transportation to work - Bicycle (%)
Means of transportation to work - Walked (%)
Means of transportation to work - Other means (%)
Working at home (%)
Industry diversity
Most Common Industries - Agriculture, forestry, fishing and hunting, and mining (%)
Most Common Industries - Agriculture, forestry, fishing and hunting (%)
Most Common Industries - Mining, quarrying, and oil and gas extraction (%)
Most Common Industries - Construction (%)
Most Common Industries - Manufacturing (%)
Most Common Industries - Wholesale trade (%)
Most Common Industries - Retail trade (%)
Most Common Industries - Transportation and warehousing, and utilities (%)
Most Common Industries - Transportation and warehousing (%)
Most Common Industries - Utilities (%)
Most Common Industries - Information (%)
Most Common Industries - Finance and insurance, and real estate and rental and leasing (%)
Most Common Industries - Finance and insurance (%)
Most Common Industries - Real estate and rental and leasing (%)
Most Common Industries - Professional, scientific, and management, and administrative and waste management services (%)
Most Common Industries - Professional, scientific, and technical services (%)
Most Common Industries - Management of companies and enterprises (%)
Most Common Industries - Administrative and support and waste management services (%)
Most Common Industries - Educational services, and health care and social assistance (%)
Most Common Industries - Educational services (%)
Most Common Industries - Health care and social assistance (%)
Most Common Industries - Arts, entertainment, and recreation, and accommodation and food services (%)
Most Common Industries - Arts, entertainment, and recreation (%)
Most Common Industries - Accommodation and food services (%)
Most Common Industries - Other services, except public administration (%)
Most Common Industries - Public administration (%)
Occupation diversity
Most Common Occupations - Management, business, science, and arts occupations (%)
Most Common Occupations - Management, business, and financial occupations (%)
Most Common Occupations - Management occupations (%)
Most Common Occupations - Business and financial operations occupations (%)
Most Common Occupations - Computer, engineering, and science occupations (%)
Most Common Occupations - Computer and mathematical occupations (%)
Most Common Occupations - Architecture and engineering occupations (%)
Most Common Occupations - Life, physical, and social science occupations (%)
Most Common Occupations - Education, legal, community service, arts, and media occupations (%)
Most Common Occupations - Community and social service occupations (%)
Most Common Occupations - Legal occupations (%)
Most Common Occupations - Education, training, and library occupations (%)
Most Common Occupations - Arts, design, entertainment, sports, and media occupations (%)
Most Common Occupations - Healthcare practitioners and technical occupations (%)
Most Common Occupations - Health diagnosing and treating practitioners and other technical occupations (%)
Most Common Occupations - Health technologists and technicians (%)
Most Common Occupations - Service occupations (%)
Most Common Occupations - Healthcare support occupations (%)
Most Common Occupations - Protective service occupations (%)
Most Common Occupations - Fire fighting and prevention, and other protective service workers including supervisors (%)
Most Common Occupations - Law enforcement workers including supervisors (%)
Most Common Occupations - Food preparation and serving related occupations (%)
Most Common Occupations - Building and grounds cleaning and maintenance occupations (%)
Most Common Occupations - Personal care and service occupations (%)
Most Common Occupations - Sales and office occupations (%)
Most Common Occupations - Sales and related occupations (%)
Most Common Occupations - Office and administrative support occupations (%)
Most Common Occupations - Natural resources, construction, and maintenance occupations (%)
Most Common Occupations - Farming, fishing, and forestry occupations (%)
Most Common Occupations - Construction and extraction occupations (%)
Most Common Occupations - Installation, maintenance, and repair occupations (%)
Most Common Occupations - Production, transportation, and material moving occupations (%)
Most Common Occupations - Production occupations (%)
Most Common Occupations - Transportation occupations (%)
Most Common Occupations - Material moving occupations (%)
People in Group quarters - Institutionalized population (%)
People in Group quarters - Correctional institutions (%)
People in Group quarters - Federal prisons and detention centers (%)
People in Group quarters - Halfway houses (%)
People in Group quarters - Local jails and other confinement facilities (including police lockups) (%)
People in Group quarters - Military disciplinary barracks (%)
People in Group quarters - State prisons (%)
People in Group quarters - Other types of correctional institutions (%)
People in Group quarters - Nursing homes (%)
People in Group quarters - Hospitals/wards, hospices, and schools for the handicapped (%)
People in Group quarters - Hospitals/wards and hospices for chronically ill (%)
People in Group quarters - Hospices or homes for chronically ill (%)
People in Group quarters - Military hospitals or wards for chronically ill (%)
People in Group quarters - Other hospitals or wards for chronically ill (%)
People in Group quarters - Hospitals or wards for drug/alcohol abuse (%)
People in Group quarters - Mental (Psychiatric) hospitals or wards (%)
People in Group quarters - Schools, hospitals, or wards for the mentally retarded (%)
People in Group quarters - Schools, hospitals, or wards for the physically handicapped (%)
People in Group quarters - Institutions for the deaf (%)
People in Group quarters - Institutions for the blind (%)
People in Group quarters - Orthopedic wards and institutions for the physically handicapped (%)
People in Group quarters - Wards in general hospitals for patients who have no usual home elsewhere (%)
People in Group quarters - Wards in military hospitals for patients who have no usual home elsewhere (%)
People in Group quarters - Juvenile institutions (%)
People in Group quarters - Long-term care (%)
People in Group quarters - Homes for abused, dependent, and neglected children (%)
People in Group quarters - Residential treatment centers for emotionally disturbed children (%)
People in Group quarters - Training schools for juvenile delinquents (%)
People in Group quarters - Short-term care, detention or diagnostic centers for delinquent children (%)
People in Group quarters - Type of juvenile institution unknown (%)
People in Group quarters - Noninstitutionalized population (%)
People in Group quarters - College dormitories (includes college quarters off campus) (%)
People in Group quarters - Military quarters (%)
People in Group quarters - On base (%)
People in Group quarters - Barracks, unaccompanied personnel housing (UPH), (Enlisted/Officer), ;and similar group living quarters for military personnel (%)
People in Group quarters - Transient quarters for temporary residents (%)
People in Group quarters - Military ships (%)
People in Group quarters - Group homes (%)
People in Group quarters - Homes or halfway houses for drug/alcohol abuse (%)
People in Group quarters - Homes for the mentally ill (%)
People in Group quarters - Homes for the mentally retarded (%)
People in Group quarters - Homes for the physically handicapped (%)
People in Group quarters - Other group homes (%)
People in Group quarters - Religious group quarters (%)
People in Group quarters - Dormitories (%)
People in Group quarters - Agriculture workers' dormitories on farms (%)
People in Group quarters - Job Corps and vocational training facilities (%)
People in Group quarters - Other workers' dormitories (%)
People in Group quarters - Crews of maritime vessels (%)
People in Group quarters - Other nonhousehold living situations (%)
People in Group quarters - Other noninstitutional group quarters (%)
Residents speaking English at home (%)
Residents speaking English at home - Born in the United States (%)
Residents speaking English at home - Native, born elsewhere (%)
Residents speaking English at home - Foreign born (%)
Residents speaking Spanish at home (%)
Residents speaking Spanish at home - Born in the United States (%)
Residents speaking Spanish at home - Native, born elsewhere (%)
Residents speaking Spanish at home - Foreign born (%)
Residents speaking other language at home (%)
Residents speaking other language at home - Born in the United States (%)
Residents speaking other language at home - Native, born elsewhere (%)
Residents speaking other language at home - Foreign born (%)
Class of Workers - Employee of private company (%)
Class of Workers - Self-employed in own incorporated business (%)
Class of Workers - Private not-for-profit wage and salary workers (%)
Class of Workers - Local government workers (%)
Class of Workers - State government workers (%)
Class of Workers - Federal government workers (%)
Class of Workers - Self-employed workers in own not incorporated business and Unpaid family workers (%)
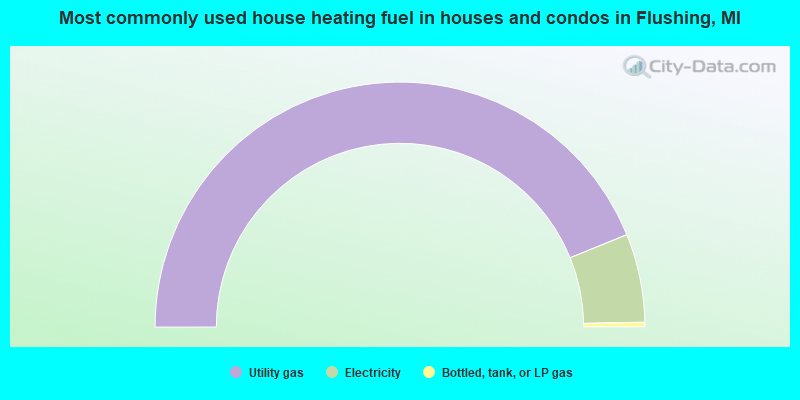
House heating fuel used in houses and condos - Utility gas (%)
House heating fuel used in houses and condos - Bottled, tank, or LP gas (%)
House heating fuel used in houses and condos - Electricity (%)
House heating fuel used in houses and condos - Fuel oil, kerosene, etc. (%)
House heating fuel used in houses and condos - Coal or coke (%)
House heating fuel used in houses and condos - Wood (%)
House heating fuel used in houses and condos - Solar energy (%)
House heating fuel used in houses and condos - Other fuel (%)
House heating fuel used in houses and condos - No fuel used (%)
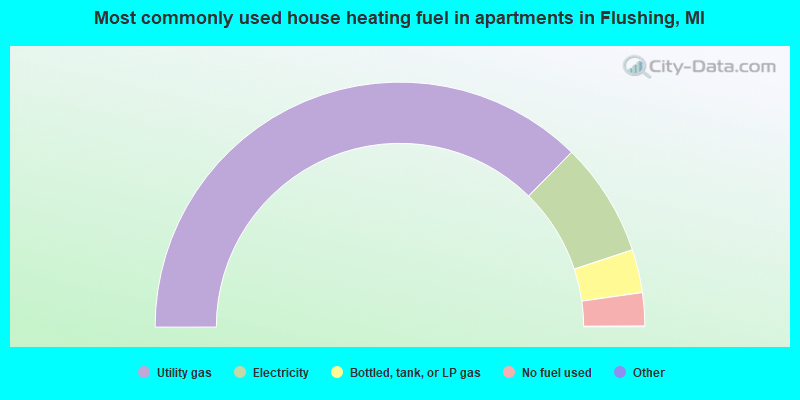
House heating fuel used in apartments - Utility gas (%)
House heating fuel used in apartments - Bottled, tank, or LP gas (%)
House heating fuel used in apartments - Electricity (%)
House heating fuel used in apartments - Fuel oil, kerosene, etc. (%)
House heating fuel used in apartments - Coal or coke (%)
House heating fuel used in apartments - Wood (%)
House heating fuel used in apartments - Solar energy (%)
House heating fuel used in apartments - Other fuel (%)
House heating fuel used in apartments - No fuel used (%)
Armed forces status - In Armed Forces (%)
Armed forces status - Civilian (%)
Armed forces status - Civilian - Veteran (%)
Armed forces status - Civilian - Nonveteran (%)
Fatal accidents locations in years 2005-2021
Fatal accidents locations in 2005
Fatal accidents locations in 2006
Fatal accidents locations in 2007
Fatal accidents locations in 2008
Fatal accidents locations in 2009
Fatal accidents locations in 2010
Fatal accidents locations in 2011
Fatal accidents locations in 2012
Fatal accidents locations in 2013
Fatal accidents locations in 2014
Fatal accidents locations in 2015
Fatal accidents locations in 2016
Fatal accidents locations in 2017
Fatal accidents locations in 2018
Fatal accidents locations in 2019
Fatal accidents locations in 2020
Fatal accidents locations in 2021
Alcohol use - People drinking some alcohol every month (%)
Alcohol use - People not drinking at all (%)
Alcohol use - Average days/month drinking alcohol
Alcohol use - Average drinks/week
Alcohol use - Average days/year people drink much
Audiometry - Average condition of hearing (%)
Audiometry - People that can hear a whisper from across a quiet room (%)
Audiometry - People that can hear normal voice from across a quiet room (%)
Audiometry - Ears ringing, roaring, buzzing (%)
Audiometry - Had a job exposure to loud noise (%)
Audiometry - Had off-work exposure to loud noise (%)
Blood Pressure & Cholesterol - Has high blood pressure (%)
Blood Pressure & Cholesterol - Checking blood pressure at home (%)
Blood Pressure & Cholesterol - Frequently checking blood cholesterol (%)
Blood Pressure & Cholesterol - Has high cholesterol level (%)
Consumer Behavior - Money monthly spent on food at supermarket/grocery store
Consumer Behavior - Money monthly spent on food at other stores
Consumer Behavior - Money monthly spent on eating out
Consumer Behavior - Money monthly spent on carryout/delivered foods
Consumer Behavior - Income spent on food at supermarket/grocery store (%)
Consumer Behavior - Income spent on food at other stores (%)
Consumer Behavior - Income spent on eating out (%)
Consumer Behavior - Income spent on carryout/delivered foods (%)
Current Health Status - General health condition (%)
Current Health Status - Blood donors (%)
Current Health Status - Has blood ever tested for HIV virus (%)
Current Health Status - Left-handed people (%)
Dermatology - People using sunscreen (%)
Diabetes - Diabetics (%)
Diabetes - Had a blood test for high blood sugar (%)
Diabetes - People taking insulin (%)
Diet Behavior & Nutrition - Diet health (%)
Diet Behavior & Nutrition - Milk product consumption (# of products/month)
Diet Behavior & Nutrition - Meals not home prepared (#/week)
Diet Behavior & Nutrition - Meals from fast food or pizza place (#/week)
Diet Behavior & Nutrition - Ready-to-eat foods (#/month)
Diet Behavior & Nutrition - Frozen meals/pizza (#/month)
Drug Use - People that ever used marijuana or hashish (%)
Drug Use - Ever used hard drugs (%)
Drug Use - Ever used any form of cocaine (%)
Drug Use - Ever used heroin (%)
Drug Use - Ever used methamphetamine (%)
Health Insurance - People covered by health insurance (%)
Kidney Conditions-Urology - Avg. # of times urinating at night
Medical Conditions - People with asthma (%)
Medical Conditions - People with anemia (%)
Medical Conditions - People with psoriasis (%)
Medical Conditions - People with overweight (%)
Medical Conditions - Elderly people having difficulties in thinking or remembering (%)
Medical Conditions - People who ever received blood transfusion (%)
Medical Conditions - People having trouble seeing even with glass/contacts (%)
Medical Conditions - People with arthritis (%)
Medical Conditions - People with gout (%)
Medical Conditions - People with congestive heart failure (%)
Medical Conditions - People with coronary heart disease (%)
Medical Conditions - People with angina pectoris (%)
Medical Conditions - People who ever had heart attack (%)
Medical Conditions - People who ever had stroke (%)
Medical Conditions - People with emphysema (%)
Medical Conditions - People with thyroid problem (%)
Medical Conditions - People with chronic bronchitis (%)
Medical Conditions - People with any liver condition (%)
Medical Conditions - People who ever had cancer or malignancy (%)
Mental Health - People who have little interest in doing things (%)
Mental Health - People feeling down, depressed, or hopeless (%)
Mental Health - People who have trouble sleeping or sleeping too much (%)
Mental Health - People feeling tired or having little energy (%)
Mental Health - People with poor appetite or overeating (%)
Mental Health - People feeling bad about themself (%)
Mental Health - People who have trouble concentrating on things (%)
Mental Health - People moving or speaking slowly or too fast (%)
Mental Health - People having thoughts they would be better off dead (%)
Oral Health - Average years since last visit a dentist
Oral Health - People embarrassed because of mouth (%)
Oral Health - People with gum disease (%)
Oral Health - General health of teeth and gums (%)
Oral Health - Average days a week using dental floss/device
Oral Health - Average days a week using mouthwash for dental problem
Oral Health - Average number of teeth
Pesticide Use - Households using pesticides to control insects (%)
Pesticide Use - Households using pesticides to kill weeds (%)
Physical Activity - People doing vigorous-intensity work activities (%)
Physical Activity - People doing moderate-intensity work activities (%)
Physical Activity - People walking or bicycling (%)
Physical Activity - People doing vigorous-intensity recreational activities (%)
Physical Activity - People doing moderate-intensity recreational activities (%)
Physical Activity - Average hours a day doing sedentary activities
Physical Activity - Average hours a day watching TV or videos
Physical Activity - Average hours a day using computer
Physical Functioning - People having limitations keeping them from working (%)
Physical Functioning - People limited in amount of work they can do (%)
Physical Functioning - People that need special equipment to walk (%)
Physical Functioning - People experiencing confusion/memory problems (%)
Physical Functioning - People requiring special healthcare equipment (%)
Prescription Medications - Average number of prescription medicines taking
Preventive Aspirin Use - Adults 40+ taking low-dose aspirin (%)
Reproductive Health - Vaginal deliveries (%)
Reproductive Health - Cesarean deliveries (%)
Reproductive Health - Deliveries resulted in a live birth (%)
Reproductive Health - Pregnancies resulted in a delivery (%)
Reproductive Health - Women breastfeeding newborns (%)
Reproductive Health - Women that had a hysterectomy (%)
Reproductive Health - Women that had both ovaries removed (%)
Reproductive Health - Women that have ever taken birth control pills (%)
Reproductive Health - Women taking birth control pills (%)
Reproductive Health - Women that have ever used Depo-Provera or injectables (%)
Reproductive Health - Women that have ever used female hormones (%)
Sexual Behavior - People 18+ that ever had sex (vaginal, anal, or oral) (%)
Sexual Behavior - Males 18+ that ever had vaginal sex with a woman (%)
Sexual Behavior - Males 18+ that ever performed oral sex on a woman (%)
Sexual Behavior - Males 18+ that ever had anal sex with a woman (%)
Sexual Behavior - Males 18+ that ever had any sex with a man (%)
Sexual Behavior - Females 18+ that ever had vaginal sex with a man (%)
Sexual Behavior - Females 18+ that ever performed oral sex on a man (%)
Sexual Behavior - Females 18+ that ever had anal sex with a man (%)
Sexual Behavior - Females 18+ that ever had any kind of sex with a woman (%)
Sexual Behavior - Average age people first had sex
Sexual Behavior - Average number of female sex partners in lifetime (males 18+)
Sexual Behavior - Average number of female vaginal sex partners in lifetime (males 18+)
Sexual Behavior - Average age people first performed oral sex on a woman (18+)
Sexual Behavior - Average number of woman performed oral sex on in lifetime (18+)
Sexual Behavior - Average number of male sex partners in lifetime (males 18+)
Sexual Behavior - Average number of male anal sex partners in lifetime (males 18+)
Sexual Behavior - Average age people first performed oral sex on a man (18+)
Sexual Behavior - Average number of male oral sex partners in lifetime (18+)
Sexual Behavior - People using protection when performing oral sex (%)
Sexual Behavior - Average number of times people have vaginal or anal sex a year
Sexual Behavior - People having sex without condom (%)
Sexual Behavior - Average number of male sex partners in lifetime (females 18+)
Sexual Behavior - Average number of male vaginal sex partners in lifetime (females 18+)
Sexual Behavior - Average number of female sex partners in lifetime (females 18+)
Sexual Behavior - Circumcised males 18+ (%)
Sleep Disorders - Average hours sleeping at night
Sleep Disorders - People that has trouble sleeping (%)
Smoking-Cigarette Use - People smoking cigarettes (%)
Taste & Smell - People 40+ having problems with smell (%)
Taste & Smell - People 40+ having problems with taste (%)
Taste & Smell - People 40+ that ever had wisdom teeth removed (%)
Taste & Smell - People 40+ that ever had tonsils teeth removed (%)
Taste & Smell - People 40+ that ever had a loss of consciousness because of a head injury (%)
Taste & Smell - People 40+ that ever had a broken nose or other serious injury to face or skull (%)
Taste & Smell - People 40+ that ever had two or more sinus infections (%)
Weight - Average height (inches)
Weight - Average weight (pounds)
Weight - Average BMI
Weight - People that are obese (%)
Weight - People that ever were obese (%)
Weight - People trying to lose weight (%)
According to our research of Michigan and other state lists, there were 30 registered sex offenders living in Flushing, Michigan as of June 15, 2024 . The ratio of all residents to sex offenders in Flushing is 268 to 1.The ratio of registered sex offenders to all residents in this city is near the state average.
Officers per 1,000 residents here:
0.79Michigan average:
1.86
Latest news from Flushing, MI collected exclusively by city-data.com from local newspapers, TV, and radio stations
Ancestries: American (18.6%), English (12.5%), German (9.5%), Irish (6.3%), Norwegian (3.3%), Scottish (3.1%).
Current Local Time:
Land area: 4.31 square miles.
Population density: 1,919 people per square mile (low).
87 residents are foreign born
This city:
1.1%Michigan:
6.9%
Median real estate property taxes paid for housing units with mortgages in 2022: $2,955 (1.4%)Median real estate property taxes paid for housing units with no mortgage in 2022: $2,440 (1.5%)
Nearest city with pop. 50,000+: Flint, MI
Nearest city with pop. 200,000+: Detroit, MI
Nearest city with pop. 1,000,000+: Chicago, IL
Nearest cities:
Latitude: 43.06 N, Longitude: 83.85 W
Daytime population change due to commuting: -1,473 (-17.8%)Workers who live and work in this city: 1,154 (30.4%)
Single-family new house construction building permits:
2022: 1 building , cost: $1,800,0002021: 5 buildings , average cost: $171,8002020: 1 building , cost: $143,1002019: 1 building , cost: $235,0002018: 1 building , cost: $235,0002017: 1 building , cost: $235,0002014: 2 buildings , average cost: $388,1002013: 1 building , cost: $148,9002007: 2 buildings , average cost: $138,1002006: 15 buildings , average cost: $158,7002005: 20 buildings , average cost: $158,7002004: 12 buildings , average cost: $175,6002003: 7 buildings , average cost: $178,5002002: 13 buildings , average cost: $152,9002001: 19 buildings , average cost: $193,9002000: 12 buildings , average cost: $179,3001999: 21 buildings , average cost: $161,6001998: 40 buildings , average cost: $123,2001997: 32 buildings , average cost: $122,700Unemployment in December 2023:
Most common occupations in Flushing, MI (%)
Both Males Females
Retail sales workers, except cashiers (5.3%)
Other management occupations, except farmers and farm managers (4.5%)
Preschool, kindergarten, elementary, and middle school teachers (4.3%)
Sales representatives, services, wholesale and manufacturing (3.6%)
Registered nurses (3.3%)
Driver/sales workers and truck drivers (3.2%)
Other office and administrative support workers, including supervisors (2.9%)
Driver/sales workers and truck drivers (6.1%)
Other management occupations, except farmers and farm managers (5.5%)
Retail sales workers, except cashiers (5.4%)
Electrical equipment mechanics and other installation, maintenance, and repair workers, including supervisors (5.1%)
Sales representatives, services, wholesale and manufacturing (4.2%)
Operations specialties managers, except financial managers (3.8%)
Other production occupations, including supervisors (3.8%)
Preschool, kindergarten, elementary, and middle school teachers (7.1%)
Registered nurses (6.6%)
Secretaries and administrative assistants (5.8%)
Other office and administrative support workers, including supervisors (5.5%)
Retail sales workers, except cashiers (5.1%)
Waiters and waitresses (4.0%)
Child care workers (4.0%)
Tornado activity:
Flushing-area historical tornado activity is above Michigan state average. It is 52% greater than the overall U.S. average.
On 6/8/1953, a category F5 (max. wind speeds 261-318 mph) tornado 2.5 miles away from the Flushing city center killed 116 people and injured 844 people and caused between $5,000,000 and $50,000,000 in damages.
On 5/12/1956, a category F4 (max. wind speeds 207-260 mph) tornado 9.5 miles away from the city center killed 3 people and injured 116 people and caused between $500,000 and $5,000,000 in damages.
Earthquake activity:
Flushing-area historical earthquake activity is significantly above Michigan state average. It is 49% smaller than the overall U.S. average. On 9/25/1998 at 19:52:52, a magnitude 5.2 (4.8 MB, 4.3 MS, 5.2 LG, 4.5 MW, Depth: 3.1 mi, Class: Moderate, Intensity: VI - VII) earthquake occurred 207.3 miles away from Flushing center On 1/31/1986 at 16:46:43, a magnitude 5.0 (5.0 MB) earthquake occurred 170.5 miles away from Flushing center On 5/2/2015 at 16:23:07, a magnitude 4.2 (4.2 MW, Depth: 2.8 mi, Class: Light, Intensity: IV - V) earthquake occurred 98.8 miles away from Flushing center On 7/12/1986 at 08:19:37, a magnitude 4.5 (4.5 MB) earthquake occurred 176.9 miles away from Flushing center On 7/27/1980 at 18:52:21, a magnitude 5.2 (5.1 MB, 4.7 MS, 5.0 UK, 5.2 UK) earthquake occurred 336.1 miles away from the city center On 4/18/2008 at 09:36:59, a magnitude 5.4 (5.1 MB, 4.8 MS, 5.4 MW, 5.2 MW) earthquake occurred 382.8 miles away from the city center Magnitude types: regional Lg-wave magnitude (LG), body-wave magnitude (MB), surface-wave magnitude (MS), moment magnitude (MW) Natural disasters: The number of natural disasters in Genesee County (13) is near the US average (15).Major Disasters (Presidential) Declared: 7Emergencies Declared: 5Storms: 7, Floods: 6, Tornadoes: 3, Winds: 2, Blizzard: 1, Hurricane: 1, Power Outage: 1, Snowstorm: 1, Winter Storm: 1, Other: 2 (Note: some incidents may be assigned to more than one category). Hospitals and medical centers in Flushing: HEARTLAND HEALTH CARE CENTER-FOSTRIAN (540 SUNNYSIDE DR)
FLUSHING DIALYSIS OF DAVITA (3469 PIERSON PLACE, STE A)
ACHIEVE HOME HEALTH CARE, L L C (G-5245 WEST PIERSON RD, STE - 1)
Amtrak stations near Flushing: 11 miles: FLINT (1407 S. DORT HWY.) Services: ticket office, partially wheelchair accessible, enclosed waiting area, public restrooms, public payphones, vending machines, free short-term parking, free long-term parking, call for car rental service, call for taxi service, public transit connection.
13 miles: DURAND (200 RAILROAD ST.) Services: enclosed waiting area, public restrooms, public payphones, free short-term parking, free long-term parking, taxi stand.
Colleges/universities with over 2000 students nearest to Flushing:
Kettering University (about 8 miles; Flint, MI ; Full-time enrollment: 2,044)
University of Michigan-Flint (about 9 miles; Flint, MI ; FT enrollment: 6,284)
Mott Community College (about 10 miles; Flint, MI ; FT enrollment: 7,394)
Baker College of Flint (about 10 miles; Flint, MI ; FT enrollment: 3,877)
Baker College Center for Graduate Studies (about 10 miles; Flint, MI ; FT enrollment: 3,405)
Baker College of Owosso (about 18 miles; Owosso, MI ; FT enrollment: 2,081)
Saginaw Valley State University (about 35 miles; University Center, MI ; FT enrollment: 9,021)
Public high schools in Flushing:
Public elementary/middle schools in Flushing:
Private elementary/middle school in Flushing: ST ROBERT BELLARMINE CATHOLIC SCHOOL Students: 264, Location: 214 E HENRY ST, Grades: PK-8)
See full list of schools located in Flushing
Notable locations in Flushing: (A) , Flushing Station (B) , Flushing City Hall (C) , Flushing Library (D) , Flushing Fire Department (E) , Flushing Police Department (F) , Flushing Area Museum (G) . Display/hide their locations on the map
Churches in Flushing include: (A) , Holy Cross Lutheran Church (B) , Trinity Episcopal Church (C) , Flushing Pointe Church of Christ (D) , Flushing United Methodist Church (E) , Community of Hope Church of God (F) , Flushing Presbyterian Church (G) , New Life Assembly of God Church (H) , Saint Robert Catholic Church (I) . Display/hide their locations on the map
Cemetery: (1) . Display/hide its location on the map
Creek: (A) . Display/hide its location on the map
Parks in Flushing include: (1) , Amos Woodruff House Historical Marker (2) , First Methodist Episcopal Church Historical Marker (3) , Harrison Homestead Historical Marker (4) , Eastview Park (5) , River Road Park (6) , Mutton Park (7) . Display/hide their locations on the map
Tourist attractions:
Birthplace of: Amanda Somerville - Singer-songwriter, John J. Gleason - Politician, Shawn Cronin - Ice hockey player.
Genesee County has a predicted average indoor radon screening level between 2 and 4 pCi/L (pico curies per liter) - Moderate Potential Drinking water stations with addresses in Flushing and their reported violations in the past:
FLUSHING, CITY OF (Population served: 7,815, Purch surface water):
Past health violations:
MCL, Monthly (TCR) - In AUG-2010, Contaminant: Coliform. Follow-up actions: St Public Notif requested (AUG-18-2010), St Violation/Reminder Notice (AUG-18-2010), St Public Notif received (AUG-30-2010), St Compliance achieved (SEP-30-2010)
Population served: 2,100, Groundwater):
Past monitoring violations:
2 routine major monitoring violations
Population served: 50, Groundwater):
Past monitoring violations:
2 routine major monitoring violations
7 regular monitoring violations
Population served: 30, Groundwater):
Past health violations:
MCL, Monthly (TCR) - In OCT-2006, Contaminant: Coliform. Follow-up actions: St Violation/Reminder Notice (OCT-06-2006), St Compliance achieved (NOV-06-2006)
Past monitoring violations:
6 routine major monitoring violations
6 regular monitoring violations
Population served: 25, Groundwater):
Past monitoring violations:
One regular monitoring violation
Address: 3476 Eastman Dr. Population served: 25, Groundwater):
Past monitoring violations:
3 routine major monitoring violations
3 regular monitoring violations
Population served: 25, Groundwater):
Past monitoring violations:
2 routine major monitoring violations
2 regular monitoring violations
Population served: 25, Groundwater):
Past monitoring violations:
One routine major monitoring violation
2 regular monitoring violations
Drinking water stations with addresses in Flushing that have no violations reported:
MIDWAY TAVERN (Population served: 50, Primary Water Source Type: Groundwater)
Average household size: This city:
2.3 peopleMichigan:
2.5 people
Percentage of family households: This city:
64.5%Whole state:
66.0%
Percentage of households with unmarried partners: This city:
4.1%Whole state:
6.4%
Likely homosexual households (counted as self-reported same-sex unmarried-partner households)
Lesbian couples: 0.4% of all households Gay men: 0.2% of all households
People in group quarters in Flushing in 2010:
108 people in nursing facilities/skilled-nursing facilities
29 people in college/university student housing
21 people in group homes intended for adults
People in group quarters in Flushing in 2000:
146 people in nursing homes
25 people in other noninstitutional group quarters
6 people in homes for the mentally retarded
4 people in other group homes
2 people in religious group quarters
Banks with branches in Flushing (2011 data):
JPMorgan Chase Bank, National Association: Flushing Point Branch at 6481 Pierson Road, branch established on 1966/02/23; Flushing Branch at 124 South Cherry Street, branch established on 1959/01/02. Info updated 2011/11/10: Bank assets: $1,811,678.0 mil, Deposits: $1,190,738.0 mil, headquarters in Columbus, OH, positive income , International Specialization, 5577 total offices , Holding Company: Jpmorgan Chase & Co.
PNC Bank, National Association: Flushing Branch at 5290 West Pierson Road, branch established on 2006/01/19. Info updated 2012/03/20: Bank assets: $263,309.6 mil, Deposits: $197,343.0 mil, headquarters in Wilmington, DE, positive income , Commercial Lending Specialization, 3085 total offices , Holding Company: Pnc Financial Services Group, Inc., The
Fifth Third Bank: Flushing Branch at G6530 West Pierson Road, branch established on 1980/05/21. Info updated 2009/10/05: Bank assets: $114,540.4 mil, Deposits: $89,689.1 mil, headquarters in Cincinnati, OH, positive income , Commercial Lending Specialization, 1378 total offices , Holding Company: Fifth Third Bancorp
First Place Bank: Flushing Branch at 220 East Main Street, branch established on 1888/01/01. Info updated 2011/07/21: Bank assets: $2,754.5 mil, Deposits: $2,219.6 mil, headquarters in Warren, OH, negative income in the last year , Commercial Lending Specialization, 43 total offices
Citizens Bank: Pierson Road Branch at G-6452 W. Pierson Road, branch established on 1974/11/20. Info updated 2011/08/01: Bank assets: $9,212.3 mil, Deposits: $7,452.0 mil, headquarters in Flint, MI, positive income , Commercial Lending Specialization, 220 total offices , Holding Company: Citizens Republic Bancorp, Inc.
For population 15 years and over in Flushing:
Never married: 30.2%Now married: 49.8%Separated: 0.8%Widowed: 6.1%Divorced: 13.1% For population 25 years and over in Flushing:
High school or higher: 95.2%Bachelor's degree or higher: 30.2%Graduate or professional degree: 13.1%Unemployed: 2.6%Mean travel time to work (commute): 20.0 minutes
Education Gini index (Inequality in education) Here:
8.6Michigan average:
11.0
Religion statistics for Flushing, MI (based on Genesee County data)
Religion Adherents Congregations Evangelical Protestant 59,625 248 Catholic 45,566 25 Mainline Protestant 22,575 82 Black Protestant 20,768 60 Other 17,837 37 Orthodox 1,392 4 None 258,027 -
Source: Clifford Grammich, Kirk Hadaway, Richard Houseal, Dale E.Jones, Alexei Krindatch, Richie Stanley and Richard H.Taylor. 2012. 2010 U.S.Religion Census: Religious Congregations & Membership Study. Association of Statisticians of American Religious Bodies. Jones, Dale E., et al. 2002. Congregations and Membership in the United States 2000. Nashville, TN: Glenmary Research Center. Graphs represent county-level data
Food Environment Statistics: Number of grocery stores : 109This county :
2.51 / 10,000 pop.Michigan :
2.34 / 10,000 pop.
Number of supercenters and club stores : 5Genesee County :
0.12 / 10,000 pop.Michigan :
0.18 / 10,000 pop.
Number of convenience stores (no gas) : 86This county :
1.98 / 10,000 pop.Michigan :
1.52 / 10,000 pop.
Number of convenience stores (with gas) : 132Genesee County :
3.04 / 10,000 pop.Michigan :
2.99 / 10,000 pop.
Number of full-service restaurants : 246Genesee County :
5.67 / 10,000 pop.Michigan :
6.80 / 10,000 pop.
Low-income preschool obesity rate : This county :
12.5%Michigan :
13.4%
Health and Nutrition: Healthy diet rate : Flushing:
54.8%State:
50.3%
Average overall health of teeth and gums : Flushing:
53.8%Michigan:
47.9%
Average BMI : Flushing:
28.8Michigan:
28.7
People feeling badly about themselves : This city:
19.5%Michigan:
20.6%
People not drinking alcohol at all : This city:
10.6%Michigan:
10.4%
Average hours sleeping at night : This city:
6.9Michigan:
6.8
Overweight people : Flushing:
37.5%State:
34.1%
General health condition : This city:
59.7%Michigan:
57.0%
Average condition of hearing : Flushing:
78.2%Michigan:
79.6%
More about Health and Nutrition of Flushing, MI Residents
Local government employment and payroll (March 2022)
Function
Full-time employees
Monthly full-time payroll
Average yearly full-time wage
Part-time employees
Monthly part-time payroll
Police Protection - Officers
9 $53,829 $71,772 6 $5,839 Streets and Highways
5 $31,266 $75,038 0 $0 Other Government Administration
4 $24,085 $72,255 13 $867 Sewerage
3 $15,841 $63,364 0 $0 Other and Unallocable
2 $13,202 $79,212 0 $0 Police - Other
1 $4,068 $48,816 4 $1,311 Water Supply
1 $5,879 $70,548 0 $0 Firefighters
0 $0 20 $11,885
Totals for Government
25 $148,169 $71,121 43 $19,902
Flushing government finances - Expenditure in 2017 (per resident):
Current Operations - Sewerage: $2,710,000 ($327.61)
Police Protection: $1,564,000 ($189.07)General - Other: $660,000 ($79.79)Regular Highways: $644,000 ($77.85)Solid Waste Management: $606,000 ($73.26)Financial Administration: $263,000 ($31.79)Local Fire Protection: $161,000 ($19.46)Central Staff Services: $128,000 ($15.47)Parks and Recreation: $103,000 ($12.45)Judicial and Legal Services: $50,000 ($6.04)General Public Buildings: $40,000 ($4.84)Libraries: $17,000 ($2.06)Correctional Institutions: $1,000 ($0.12)General - Interest on Debt: $15,000 ($1.81)
Other Capital Outlay - Parks and Recreation: $93,000 ($11.24)
Local Fire Protection: $49,000 ($5.92)General - Other: $15,000 ($1.81)Police Protection: $4,000 ($0.48)Total Salaries and Wages: $1,790,000 ($216.39)
Water Utilities - Interest on Debt: $30,000 ($3.63)
Flushing government finances - Revenue in 2017 (per resident):
Charges - Sewerage: $1,294,000 ($156.43)
Other: $1,044,000 ($126.21)Parks and Recreation: $7,000 ($0.85)Federal Intergovernmental - Other: $22,000 ($2.66)
Local Intergovernmental - Other: $2,000 ($0.24)
Miscellaneous - General Revenue - Other: $335,000 ($40.50)
Donations From Private Sources: $22,000 ($2.66)Sale of Property: $15,000 ($1.81)Fines and Forfeits: $6,000 ($0.73)Revenue - Water Utilities: $2,175,000 ($262.94)
State Intergovernmental - General Local Government Support: $1,438,000 ($173.84)
Tax - Property: $2,431,000 ($293.88)
Other License: $1,000 ($0.12)
Flushing government finances - Debt in 2017 (per resident):
Long Term Debt - Beginning Outstanding - Unspecified Public Purpose: $1,740,000 ($210.35)
Outstanding Unspecified Public Purpose: $1,444,000 ($174.56)Retired Unspecified Public Purpose: $296,000 ($35.78)
Flushing government finances - Cash and Securities in 2017 (per resident):
Other Funds - Cash and Securities: $3,541,000 ($428.07)
Businesses in Flushing, MI
Name Count Name Count
ALDI 1 Little Caesars Pizza 1 Advance Auto Parts 1 MasterBrand Cabinets 4 AutoZone 1 McDonald's 1 Decora Cabinetry 1 Rite Aid 2 FedEx 2 SAS Shoes 1 Ford 1 Subway 2 GNC 2 UPS 4 H&R Block 1 Walgreens 1 Home Depot 1 Wendy's 1 Kroger 1 YMCA 1
Strongest AM radio stations in Flushing:
WOAP (1080 AM; 50 kW; OWOSSO, MI)
WTRX (1330 AM; 5 kW; FLINT, MI; Owner: CITADEL BROADCASTING COMPANY)
WFNT (1470 AM; 5 kW; FLINT, MI)
WWJ (950 AM; 50 kW; DETROIT, MI; Owner: INFINITY BROADCASTING OPERATIONS, INC.)
WXYT (1270 AM; 50 kW; DETROIT, MI; Owner: INFINITY BROADCASTING CORP. OF DETROIT)
WJR (760 AM; 50 kW; DETROIT, MI; Owner: ABC, INC.)
WFDF (910 AM; 50 kW; FLINT, MI; Owner: ABC, INC.)
WCHB (1200 AM; 50 kW; TAYLOR, MI; Owner: RADIO ONE OF DETROIT, LLC)
WDFN (1130 AM; 50 kW; DETROIT, MI; Owner: AMFM RADIO LICENSES, L.L.C.)
WSGW (790 AM; 5 kW; SAGINAW, MI; Owner: NM LICENSING LLC)
WSNL (600 AM; 1 kW; FLINT, MI)
WKAR (870 AM; daytime; 10 kW; EAST LANSING, MI; Owner: MICHIGAN STATE UNIVERSITY)
WWCK (1570 AM; 1 kW; FLINT, MI; Owner: CUMULUS LICENSING CORP.)
Strongest FM radio stations in Flushing:
WFBE (95.1 FM; FLINT, MI; Owner: CITADEL BROADCASTING COMPANY)
WWCK-FM (105.5 FM; FLINT, MI; Owner: CUMULUS LICENSING CORP.)
WHNN (96.1 FM; BAY CITY, MI; Owner: CITADEL BROADCASTING COMPANY)
WDZZ-FM (92.7 FM; FLINT, MI; Owner: CUMULUS LICENSING CORP.)
WRSR (103.9 FM; OWOSSO, MI; Owner: CUMULUS LICENSING CORP.)
WAKL (88.9 FM; FLINT, MI; Owner: EDUCATIONAL MEDIA FOUNDATION)
WTAC (89.7 FM; BURTON, MI; Owner: SUPERIOR COMMUNICATIONS)
WIOG (102.5 FM; BAY CITY, MI; Owner: CITADEL BROADCASTING COMPANY)
WCRZ (107.9 FM; FLINT, MI; Owner: REGENT BROADCASTING OF FLINT, INC.)
WWBN (101.5 FM; TUSCOLA, MI; Owner: REGENT BROADCASTING OF FLINT, INC.)
WFUM-FM (91.1 FM; FLINT, MI; Owner: THE REGENTS OF THE UNIV. OF MICHIGAN)
WKAR-FM (90.5 FM; EAST LANSING, MI; Owner: MICHIGAN STATE UNIVERSITY)
WKCQ (98.1 FM; SAGINAW, MI; Owner: THE MACDONALD BROADCASTING COMPANY)
WRCL (93.7 FM; FRANKENMUTH, MI; Owner: REGENT BROADCASTING OF FLINT, INC.)
WTLZ (107.1 FM; SAGINAW, MI; Owner: NM LICENSING LLC)
WILZ (104.5 FM; SAGINAW, MI; Owner: CITADEL BROADCASTING COMPANY)
WOWE (98.9 FM; VASSAR, MI; Owner: PRAESTANTIA BROADCASTING, INC.)
TV broadcast stations around Flushing:
WEYI-TV (Channel 25; SAGINAW, MI; Owner: WEYI BROADCASTING, LLC)
W09CK (Channel 9; FLINT, MI; Owner: P & P CABLE HOLDINGS, L.L.C.)
WSMH (Channel 66; FLINT, MI; Owner: WSMH LICENSEE, LLC)
WAQP (Channel 49; SAGINAW, MI; Owner: TCT OF MICHIGAN, INC.)
WJRT-TV (Channel 12; FLINT, MI; Owner: FLINT LICENSE SUBSIDIARY CORP.)
WNEM-TV (Channel 5; BAY CITY, MI; Owner: MEREDITH CORPORATION)
WFUM (Channel 28; FLINT, MI; Owner: UNIVERSITY OF MICHIGAN)
W52CU (Channel 52; PINCONNING, MI; Owner: NTN/SAGINAW, INC.)
WXON-LP (Channel 54; FLINT, MI; Owner: P & P CABLE HOLDINGS, L.L.C.)
WLNS-TV (Channel 6; LANSING, MI; Owner: YOUNG BROADCASTING OF LANSING, INC.)
WKAR-TV (Channel 23; EAST LANSING, MI; Owner: BOARD OF TRUSTEES, MICH. STATE UNIV.)
W22CC (Channel 22; PINCONNING, MI; Owner: P & P CABLE HOLDINGS, L.L.C.)
W69DW (Channel 69; PINCONNING, MI; Owner: NTN/SAGINAW, INC.)
W68DH (Channel 68; PETOSKEY, MI; Owner: MS COMMUNICATIONS, LLC)
National Bridge Inventory (NBI) Statistics 9 Number of bridges98ft / 30.0m Total length $1,361,000 Total costs47,147 Total average daily traffic2,175 Total average daily truck traffic85,269 Total future (year 2017) average daily traffic
FCC Registered Antenna Towers: 21 (
See the full list of FCC Registered Antenna Towers in Flushing )
FCC Registered Broadcast Land Mobile Towers: 10 (
See the full list of FCC Registered Broadcast Land Mobile Towers in Flushing, MI )
FCC Registered Microwave Towers: 3
FLUSHING, 200 Industrial Dr. (Mi14305-A) (Lat: 43.069278 Lon: -83.864583), Type: Ltower, Structure height: 91.4 m, Overall height: 94.5 m, Call Sign: WQAV259, Assigned Frequencies: 6805.00 MHz, Grant Date: 05/24/2014, Expiration Date: 08/12/2024, Certifier: Lloyd R Fayling, Registrant: Genesee County 911, 4481 Corunna Rd, Flint, MI 48473, Phone: (810) 732-4722, Fax: (810) 732-7986, Email:
FLUSHING, Lat: 43.082278 Lon: -83.815556, Call Sign: WQHK815, Assigned Frequencies: 952.256 MHz, Grant Date: 08/17/2017, Expiration Date: 08/24/2027, Certifier: Tim Davidek, Registrant: Sensus, 450 N Gallatin Ave, Uniontown, PA 15401, Phone: (800) 638-3748, Fax: (800) 888-2403, Email:
Flushing MI, 180 Industrial Drive (Lat: 43.068694 Lon: -83.864611), Type: Pole, Structure height: 56.7 m, Overall height: 59.1 m, Call Sign: WQIU220, Assigned Frequencies: 11245.0 MHz, 6226.89 MHz, Grant Date: 05/13/2008, Expiration Date: 05/13/2018, Cancellation Date: 11/13/2009, Certifier: William Chastain, Registrant: Radio Dynamics Corporation, Silver Spring, MD 20914, Phone: (301) 493-5171, Fax: (301) 576-4553, Email:
FCC Registered Amateur Radio Licenses: 141 (
See the full list of FCC Registered Amateur Radio Licenses in Flushing )
FAA Registered Aircraft Manufacturers and Dealers: 2 (
See the full list of FAA Registered Manufacturers and Dealers in Flushing )
FAA Registered Aircraft: 38 (
See the full list of FAA Registered Aircraft )
Home Mortgage Disclosure Act Aggregated Statistics For Year 2009(Based on 2 full tracts) A) FHA, FSA/RHS & VA B) Conventional C) Refinancings D) Home Improvement Loans F) Non-occupant Loans on G) Loans On Manufactured Number Average Value Number Average Value Number Average Value Number Average Value Number Average Value Number Average Value
LOANS ORIGINATED 67 $87,955 17 $82,941 122 $97,779 12 $11,167 8 $62,875 1 $21,000 APPLICATIONS APPROVED, NOT ACCEPTED 1 $89,000 2 $52,500 19 $99,895 2 $11,000 1 $120,000 0 $0 APPLICATIONS DENIED 9 $80,333 7 $90,143 34 $117,735 6 $32,333 1 $88,000 0 $0 APPLICATIONS WITHDRAWN 16 $84,812 0 $0 30 $119,100 3 $22,667 0 $0 0 $0 FILES CLOSED FOR INCOMPLETENESS 1 $52,000 0 $0 3 $100,000 0 $0 0 $0 0 $0
Aggregated Statistics For Year 2008(Based on 2 full tracts) A) FHA, FSA/RHS & VA B) Conventional C) Refinancings D) Home Improvement Loans E) Loans on Dwellings For 5+ Families F) Non-occupant Loans on G) Loans On Manufactured Number Average Value Number Average Value Number Average Value Number Average Value Number Average Value Number Average Value Number Average Value
LOANS ORIGINATED 36 $103,806 33 $91,909 82 $112,659 9 $13,444 1 $221,000 8 $49,000 0 $0 APPLICATIONS APPROVED, NOT ACCEPTED 2 $91,500 1 $90,000 10 $116,500 2 $18,500 0 $0 0 $0 1 $21,000 APPLICATIONS DENIED 4 $112,000 10 $137,300 44 $127,159 15 $54,933 1 $221,000 3 $99,667 0 $0 APPLICATIONS WITHDRAWN 5 $86,800 3 $93,333 14 $136,571 0 $0 0 $0 1 $45,000 0 $0 FILES CLOSED FOR INCOMPLETENESS 1 $74,000 2 $127,000 5 $138,000 0 $0 0 $0 0 $0 0 $0
Aggregated Statistics For Year 2007(Based on 2 full tracts) A) FHA, FSA/RHS & VA B) Conventional C) Refinancings D) Home Improvement Loans E) Loans on Dwellings For 5+ Families F) Non-occupant Loans on G) Loans On Manufactured Number Average Value Number Average Value Number Average Value Number Average Value Number Average Value Number Average Value Number Average Value
LOANS ORIGINATED 12 $131,667 91 $108,495 129 $99,395 22 $24,000 1 $2,750,000 13 $80,231 2 $19,500 APPLICATIONS APPROVED, NOT ACCEPTED 1 $141,000 12 $103,250 26 $100,692 6 $68,167 0 $0 5 $55,400 1 $40,000 APPLICATIONS DENIED 4 $141,000 22 $111,955 93 $125,527 17 $58,235 0 $0 11 $110,545 1 $14,000 APPLICATIONS WITHDRAWN 5 $113,800 7 $117,000 28 $122,821 3 $15,333 0 $0 2 $19,500 0 $0 FILES CLOSED FOR INCOMPLETENESS 0 $0 2 $109,000 8 $177,125 2 $115,000 0 $0 1 $305,000 0 $0
Aggregated Statistics For Year 2006(Based on 2 full tracts) A) FHA, FSA/RHS & VA B) Conventional C) Refinancings D) Home Improvement Loans F) Non-occupant Loans on G) Loans On Manufactured Number Average Value Number Average Value Number Average Value Number Average Value Number Average Value Number Average Value
LOANS ORIGINATED 22 $121,591 120 $103,983 189 $92,593 44 $31,295 17 $90,059 2 $19,000 APPLICATIONS APPROVED, NOT ACCEPTED 2 $156,500 14 $100,714 39 $116,564 6 $43,833 0 $0 1 $18,000 APPLICATIONS DENIED 3 $118,667 39 $100,897 117 $109,547 20 $46,550 2 $51,500 6 $25,667 APPLICATIONS WITHDRAWN 1 $106,000 9 $140,556 72 $128,139 3 $58,333 2 $110,500 0 $0 FILES CLOSED FOR INCOMPLETENESS 1 $124,000 8 $128,500 25 $140,880 0 $0 1 $122,000 0 $0
Aggregated Statistics For Year 2005(Based on 2 full tracts) A) FHA, FSA/RHS & VA B) Conventional C) Refinancings D) Home Improvement Loans F) Non-occupant Loans on G) Loans On Manufactured Number Average Value Number Average Value Number Average Value Number Average Value Number Average Value Number Average Value
LOANS ORIGINATED 10 $136,200 166 $105,048 202 $113,743 39 $32,000 21 $115,810 2 $111,000 APPLICATIONS APPROVED, NOT ACCEPTED 3 $140,000 33 $91,485 35 $128,971 3 $57,667 2 $94,000 1 $21,000 APPLICATIONS DENIED 3 $88,667 42 $107,881 126 $134,802 31 $41,419 11 $121,091 4 $18,750 APPLICATIONS WITHDRAWN 1 $111,000 40 $100,525 87 $140,276 2 $15,000 4 $151,750 0 $0 FILES CLOSED FOR INCOMPLETENESS 0 $0 11 $88,182 42 $139,429 3 $27,667 0 $0 1 $18,000
Aggregated Statistics For Year 2004(Based on 2 full tracts) A) FHA, FSA/RHS & VA B) Conventional C) Refinancings D) Home Improvement Loans E) Loans on Dwellings For 5+ Families F) Non-occupant Loans on G) Loans On Manufactured Number Average Value Number Average Value Number Average Value Number Average Value Number Average Value Number Average Value Number Average Value
LOANS ORIGINATED 13 $125,385 166 $119,982 282 $114,262 42 $45,929 1 $750,000 18 $101,278 4 $49,750 APPLICATIONS APPROVED, NOT ACCEPTED 5 $92,800 21 $117,952 44 $130,250 6 $7,833 0 $0 4 $148,750 2 $26,500 APPLICATIONS DENIED 3 $126,000 39 $109,077 126 $128,302 16 $12,250 0 $0 7 $115,286 5 $48,600 APPLICATIONS WITHDRAWN 4 $89,500 14 $140,643 65 $135,077 4 $61,250 0 $0 3 $96,000 0 $0 FILES CLOSED FOR INCOMPLETENESS 0 $0 7 $111,571 35 $135,000 3 $56,000 0 $0 0 $0 0 $0
Aggregated Statistics For Year 2003(Based on 2 full tracts) A) FHA, FSA/RHS & VA B) Conventional C) Refinancings D) Home Improvement Loans F) Non-occupant Loans on Number Average Value Number Average Value Number Average Value Number Average Value Number Average Value
LOANS ORIGINATED 19 $123,368 152 $113,237 727 $109,763 31 $26,452 31 $87,710 APPLICATIONS APPROVED, NOT ACCEPTED 1 $121,000 10 $99,400 66 $114,636 9 $25,222 6 $92,167 APPLICATIONS DENIED 2 $131,500 21 $88,143 166 $106,343 12 $25,250 9 $95,111 APPLICATIONS WITHDRAWN 3 $98,333 12 $139,000 92 $126,630 3 $38,667 6 $98,167 FILES CLOSED FOR INCOMPLETENESS 1 $145,000 3 $132,000 29 $117,103 1 $14,000 4 $87,250
Aggregated Statistics For Year 2002(Based on 2 full tracts) A) FHA, FSA/RHS & VA B) Conventional C) Refinancings D) Home Improvement Loans E) Loans on Dwellings For 5+ Families F) Non-occupant Loans on Number Average Value Number Average Value Number Average Value Number Average Value Number Average Value Number Average Value
LOANS ORIGINATED 24 $115,792 170 $117,206 533 $111,782 36 $19,278 2 $86,500 30 $91,033 APPLICATIONS APPROVED, NOT ACCEPTED 3 $108,000 9 $110,000 35 $100,371 5 $22,400 0 $0 0 $0 APPLICATIONS DENIED 0 $0 17 $92,412 79 $106,443 14 $23,857 0 $0 6 $58,833 APPLICATIONS WITHDRAWN 2 $124,000 5 $111,000 76 $102,737 2 $33,000 0 $0 3 $105,333 FILES CLOSED FOR INCOMPLETENESS 0 $0 1 $72,000 21 $83,095 1 $20,000 0 $0 1 $75,000
Aggregated Statistics For Year 2001(Based on 2 full tracts) A) FHA, FSA/RHS & VA B) Conventional C) Refinancings D) Home Improvement Loans E) Loans on Dwellings For 5+ Families F) Non-occupant Loans on Number Average Value Number Average Value Number Average Value Number Average Value Number Average Value Number Average Value
LOANS ORIGINATED 31 $113,742 130 $111,138 432 $105,113 37 $13,595 0 $0 13 $77,769 APPLICATIONS APPROVED, NOT ACCEPTED 2 $103,000 12 $80,917 49 $83,571 10 $18,700 0 $0 1 $6,000 APPLICATIONS DENIED 1 $63,000 20 $71,000 81 $97,210 12 $15,833 0 $0 2 $21,500 APPLICATIONS WITHDRAWN 1 $73,000 8 $106,625 60 $96,250 4 $19,750 1 $76,000 0 $0 FILES CLOSED FOR INCOMPLETENESS 0 $0 2 $224,000 16 $130,875 0 $0 0 $0 0 $0
Aggregated Statistics For Year 2000(Based on 2 full tracts) A) FHA, FSA/RHS & VA B) Conventional C) Refinancings D) Home Improvement Loans F) Non-occupant Loans on Number Average Value Number Average Value Number Average Value Number Average Value Number Average Value
LOANS ORIGINATED 12 $101,500 155 $105,174 145 $88,628 37 $13,568 7 $88,571 APPLICATIONS APPROVED, NOT ACCEPTED 2 $90,500 11 $91,364 33 $79,667 10 $30,100 1 $18,000 APPLICATIONS DENIED 0 $0 38 $59,763 61 $91,557 13 $22,615 3 $77,000 APPLICATIONS WITHDRAWN 3 $114,333 11 $87,727 36 $95,639 5 $50,200 2 $45,500 FILES CLOSED FOR INCOMPLETENESS 0 $0 2 $79,500 17 $96,529 1 $20,000 0 $0
Aggregated Statistics For Year 1999(Based on 2 full tracts) A) FHA, FSA/RHS & VA B) Conventional C) Refinancings D) Home Improvement Loans E) Loans on Dwellings For 5+ Families F) Non-occupant Loans on Number Average Value Number Average Value Number Average Value Number Average Value Number Average Value Number Average Value
LOANS ORIGINATED 26 $95,323 167 $106,244 234 $116,254 68 $19,102 1 $1,994,000 13 $85,730 APPLICATIONS APPROVED, NOT ACCEPTED 0 $0 31 $79,531 38 $81,591 13 $14,263 0 $0 2 $28,915 APPLICATIONS DENIED 1 $130,610 37 $67,685 56 $101,806 10 $24,822 0 $0 4 $90,478 APPLICATIONS WITHDRAWN 0 $0 26 $89,688 36 $90,554 10 $43,868 0 $0 1 $70,770 FILES CLOSED FOR INCOMPLETENESS 0 $0 2 $133,100 14 $109,934 1 $29,910 0 $0 0 $0
Detailed HMDA statistics for the following Tracts:
0106.03
, 0106.04
Private Mortgage Insurance Companies Aggregated Statistics For Year 2009(Based on 2 full tracts) A) Conventional B) Refinancings Number Average Value Number Average Value
LOANS ORIGINATED 2 $55,000 0 $0 APPLICATIONS APPROVED, NOT ACCEPTED 0 $0 1 $124,000 APPLICATIONS DENIED 0 $0 0 $0 APPLICATIONS WITHDRAWN 0 $0 4 $100,000 FILES CLOSED FOR INCOMPLETENESS 0 $0 0 $0
Aggregated Statistics For Year 2008(Based on 2 full tracts) A) Conventional B) Refinancings Number Average Value Number Average Value
LOANS ORIGINATED 13 $116,385 8 $126,875 APPLICATIONS APPROVED, NOT ACCEPTED 4 $132,500 5 $132,800 APPLICATIONS DENIED 2 $97,500 0 $0 APPLICATIONS WITHDRAWN 1 $141,000 0 $0 FILES CLOSED FOR INCOMPLETENESS 0 $0 0 $0
Aggregated Statistics For Year 2007(Based on 2 full tracts) A) Conventional B) Refinancings Number Average Value Number Average Value
LOANS ORIGINATED 32 $136,875 19 $139,316 APPLICATIONS APPROVED, NOT ACCEPTED 3 $109,000 8 $134,000 APPLICATIONS DENIED 0 $0 1 $126,000 APPLICATIONS WITHDRAWN 1 $144,000 2 $211,000 FILES CLOSED FOR INCOMPLETENESS 0 $0 0 $0
Aggregated Statistics For Year 2006(Based on 2 full tracts) A) Conventional B) Refinancings C) Non-occupant Loans on Number Average Value Number Average Value Number Average Value
LOANS ORIGINATED 18 $132,778 9 $142,778 1 $98,000 APPLICATIONS APPROVED, NOT ACCEPTED 5 $147,000 4 $206,750 0 $0 APPLICATIONS DENIED 0 $0 0 $0 0 $0 APPLICATIONS WITHDRAWN 0 $0 0 $0 0 $0 FILES CLOSED FOR INCOMPLETENESS 0 $0 0 $0 0 $0
Aggregated Statistics For Year 2005(Based on 2 full tracts) A) Conventional B) Refinancings C) Non-occupant Loans on Number Average Value Number Average Value Number Average Value
LOANS ORIGINATED 20 $151,100 19 $142,579 3 $129,000 APPLICATIONS APPROVED, NOT ACCEPTED 4 $124,750 1 $140,000 0 $0 APPLICATIONS DENIED 0 $0 1 $145,000 0 $0 APPLICATIONS WITHDRAWN 1 $181,000 1 $113,000 0 $0 FILES CLOSED FOR INCOMPLETENESS 0 $0 0 $0 0 $0
Aggregated Statistics For Year 2004(Based on 2 full tracts) A) Conventional B) Refinancings C) Non-occupant Loans on Number Average Value Number Average Value Number Average Value
LOANS ORIGINATED 32 $128,875 25 $136,560 3 $101,667 APPLICATIONS APPROVED, NOT ACCEPTED 3 $199,333 4 $123,750 0 $0 APPLICATIONS DENIED 0 $0 0 $0 0 $0 APPLICATIONS WITHDRAWN 4 $103,250 1 $140,000 2 $105,000 FILES CLOSED FOR INCOMPLETENESS 0 $0 1 $102,000 0 $0
Aggregated Statistics For Year 2003(Based on 2 full tracts) A) Conventional B) Refinancings C) Non-occupant Loans on Number Average Value Number Average Value Number Average Value
LOANS ORIGINATED 38 $129,132 74 $140,446 6 $96,333 APPLICATIONS APPROVED, NOT ACCEPTED 5 $151,600 17 $138,294 0 $0 APPLICATIONS DENIED 0 $0 1 $117,000 0 $0 APPLICATIONS WITHDRAWN 1 $82,000 7 $168,429 0 $0 FILES CLOSED FOR INCOMPLETENESS 0 $0 1 $133,000 0 $0
Aggregated Statistics For Year 2002(Based on 2 full tracts) A) Conventional B) Refinancings C) Non-occupant Loans on Number Average Value Number Average Value Number Average Value
LOANS ORIGINATED 55 $127,673 55 $133,909 8 $124,250 APPLICATIONS APPROVED, NOT ACCEPTED 6 $126,833 11 $139,636 0 $0 APPLICATIONS DENIED 0 $0 0 $0 0 $0 APPLICATIONS WITHDRAWN 1 $94,000 2 $167,000 0 $0 FILES CLOSED FOR INCOMPLETENESS 0 $0 0 $0 0 $0
Aggregated Statistics For Year 2001(Based on 2 full tracts) A) Conventional B) Refinancings C) Non-occupant Loans on Number Average Value Number Average Value Number Average Value
LOANS ORIGINATED 30 $123,967 42 $121,762 1 $90,000 APPLICATIONS APPROVED, NOT ACCEPTED 6 $155,333 10 $164,200 1 $109,000 APPLICATIONS DENIED 0 $0 4 $160,000 3 $140,000 APPLICATIONS WITHDRAWN 0 $0 0 $0 0 $0 FILES CLOSED FOR INCOMPLETENESS 0 $0 0 $0 0 $0
Aggregated Statistics For Year 2000(Based on 2 full tracts) A) Conventional B) Refinancings C) Non-occupant Loans on Number Average Value Number Average Value Number Average Value
LOANS ORIGINATED 52 $112,827 8 $111,000 1 $110,000 APPLICATIONS APPROVED, NOT ACCEPTED 2 $242,500 0 $0 0 $0 APPLICATIONS DENIED 1 $151,000 4 $141,250 0 $0 APPLICATIONS WITHDRAWN 1 $202,000 0 $0 0 $0 FILES CLOSED FOR INCOMPLETENESS 0 $0 0 $0 0 $0
Aggregated Statistics For Year 1999(Based on 2 full tracts) A) Conventional B) Refinancings C) Non-occupant Loans on Number Average Value Number Average Value Number Average Value
LOANS ORIGINATED 56 $113,541 20 $117,730 1 $69,790 APPLICATIONS APPROVED, NOT ACCEPTED 5 $129,410 3 $89,067 1 $71,780 APPLICATIONS DENIED 6 $129,112 1 $112,660 0 $0 APPLICATIONS WITHDRAWN 0 $0 0 $0 0 $0 FILES CLOSED FOR INCOMPLETENESS 1 $75,770 0 $0 0 $0
Detailed PMIC statistics for the following Tracts:
0106.03
, 0106.04
Most common first names in Flushing, MI among deceased individuals Name Count Lived (average)
Mary 161 80.7 years William 146 74.6 years John 134 75.8 years Robert 112 71.2 years James 90 70.3 years Helen 82 80.3 years George 73 77.4 years Margaret 69 80.1 years Charles 63 76.3 years Edward 61 75.4 years
Most common last names in Flushing, MI among deceased individuals Last name Count Lived (average)
Smith 64 76.9 years Johnson 35 78.1 years Miller 31 75.2 years Jones 29 80.7 years Martin 28 72.6 years Davis 26 73.0 years Wilson 24 80.1 years Brown 24 72.0 years Anderson 22 80.7 years Clark 20 73.2 years
Flushing compared to Michigan state average:
Unemployed percentage significantly below state average. Black race population percentage significantly below state average. Hispanic race population percentage below state average. Median age above state average. Foreign-born population percentage significantly below state average.
#83 on the list of "Top 101 cities with the most residents born in Iraq (population 500+)"
#6 on the list of "Top 101 counties with the largest number of people moving out compared to moving in (pop. 50,000+)"
#30 on the list of "Top 101 counties with the largest decrease in the number of infant deaths per 1000 residents 2000-2006 to 2007-2013 (pop. 50,000+)"
#33 on the list of "Top 101 counties with the highest number of infant deaths per 1000 residents 2007-2013 (pop. 50,000+)"
#34 on the list of "Top 101 counties with the lowest percentage of residents relocating from other counties between 2010 and 2011 (pop. 50,000+)"
#40 on the list of "Top 101 counties with the lowest percentage of residents relocating from foreign countries between 2010 and 2011 (pop. 50,000+)"
Top Patent Applicants
David R. Staley (30)
Eric D. Staley (10)
Louis Simko (5)
Andrew W. Baur (4)
Kevin M. Burns (4)
Michael J. Seino (3)
John C. Lukasavitz (3)
James K. Platt (3)
Jawad A. Shah (3)
Terry M. Byers (3)
Total of 122 patent applications in 2008-2024.
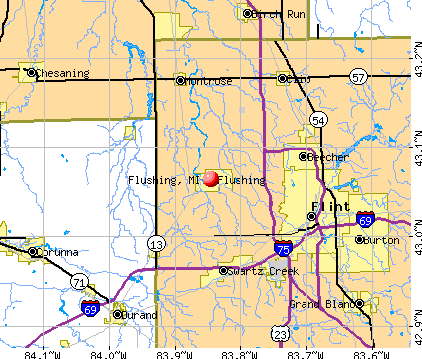


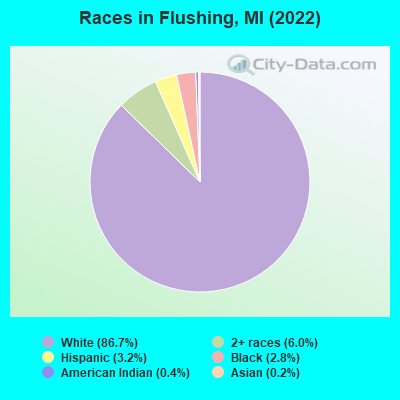
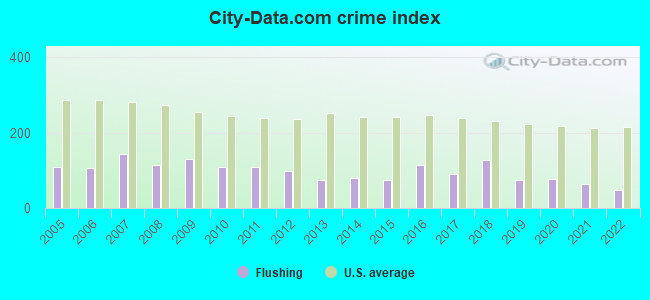
 Recent articles from our blog. Our writers, many of them Ph.D. graduates or candidates, create easy-to-read articles on a wide variety of topics.

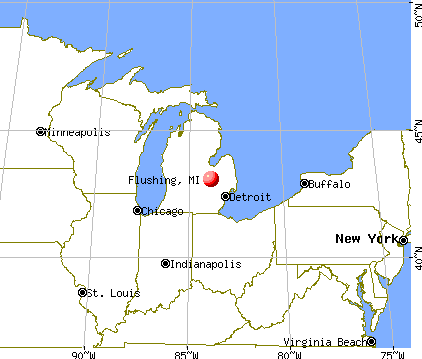
 (8.1 miles
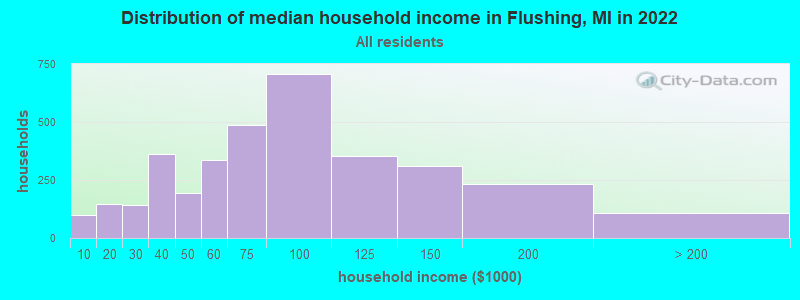
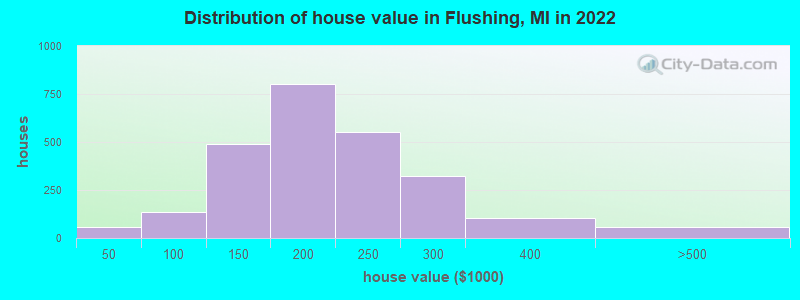
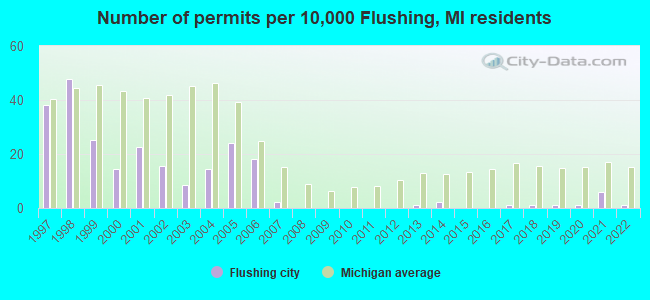
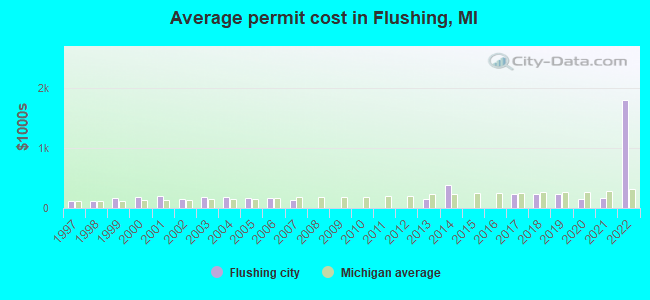
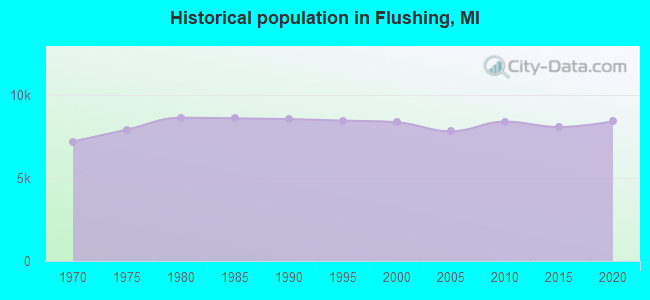
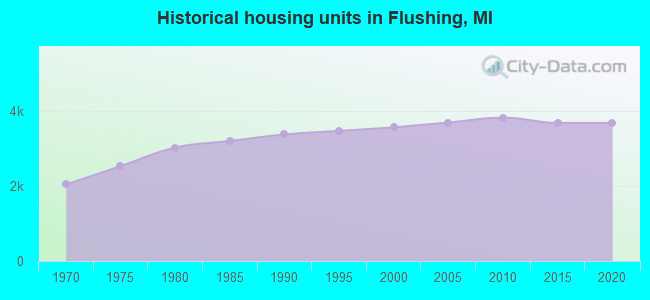
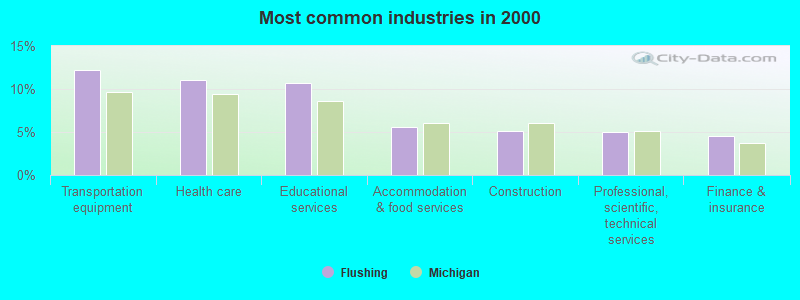
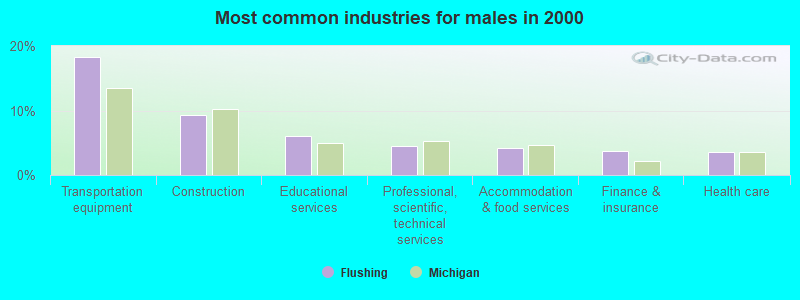
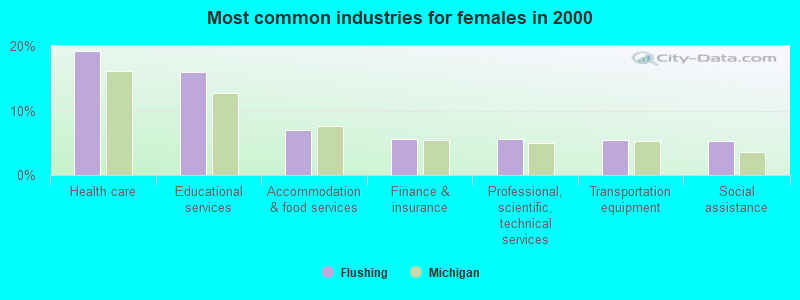
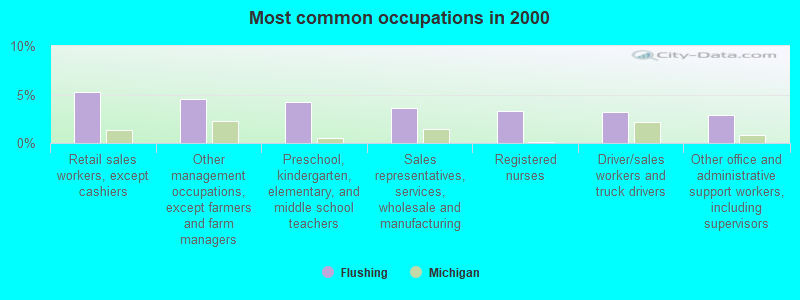
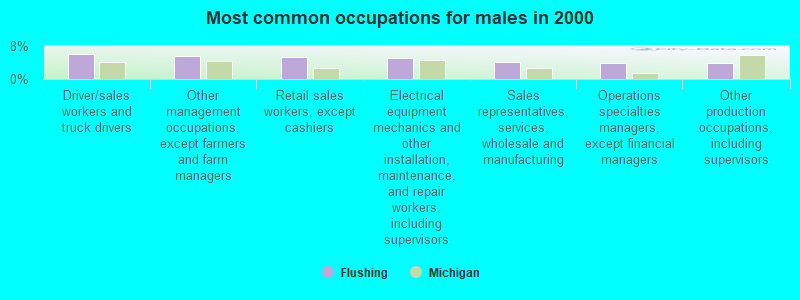
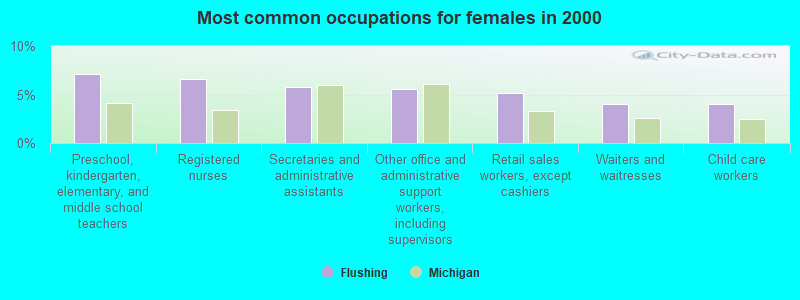


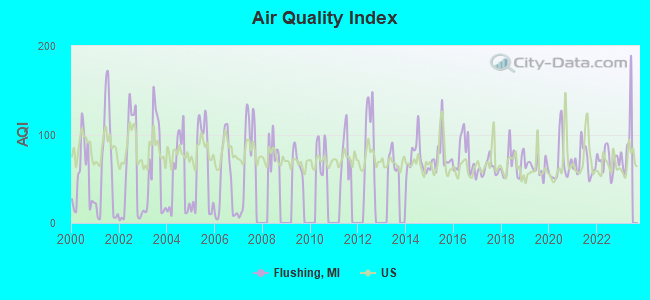
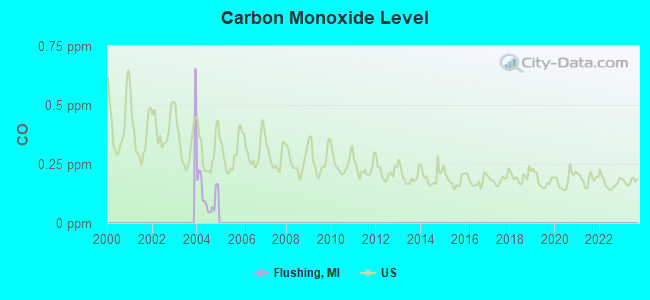
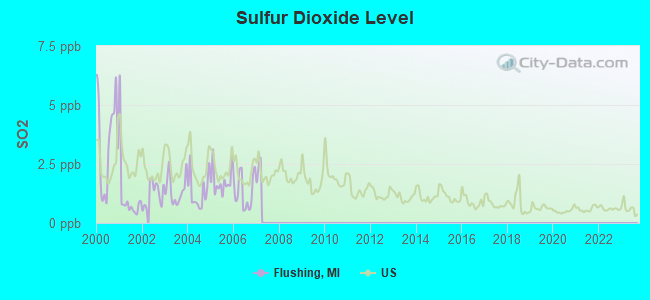
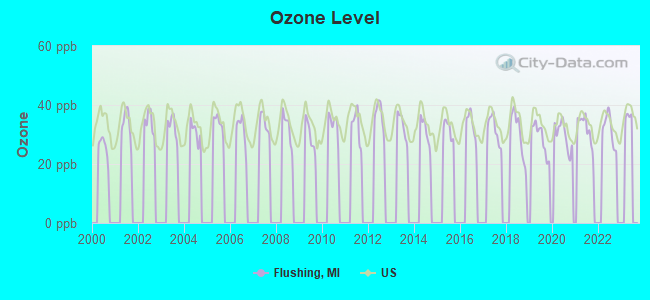
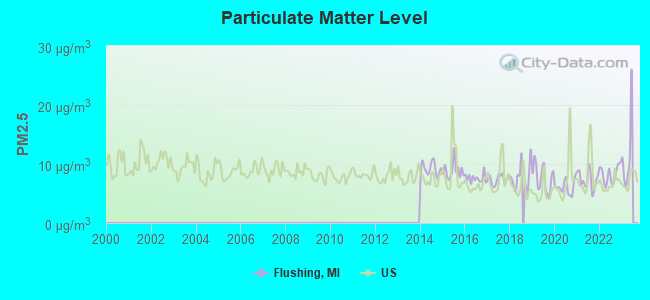

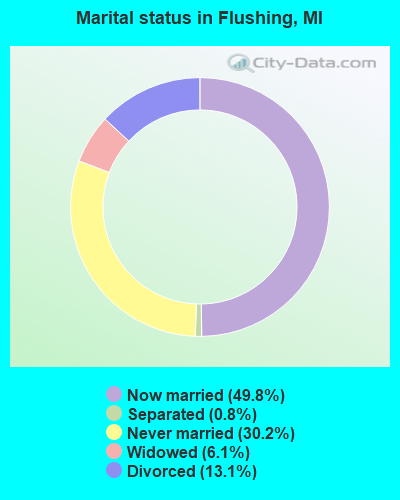
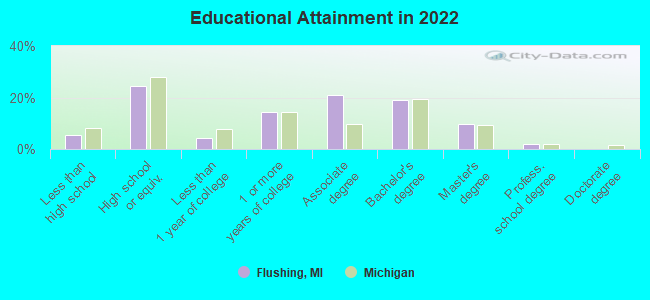
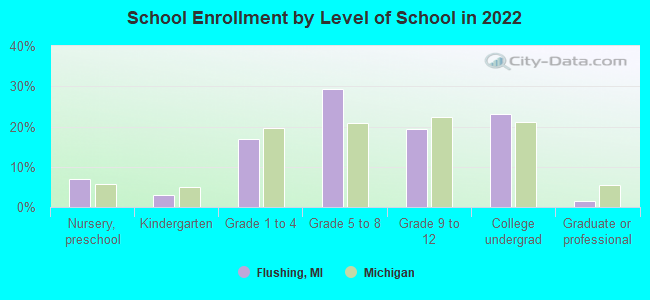
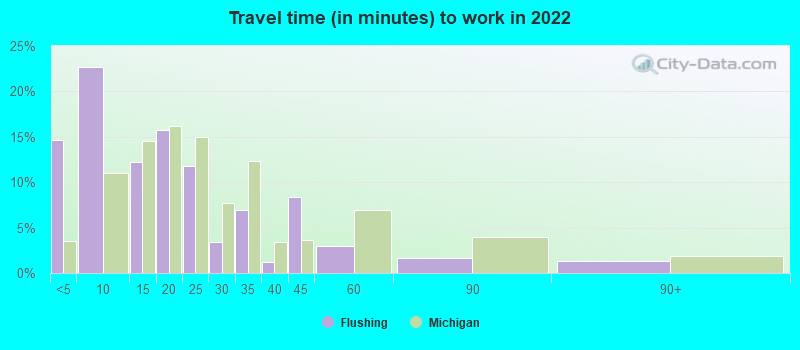
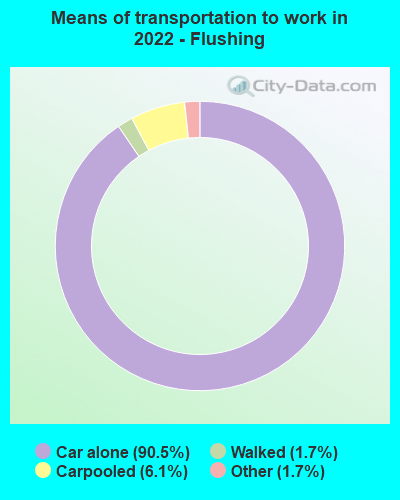
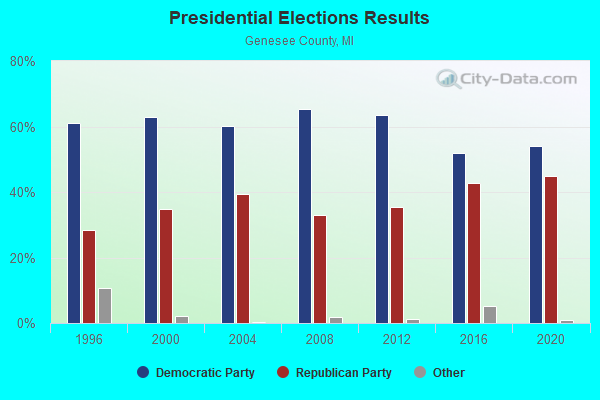
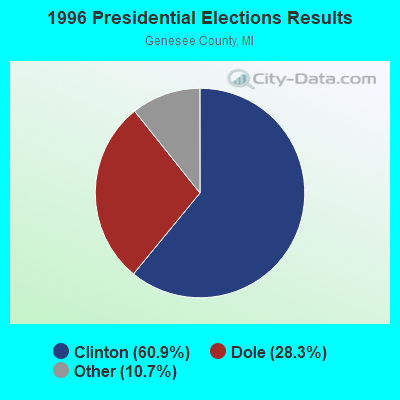
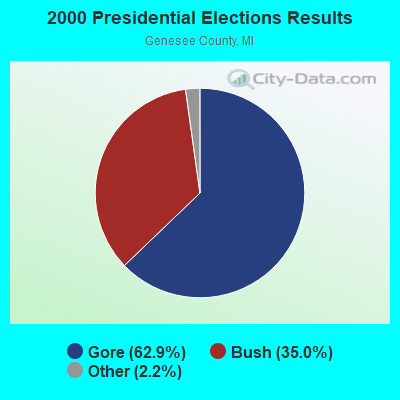
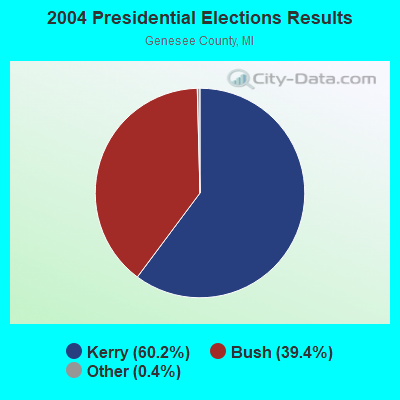
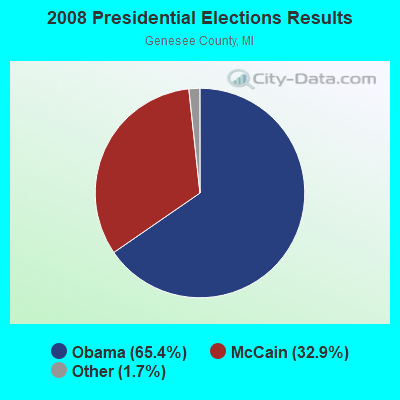

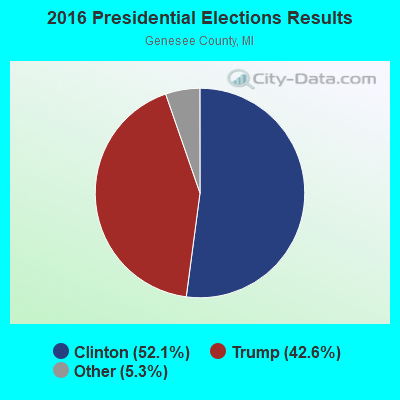
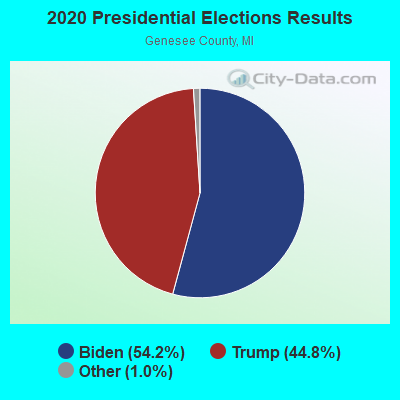

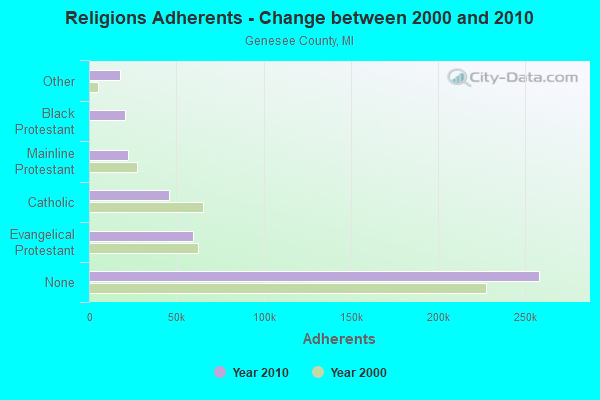
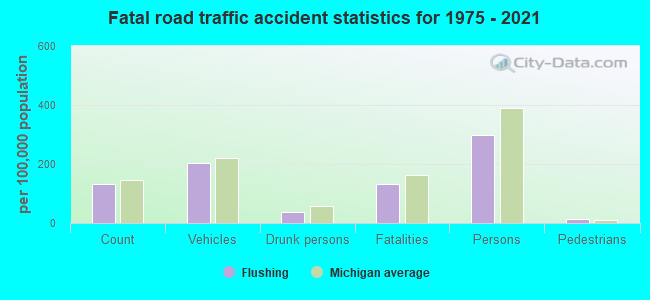
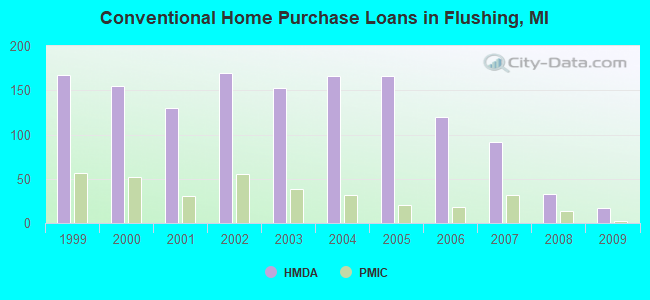
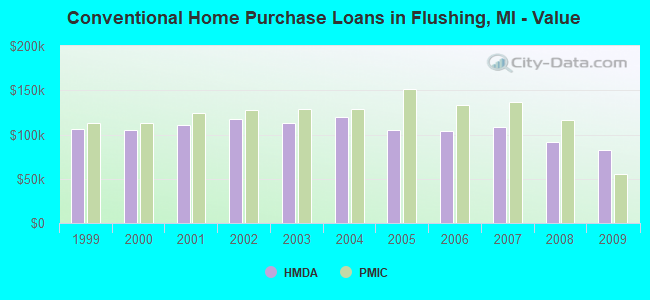
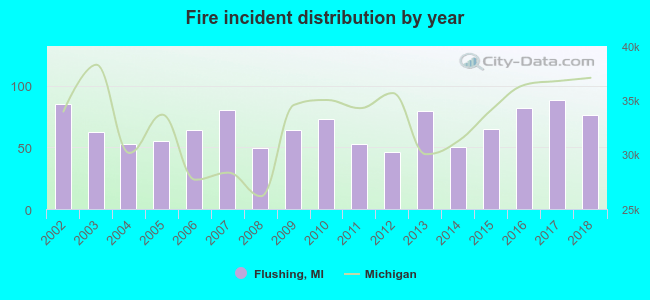 Based on the data from the years 2002 - 2018 the average number of fires per year is 66. The highest number of fires - 88 took place in 2017, and the least - 46 in 2012. The data has a decreasing trend.
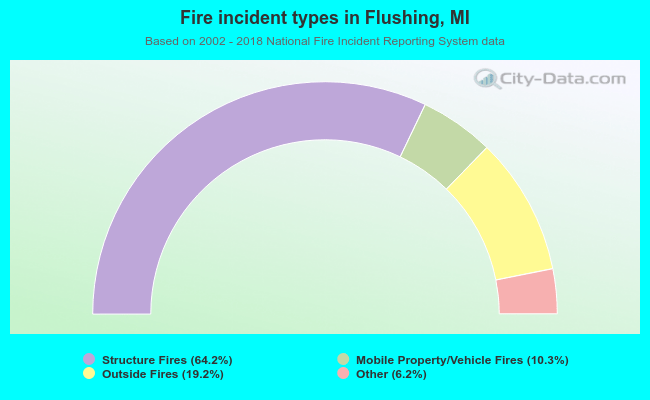 When looking into fire subcategories, the most reports belonged to: Structure Fires (64.2%), and Outside Fires (19.2%).