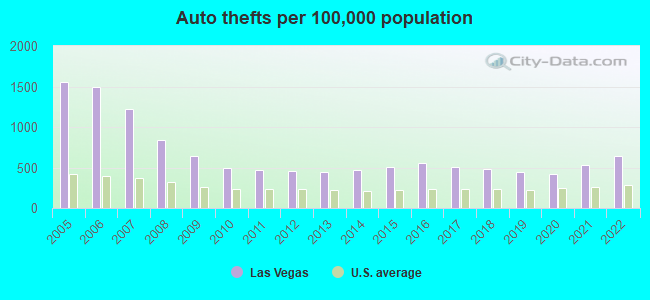
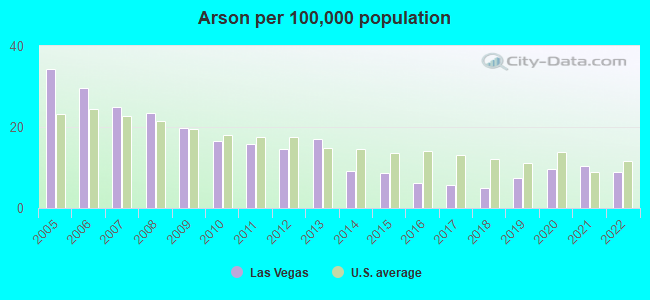
Crime rate in Las Vegas, Nevada (NV): murders, rapes, robberies, assaults, burglaries, thefts, auto thefts, arson, law enforcement employees, police officers, crime map
Crime rate in Las Vegas, NV
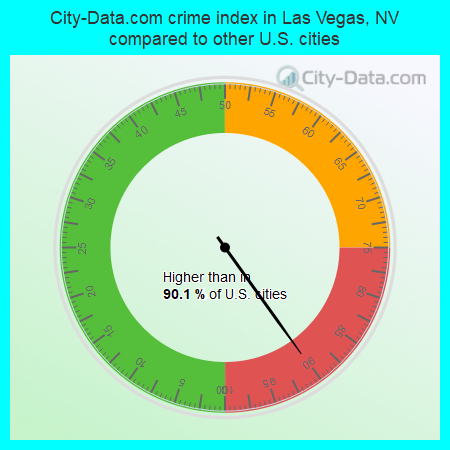
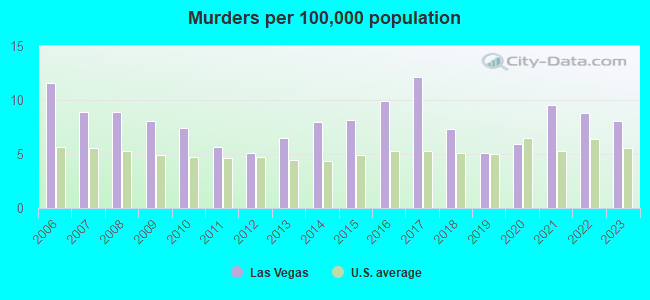
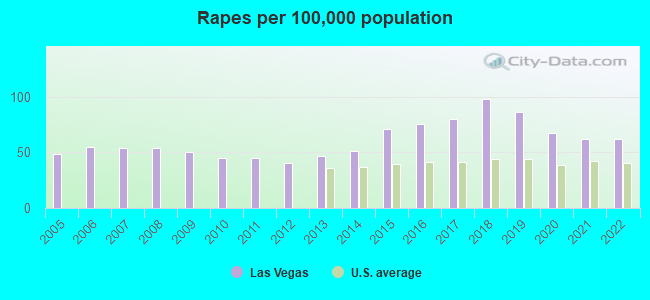
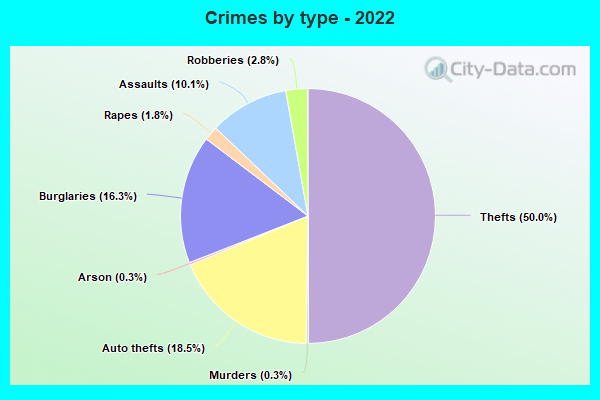
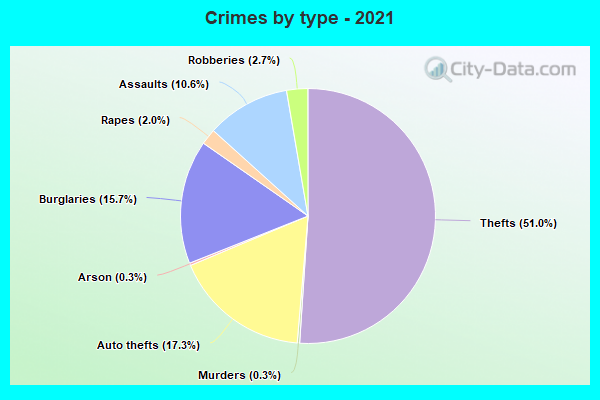
The 2022 crime rate in Las Vegas, NV is 325 (City-Data.com crime index), which is 1.3 times greater than the U.S. average. It was higher than in 90.1% U.S. cities. The 2022 Las Vegas crime rate rose by 10% compared to 2021. The number of homicides stood at 147 - a decrease of 11 compared to 2021. In the last 5 years Las Vegas has seen decline of violent crime and decline of property crime.See how dangerous Las Vegas, NV is compared to the nearest cities:
(Note: Higher means more crime)
(Note: Higher means more crime)
| Las Vegas: | 325.2 |
| North Las Vegas: | 246.9 |
| Henderson: | 183.5 |
| Boulder City: | 75.2 |
| Mesquite: | 109.8 |
| Bullhead City: | 102.5 |
| Kingman: | 253.4 |
| Needles: | 639.8 |
| St. George: | 111.8 |
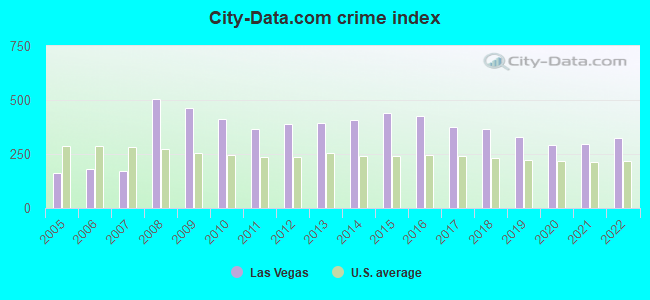
The City-Data.com crime index weighs serious crimes and violent crimes more heavily. Higher means more crime, U.S. average is 246.1. It adjusts for the number of visitors and daily workers commuting into cities.
- means the value is smaller than the state average.- means the value is about the same as the state average.
- means the value is bigger than the state average.
- means the value is much bigger than the state average.
According to our research of Nevada and other state lists, there were 4,788 registered sex offenders living in Las Vegas, Nevada as of April 26, 2024.
The ratio of all residents to sex offenders in Las Vegas is 132 to 1.
Violent crime rate in 2022
| Las Vegas: | 302.4 |
| U.S. Average: | 219.8 |
Violent crime rate in 2021
| Las Vegas: | 283.0 |
| U.S. Average: | 224.8 |
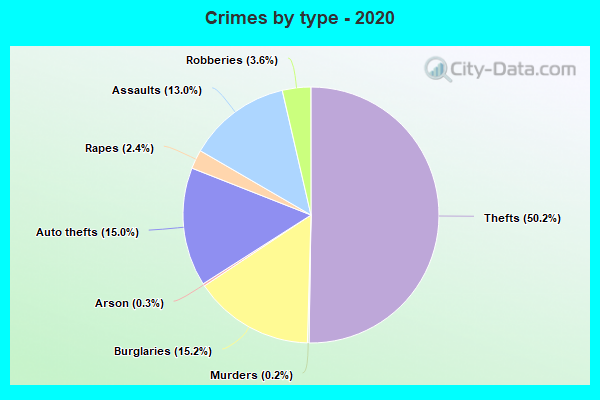
Violent crime rate in 2020
| Las Vegas: | 315.1 |
| U.S. Average: | 228.2 |
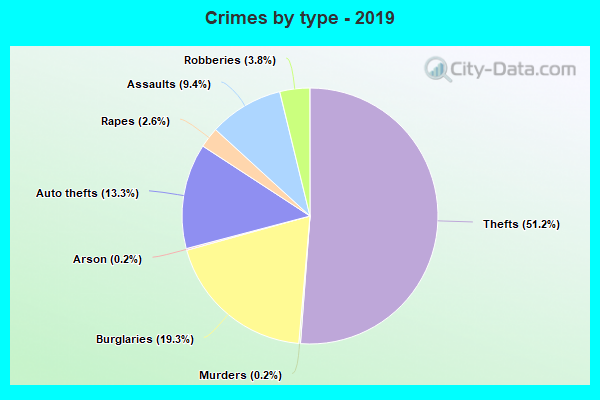
Violent crime rate in 2019
| Las Vegas: | 316.4 |
| U.S. Average: | 219.9 |
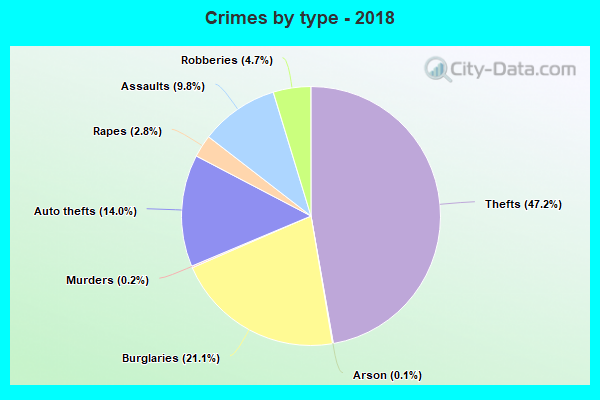
Violent crime rate in 2018
| Las Vegas: | 362.4 |
| U.S. Average: | 221.2 |
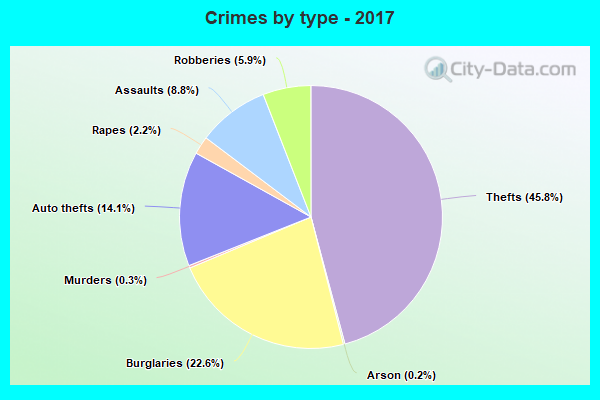
Violent crime rate in 2017
| Las Vegas: | 367.3 |
| U.S. Average: | 226.2 |
Violent crime rate in 2016
| Las Vegas: | 477.1 |
| U.S. Average: | 227.3 |
Violent crime rate in 2015
| Las Vegas: | 508.0 |
| U.S. Average: | 219.3 |
Violent crime rate in 2014
| Las Vegas: | 458.0 |
| U.S. Average: | 211.1 |
Violent crime rate in 2013
| Las Vegas: | 412.2 |
| U.S. Average: | 214.2 |
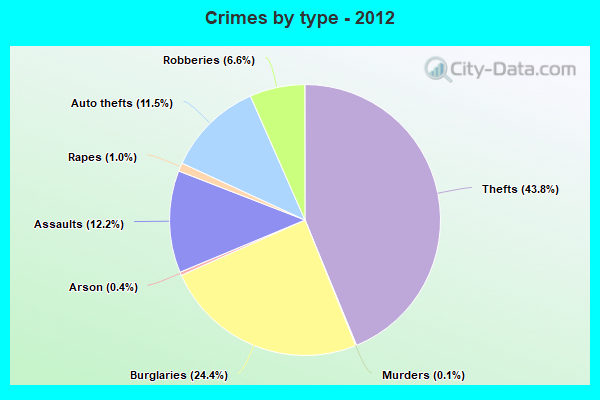
Violent crime rate in 2012
| Las Vegas: | 419.8 |
| U.S. Average: | 187.4 |
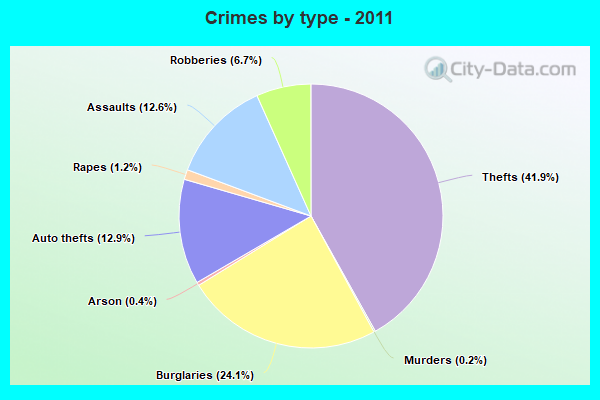
Violent crime rate in 2011
| Las Vegas: | 401.4 |
| U.S. Average: | 187.1 |
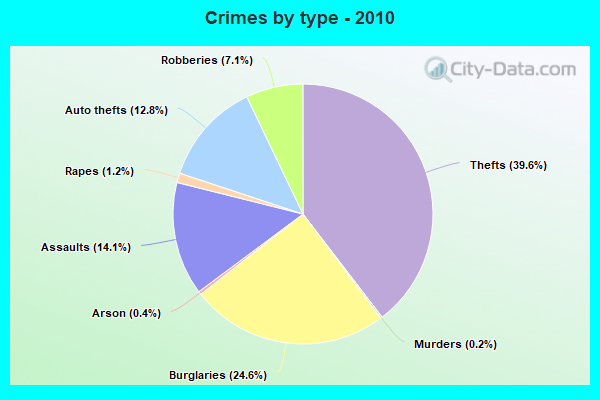
Violent crime rate in 2010
| Las Vegas: | 470.9 |
| U.S. Average: | 195.7 |
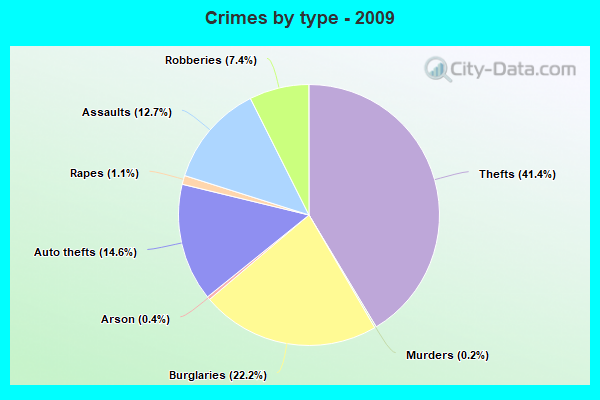
Violent crime rate in 2009
| Las Vegas: | 510.8 |
| U.S. Average: | 208.9 |
Violent crime rate in 2008
| Las Vegas: | 532.6 |
| U.S. Average: | 222.5 |
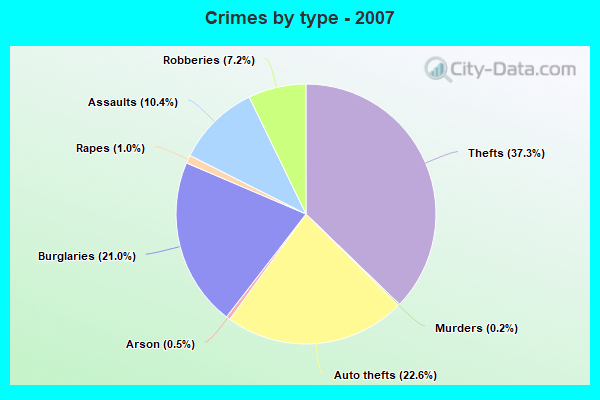
Violent crime rate in 2007
| Las Vegas: | 173.0 |
| U.S. Average: | 229.1 |
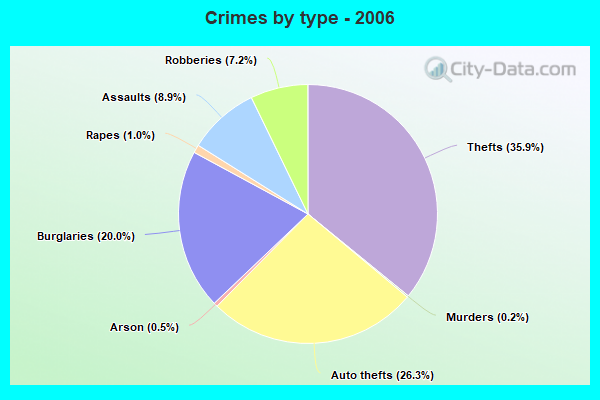
Violent crime rate in 2006
| Las Vegas: | 169.0 |
| U.S. Average: | 232.6 |
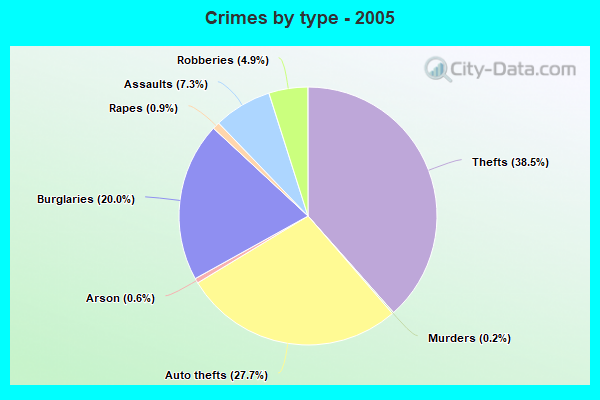
Violent crime rate in 2005
| Las Vegas: | 130.1 |
| U.S. Average: | 227.0 |
Property crime rate in 2022
| Las Vegas: | 293.5 |
| U.S. Average: | 166.5 |
Property crime rate in 2021
| Las Vegas: | 251.8 |
| U.S. Average: | 157.8 |
Property crime rate in 2020
| Las Vegas: | 220.8 |
| U.S. Average: | 169.6 |
Property crime rate in 2019
| Las Vegas: | 278.2 |
| U.S. Average: | 179.7 |
Property crime rate in 2018
| Las Vegas: | 299.4 |
| U.S. Average: | 190.2 |
Property crime rate in 2017
| Las Vegas: | 318.2 |
| U.S. Average: | 206.4 |
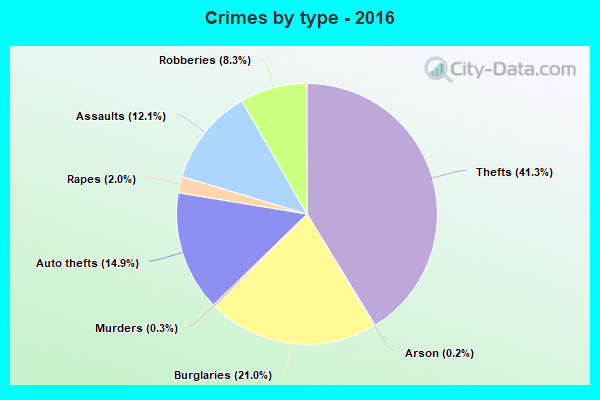
Property crime rate in 2016
| Las Vegas: | 317.8 |
| U.S. Average: | 216.6 |
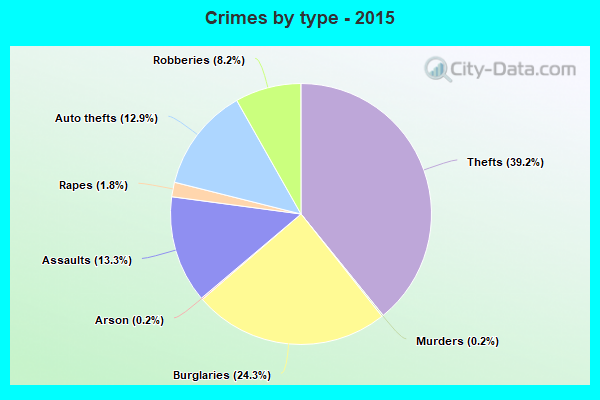
Property crime rate in 2015
| Las Vegas: | 343.2 |
| U.S. Average: | 221.5 |
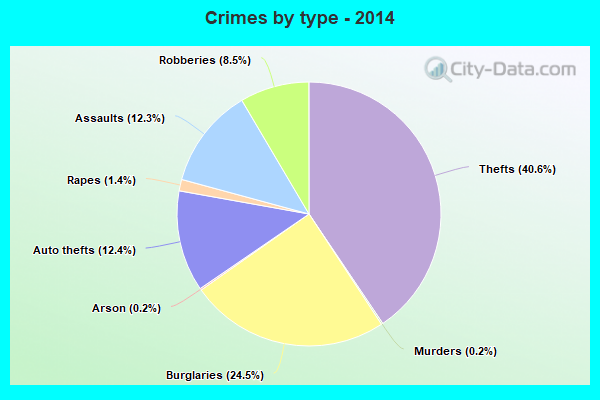
Property crime rate in 2014
| Las Vegas: | 331.7 |
| U.S. Average: | 230.8 |
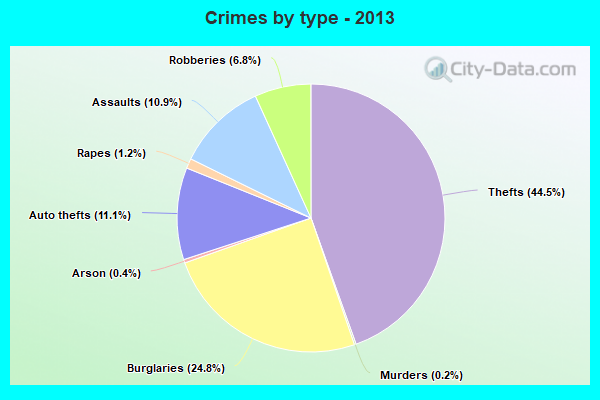
Property crime rate in 2013
| Las Vegas: | 351.9 |
| U.S. Average: | 250.4 |
Property crime rate in 2012
| Las Vegas: | 346.3 |
| U.S. Average: | 267.3 |
Property crime rate in 2011
| Las Vegas: | 318.8 |
| U.S. Average: | 273.5 |
Property crime rate in 2010
| Las Vegas: | 342.3 |
| U.S. Average: | 276.4 |
Property crime rate in 2009
| Las Vegas: | 385.0 |
| U.S. Average: | 285.6 |
Property crime rate in 2008
| Las Vegas: | 445.9 |
| U.S. Average: | 302.2 |
Property crime rate in 2007
| Las Vegas: | 161.8 |
| U.S. Average: | 309.2 |
Property crime rate in 2006
| Las Vegas: | 174.3 |
| U.S. Average: | 317.3 |
Property crime rate in 2005
| Las Vegas: | 178.3 |
| U.S. Average: | 322.3 |
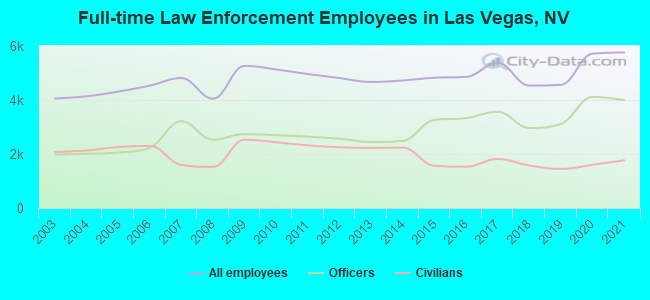
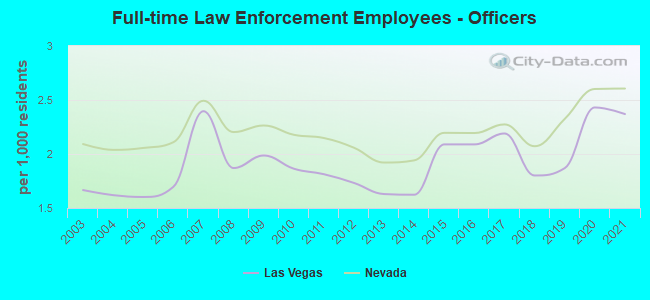
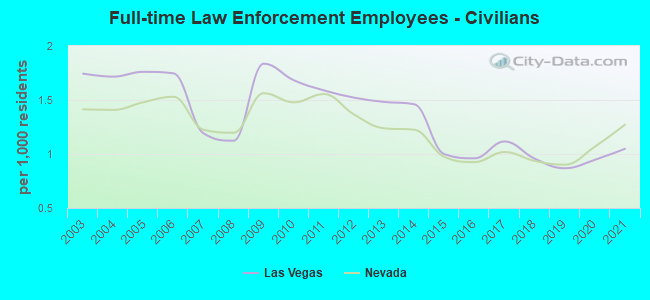
Full-time law enforcement employees in 2021, including police officers: 5,760 (3,994 officers - 3,412 male; 582 female).
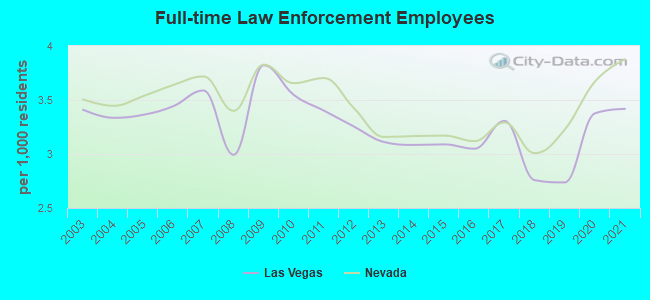
| Officers per 1,000 residents here: | 2.37 |
| Nevada average: | 2.61 |
Full-time law enforcement employees in 2020, including police officers: 5,716 (4,115 officers - 3,544 male; 571 female).
| Officers per 1,000 residents here: | 2.43 |
| Nevada average: | 2.60 |
Full-time law enforcement employees in 2019, including police officers: 4,562 (3,115 officers - 2,798 male; 317 female).
| Officers per 1,000 residents here: | 1.87 |
| Nevada average: | 2.32 |
Full-time law enforcement employees in 2018, including police officers: 4,535 (2,962 officers - 2,681 male; 281 female).
| Officers per 1,000 residents here: | 1.80 |
| Nevada average: | 2.07 |
Full-time law enforcement employees in 2017, including police officers: 5,379 (3,563 officers - 3,112 male; 451 female).
| Officers per 1,000 residents here: | 2.19 |
| Nevada average: | 2.27 |
Full-time law enforcement employees in 2016, including police officers: 4,855 (3,326 officers - 2,925 male; 401 female).
| Officers per 1,000 residents here: | 2.09 |
| Nevada average: | 2.19 |
Full-time law enforcement employees in 2015, including police officers: 4,825 (3,264 officers - 2,879 male; 385 female).
| Officers per 1,000 residents here: | 2.09 |
| Nevada average: | 2.20 |
Full-time law enforcement employees in 2014, including police officers: 4,722 (2,485 officers - 2,270 male; 215 female).
| Officers per 1,000 residents here: | 1.62 |
| Nevada average: | 1.94 |
Full-time law enforcement employees in 2013, including police officers: 4,668 (2,444 officers - 2,235 male; 209 female).
| Officers per 1,000 residents here: | 1.63 |
| Nevada average: | 1.92 |
Full-time law enforcement employees in 2012, including police officers: 4,814 (2,563 officers - 2,337 male; 226 female).
| Officers per 1,000 residents here: | 1.73 |
| Nevada average: | 2.06 |
Full-time law enforcement employees in 2011, including police officers: 4,962 (2,644 officers - 2,405 male; 239 female).
| Officers per 1,000 residents here: | 1.81 |
| Nevada average: | 2.15 |
Full-time law enforcement employees in 2010, including police officers: 5,130 (2,696 officers - 2,452 male; 244 female).
| Officers per 1,000 residents here: | 1.86 |
| Nevada average: | 2.18 |
Full-time law enforcement employees in 2009, including police officers: 5,264 (2,735 officers - 2,493 male; 242 female).
| Officers per 1,000 residents here: | 1.99 |
| Nevada average: | 2.26 |
Full-time law enforcement employees in 2008, including police officers: 4,050 (2,530 officers - 2,312 male; 218 female).
| Officers per 1,000 residents here: | 1.87 |
| Nevada average: | 2.20 |
Full-time law enforcement employees in 2007, including police officers: 4,812 (3,214 officers - 2,823 male; 391 female).
| Officers per 1,000 residents here: | 2.40 |
| Nevada average: | 2.49 |
Full-time law enforcement employees in 2006, including police officers: 4,530 (2,231 officers - 2,036 male; 195 female).
| Officers per 1,000 residents here: | 1.70 |
| Nevada average: | 2.11 |
Full-time law enforcement employees in 2005, including police officers: 4,310 (2,053 officers - 1,871 male; 182 female).
| Officers per 1,000 residents here: | 1.60 |
| Nevada average: | 2.06 |
Full-time law enforcement employees in 2004, including police officers: 4,135 (2,007 officers - 1,834 male; 173 female).
| Officers per 1,000 residents here: | 1.62 |
| Nevada average: | 2.04 |
Full-time law enforcement employees in 2003, including police officers: 4,055 (1,981 officers - 1,809 male; 172 female).
| Officers per 1,000 residents here: | 1.67 |
| Nevada average: | 2.09 |

Zip codes: 89030, 89101, 89102, 89104, 89106, 89107, 89108, 89109, 89110, 89117, 89128, 89129, 89130, 89131, 89134, 89135, 89138, 89143, 89144, 89145, 89146, 89149, 89166.