Races in Las Vegas, Nevada (NV) Detailed Stats
Data:
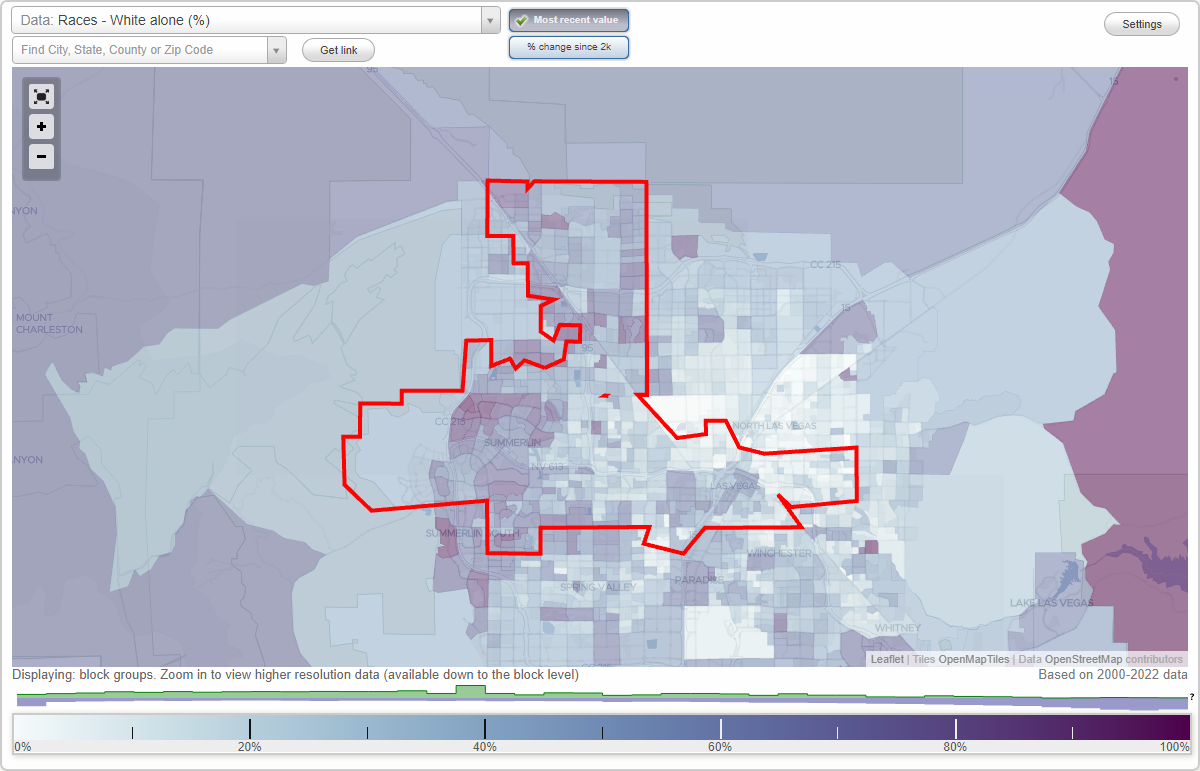
Races - White alone (%)
Races - White alone (% change since 2000)
Races - Black alone (%)
Races - Black alone (% change since 2000)
Races - American Indian alone (%)
Races - American Indian alone (% change since 2000)
Races - Asian alone (%)
Races - Asian alone (% change since 2000)
Races - Hispanic (%)
Races - Hispanic (% change since 2000)
Races - Native Hawaiian and Other Pacific Islander alone (%)
Races - Native Hawaiian and Other Pacific Islander alone (% change since 2000)
Races - Two or more races(%)
Races - Two or more races(% change since 2000)
Races - Other race alone (%)
Races - Other race alone (% change since 2000)
Racial diversity
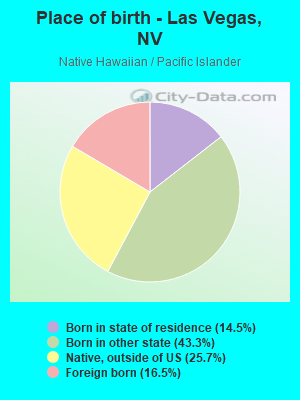
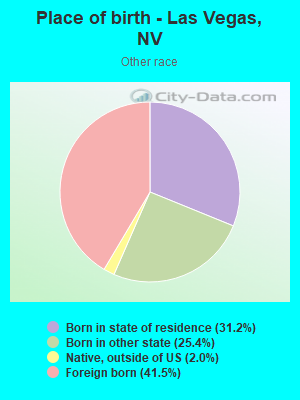
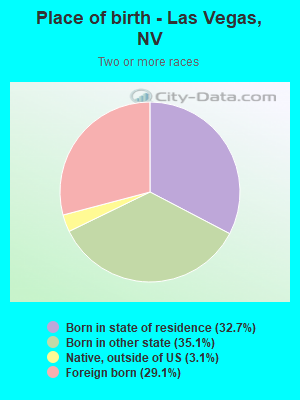
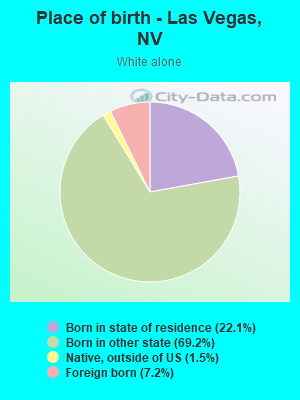
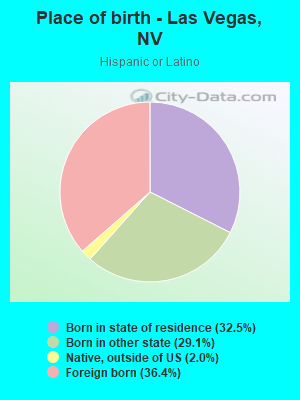
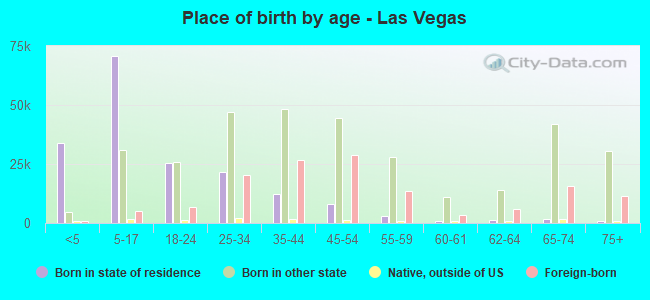
Place of birth - Born in state of residence (%)
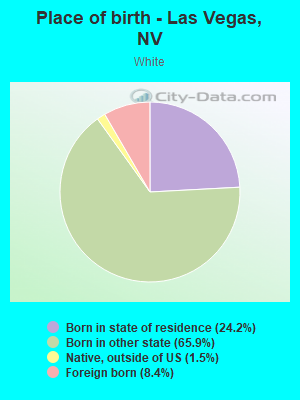
Place of birth - Born in state of residence (%) - White
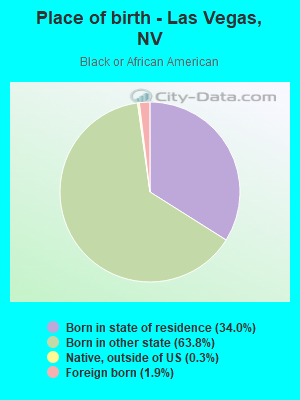
Place of birth - Born in state of residence (%) - Black or African American
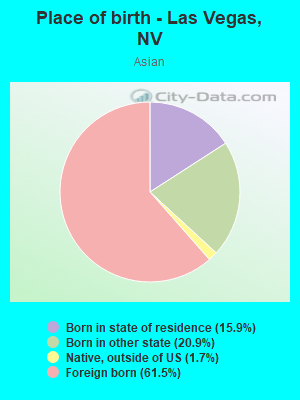
Place of birth - Born in state of residence (%) - Asian
Place of birth - Born in state of residence (%) - Hispanic or Latino
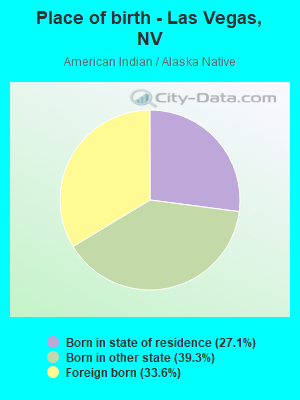
Place of birth - Born in state of residence (%) - American Indian and Alaska Native
Place of birth - Born in state of residence (%) - Multirace
Place of birth - Born in state of residence (%) - Other Race
Place of birth - Born in other state (%)
Place of birth - Born in other state (%) - White
Place of birth - Born in other state (%) - Black or African American
Place of birth - Born in other state (%) - Asian
Place of birth - Born in other state (%) - Hispanic or Latino
Place of birth - Born in other state (%) - American Indian and Alaska Native
Place of birth - Born in other state (%) - Multirace
Place of birth - Born in other state (%) - Other Race
Place of birth - Native, outside of US (%)
Place of birth - Native, outside of US (%) - White
Place of birth - Native, outside of US (%) - Black or African American
Place of birth - Native, outside of US (%) - Asian
Place of birth - Native, outside of US (%) - Hispanic or Latino
Place of birth - Native, outside of US (%) - American Indian and Alaska Native
Place of birth - Native, outside of US (%) - Multirace
Place of birth - Native, outside of US (%) - Other Race
Place of birth - Foreign born (%)
Place of birth - Foreign born (%) - White
Place of birth - Foreign born (%) - Black or African American
Place of birth - Foreign born (%) - Asian
Place of birth - Foreign born (%) - Hispanic or Latino
Place of birth - Foreign born (%) - American Indian and Alaska Native
Place of birth - Foreign born (%) - Multirace
Place of birth - Foreign born (%) - Other Race
Residents speaking English at home (%)
Residents speaking English at home - Born in the United States (%)
Residents speaking English at home - Native, born elsewhere (%)
Residents speaking English at home - Foreign born (%)
Residents speaking Spanish at home (%)
Residents speaking Spanish at home - Born in the United States (%)
Residents speaking Spanish at home - Native, born elsewhere (%)
Residents speaking Spanish at home - Foreign born (%)
Residents speaking other language at home (%)
Residents speaking other language at home - Born in the United States (%)
Residents speaking other language at home - Native, born elsewhere (%)
Residents speaking other language at home - Foreign born (%)
Marital status - Never married (%)
Marital status - Now married (%)
Marital status - Separated (%)
Marital status - Widowed (%)
Marital status - Divorced (%)
Ancestries Reported - Arab (%)
Ancestries Reported - Czech (%)
Ancestries Reported - Danish (%)
Ancestries Reported - Dutch (%)
Ancestries Reported - English (%)
Ancestries Reported - French (%)
Ancestries Reported - French Canadian (%)
Ancestries Reported - German (%)
Ancestries Reported - Greek (%)
Ancestries Reported - Hungarian (%)
Ancestries Reported - Irish (%)
Ancestries Reported - Italian (%)
Ancestries Reported - Lithuanian (%)
Ancestries Reported - Norwegian (%)
Ancestries Reported - Polish (%)
Ancestries Reported - Portuguese (%)
Ancestries Reported - Russian (%)
Ancestries Reported - Scotch-Irish (%)
Ancestries Reported - Scottish (%)
Ancestries Reported - Slovak (%)
Ancestries Reported - Subsaharan African (%)
Ancestries Reported - Swedish (%)
Ancestries Reported - Swiss (%)
Ancestries Reported - Ukrainian (%)
Ancestries Reported - United States (%)
Ancestries Reported - Welsh (%)
Ancestries Reported - West Indian (%)
Ancestries Reported - Other (%)
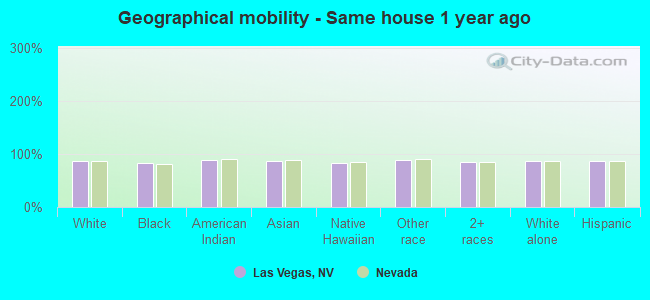
Geographical mobility - Same house 1 year ago (%)
Geographical mobility - Same house 1 year ago (%) - White
Geographical mobility - Same house 1 year ago (%) - Black or African American
Geographical mobility - Same house 1 year ago (%) - Asian
Geographical mobility - Same house 1 year ago (%) - Hispanic or Latino
Geographical mobility - Same house 1 year ago (%) - American Indian and Alaska Native
Geographical mobility - Same house 1 year ago (%) - Multirace
Geographical mobility - Same house 1 year ago (%) - Other Race
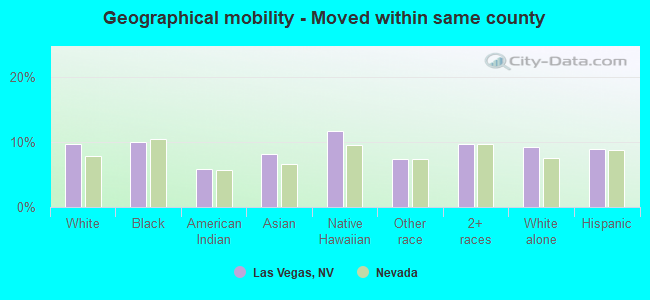
Geographical mobility - Moved within same county (%)
Geographical mobility - Moved within same county (%) - White
Geographical mobility - Moved within same county (%) - Black or African American
Geographical mobility - Moved within same county (%) - Asian
Geographical mobility - Moved within same county (%) - Hispanic or Latino
Geographical mobility - Moved within same county (%) - American Indian and Alaska Native
Geographical mobility - Moved within same county (%) - Multirace
Geographical mobility - Moved within same county (%) - Other Race
Geographical mobility - Moved from different county within same state (%)
Geographical mobility - Moved from different county within same state (%) - White
Geographical mobility - Moved from different county within same state (%) - Black or African American
Geographical mobility - Moved from different county within same state (%) - Asian
Geographical mobility - Moved from different county within same state (%) - Hispanic or Latino
Geographical mobility - Moved from different county within same state (%) - American Indian and Alaska Native
Geographical mobility - Moved from different county within same state (%) - Multirace
Geographical mobility - Moved from different county within same state (%) - Other Race
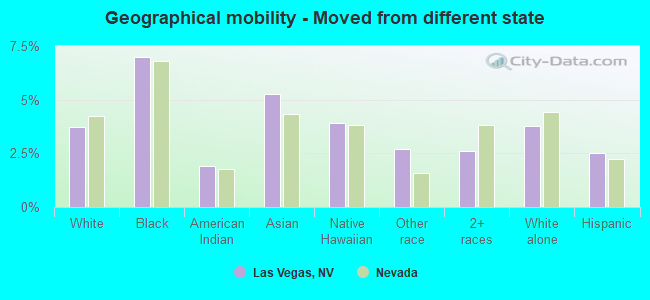
Geographical mobility - Moved from different state (%)
Geographical mobility - Moved from different state (%) - White
Geographical mobility - Moved from different state (%) - Black or African American
Geographical mobility - Moved from different state (%) - Asian
Geographical mobility - Moved from different state (%) - Hispanic or Latino
Geographical mobility - Moved from different state (%) - American Indian and Alaska Native
Geographical mobility - Moved from different state (%) - Multirace
Geographical mobility - Moved from different state (%) - Other Race
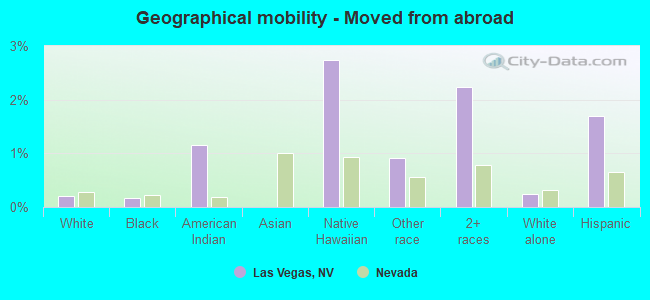
Geographical mobility - Moved from abroad (%)
Geographical mobility - Moved from abroad (%) - White
Geographical mobility - Moved from abroad (%) - Black or African American
Geographical mobility - Moved from abroad (%) - Asian
Geographical mobility - Moved from abroad (%) - Hispanic or Latino
Geographical mobility - Moved from abroad (%) - American Indian and Alaska Native
Geographical mobility - Moved from abroad (%) - Multirace
Geographical mobility - Moved from abroad (%) - Other Race
Place of birth for the foreign-born population - Ireland (%)
Place of birth for the foreign-born population - Denmark (%)
Place of birth for the foreign-born population - Norway (%)
Place of birth for the foreign-born population - Sweden (%)
Place of birth for the foreign-born population - United Kingdom (%)
Place of birth for the foreign-born population - England (%)
Place of birth for the foreign-born population - Scotland (%)
Place of birth for the foreign-born population - Other Northern Europe (%)
Place of birth for the foreign-born population - Austria (%)
Place of birth for the foreign-born population - Belgium (%)
Place of birth for the foreign-born population - France (%)
Place of birth for the foreign-born population - Germany (%)
Place of birth for the foreign-born population - Netherlands (%)
Place of birth for the foreign-born population - Switzerland (%)
Place of birth for the foreign-born population - Other Western Europe (%)
Place of birth for the foreign-born population - Greece (%)
Place of birth for the foreign-born population - Italy (%)
Place of birth for the foreign-born population - Portugal (%)
Place of birth for the foreign-born population - Spain (%)
Place of birth for the foreign-born population - Other Southern Europe (%)
Place of birth for the foreign-born population - Albania (%)
Place of birth for the foreign-born population - Belarus (%)
Place of birth for the foreign-born population - Bosnia and Herzegovina (%)
Place of birth for the foreign-born population - Bulgaria (%)
Place of birth for the foreign-born population - Croatia (%)
Place of birth for the foreign-born population - Czechoslovakia (%)
Place of birth for the foreign-born population - Hungary (%)
Place of birth for the foreign-born population - Latvia (%)
Place of birth for the foreign-born population - Lithuania (%)
Place of birth for the foreign-born population - North Macedonia (Macedonia) (%)
Place of birth for the foreign-born population - Moldova (%)
Place of birth for the foreign-born population - Poland (%)
Place of birth for the foreign-born population - Romania (%)
Place of birth for the foreign-born population - Russia (%)
Place of birth for the foreign-born population - Serbia (%)
Place of birth for the foreign-born population - Ukraine (%)
Place of birth for the foreign-born population - Other Eastern Europe (%)
Place of birth for the foreign-born population - China (%)
Place of birth for the foreign-born population - Hong Kong (%)
Place of birth for the foreign-born population - Taiwan (%)
Place of birth for the foreign-born population - Japan (%)
Place of birth for the foreign-born population - Korea (%)
Place of birth for the foreign-born population - Other Eastern Asia (%)
Place of birth for the foreign-born population - Afghanistan (%)
Place of birth for the foreign-born population - Bangladesh (%)
Place of birth for the foreign-born population - India (%)
Place of birth for the foreign-born population - Iran (%)
Place of birth for the foreign-born population - Kazakhstan (%)
Place of birth for the foreign-born population - Nepal (%)
Place of birth for the foreign-born population - Pakistan (%)
Place of birth for the foreign-born population - Sri Lanka (%)
Place of birth for the foreign-born population - Uzbekistan (%)
Place of birth for the foreign-born population - Other South Central Asia (%)
Place of birth for the foreign-born population - Burma (%)
Place of birth for the foreign-born population - Cambodia (%)
Place of birth for the foreign-born population - Indonesia (%)
Place of birth for the foreign-born population - Laos (%)
Place of birth for the foreign-born population - Malaysia (%)
Place of birth for the foreign-born population - Philippines (%)
Place of birth for the foreign-born population - Singapore (%)
Place of birth for the foreign-born population - Thailand (%)
Place of birth for the foreign-born population - Vietnam (%)
Place of birth for the foreign-born population - Other South Eastern Asia (%)
Place of birth for the foreign-born population - Armenia (%)
Place of birth for the foreign-born population - Iraq (%)
Place of birth for the foreign-born population - Israel (%)
Place of birth for the foreign-born population - Jordan (%)
Place of birth for the foreign-born population - Kuwait (%)
Place of birth for the foreign-born population - Lebanon (%)
Place of birth for the foreign-born population - Saudi Arabia (%)
Place of birth for the foreign-born population - Syria (%)
Place of birth for the foreign-born population - Turkey (%)
Place of birth for the foreign-born population - Yemen (%)
Place of birth for the foreign-born population - Other Western Asia (%)
Place of birth for the foreign-born population - Eritrea (%)
Place of birth for the foreign-born population - Ethiopia (%)
Place of birth for the foreign-born population - Kenya (%)
Place of birth for the foreign-born population - Somalia (%)
Place of birth for the foreign-born population - Uganda (%)
Place of birth for the foreign-born population - Zimbabwe (%)
Place of birth for the foreign-born population - Other Eastern Africa (%)
Place of birth for the foreign-born population - Cameroon (%)
Place of birth for the foreign-born population - Congo (%)
Place of birth for the foreign-born population - Democratic Republic of Congo (Zaire) (%)
Place of birth for the foreign-born population - Other Middle Africa (%)
Place of birth for the foreign-born population - Egypt (%)
Place of birth for the foreign-born population - Morocco (%)
Place of birth for the foreign-born population - Sudan (%)
Place of birth for the foreign-born population - Other Northern Africa (%)
Place of birth for the foreign-born population - South Africa (%)
Place of birth for the foreign-born population - Other Southern Africa (%)
Place of birth for the foreign-born population - Cabo Verde (%)
Place of birth for the foreign-born population - Ghana (%)
Place of birth for the foreign-born population - Liberia (%)
Place of birth for the foreign-born population - Nigeria (%)
Place of birth for the foreign-born population - Senegal (%)
Place of birth for the foreign-born population - Sierra Leone (%)
Place of birth for the foreign-born population - Other Western Africa (%)
Place of birth for the foreign-born population - Australia (%)
Place of birth for the foreign-born population - New Zealand (%)
Place of birth for the foreign-born population - Fiji (%)
Place of birth for the foreign-born population - Micronesia (%)
Place of birth for the foreign-born population - Bahamas (%)
Place of birth for the foreign-born population - Barbados (%)
Place of birth for the foreign-born population - Cuba (%)
Place of birth for the foreign-born population - Dominica (%)
Place of birth for the foreign-born population - Dominican Republic (%)
Place of birth for the foreign-born population - Grenada (%)
Place of birth for the foreign-born population - Haiti (%)
Place of birth for the foreign-born population - Jamaica (%)
Place of birth for the foreign-born population - St. Vincent and the Grenadines (%)
Place of birth for the foreign-born population - Trinidad and Tobago (%)
Place of birth for the foreign-born population - West Indies (%)
Place of birth for the foreign-born population - Other Caribbean (%)
Place of birth for the foreign-born population - Belize (%)
Place of birth for the foreign-born population - Costa Rica (%)
Place of birth for the foreign-born population - El Salvador (%)
Place of birth for the foreign-born population - Guatemala (%)
Place of birth for the foreign-born population - Honduras (%)
Place of birth for the foreign-born population - Mexico (%)
Place of birth for the foreign-born population - Nicaragua (%)
Place of birth for the foreign-born population - Panama (%)
Place of birth for the foreign-born population - Other Central America (%)
Place of birth for the foreign-born population - Argentina (%)
Place of birth for the foreign-born population - Bolivia (%)
Place of birth for the foreign-born population - Brazil (%)
Place of birth for the foreign-born population - Chile (%)
Place of birth for the foreign-born population - Colombia (%)
Place of birth for the foreign-born population - Ecuador (%)
Place of birth for the foreign-born population - Guyana (%)
Place of birth for the foreign-born population - Peru (%)
Place of birth for the foreign-born population - Uruguay (%)
Place of birth for the foreign-born population - Venezuela (%)
Place of birth for the foreign-born population - Other South America (%)
Place of birth for the foreign-born population - Canada (%)
Place of birth for the foreign-born population - Other Northern America (%)
Place of birth for the foreign-born population - Other (%)
According to 2022 data, the most numerous races in Las Vegas, NV are White alone (260,101 residents), Hispanic (223,928 residents), and Black alone (75,435 residents). 66.0% of Las Vegas residents speak English at home. 20.7% of Las Vegas, NV residents are foreign-born (12.9% born in Latin America, 5.4% born in Asia), which is 13.2% greater than the foreign-born rate of 18.0% across the entire state of Nevada.
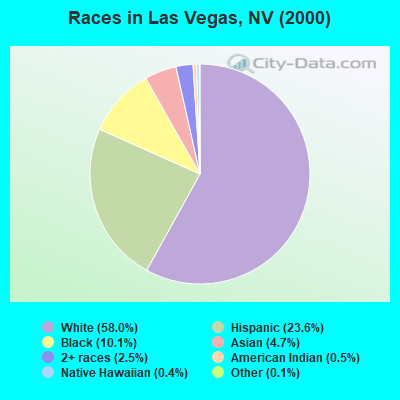
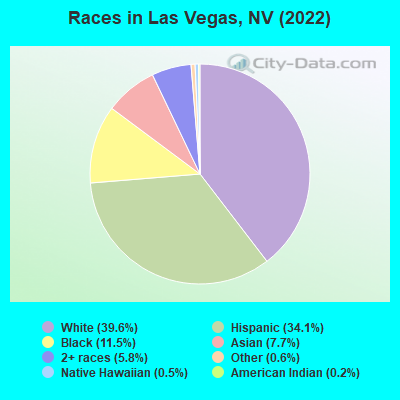
Race distribution in Las Vegas
2000 2022
277,704 58.0% White alone 112,962 23.6% Hispanic 48,380 10.1% Black alone 22,411 4.7% Asian alone 11,987 2.5% Two or more races 2,405 0.5% American Indian alone 1,935 0.4% Native Hawaiian and Other 650 0.1% Other race alone
260,101 39.6% White alone 223,928 34.1% Hispanic 75,435 11.5% Black alone 50,277 7.7% Asian alone 38,099 5.8% Two or more races 3,737 0.6% Other race alone 3,306 0.5% Native Hawaiian and Other 1,419 0.2% American Indian alone
2000 2022
1,303,001 65.2% White alone 393,970 19.7% Hispanic 131,509 6.6% Black alone 88,593 4.4% Asian alone 49,231 2.5% Two or more races 21,397 1.1% American Indian alone 7,769 0.4% Native Hawaiian and Other 2,787 0.1% Other race alone
1,410,145 44.4% White alone 961,357 30.3% Hispanic 286,471 9.0% Black alone 281,149 8.8% Asian alone 182,151 5.7% Two or more races 20,102 0.6% Native Hawaiian and Other 18,781 0.6% Other race alone 17,616 0.6% American Indian alone
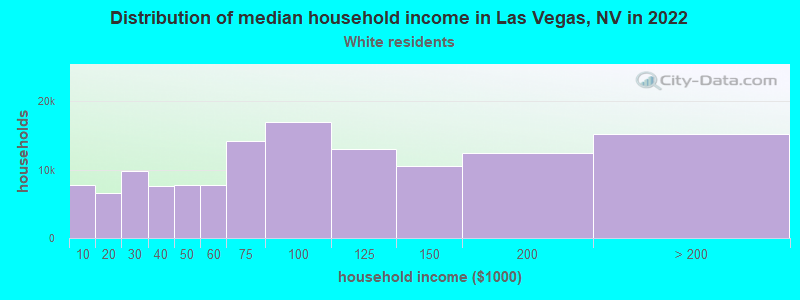
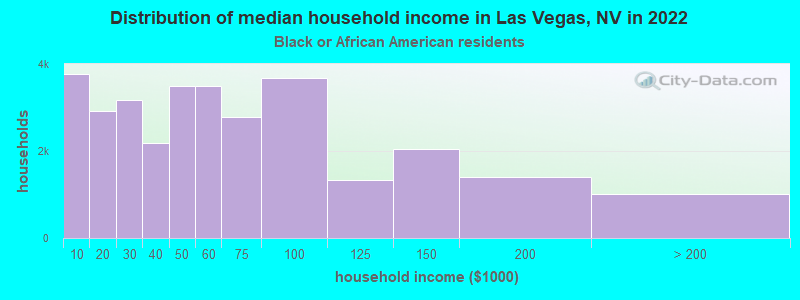
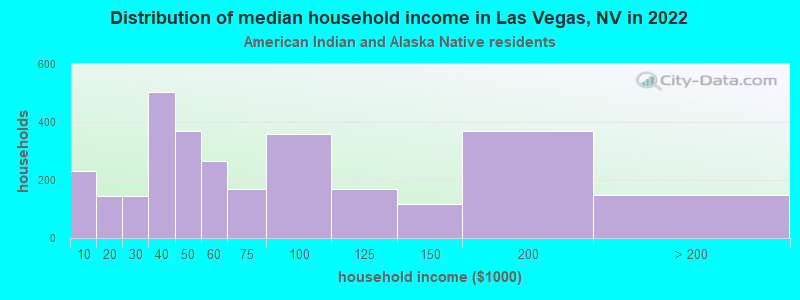
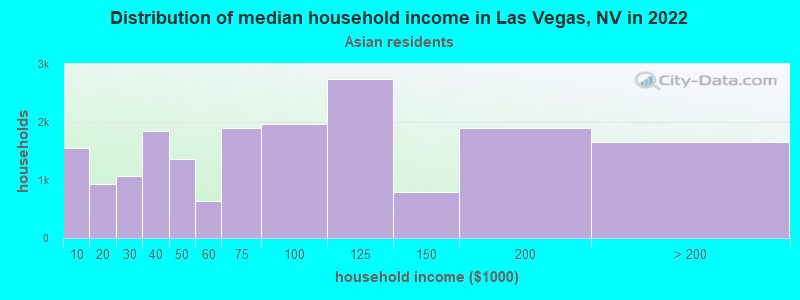
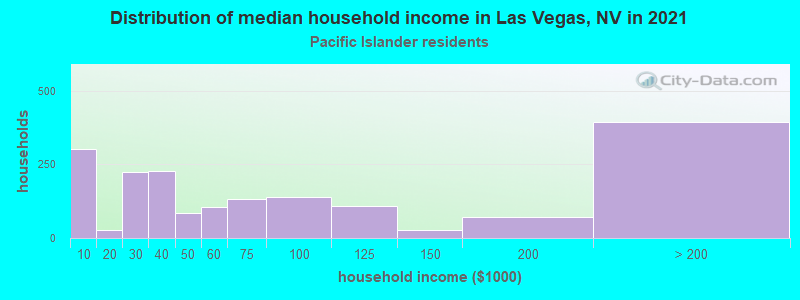
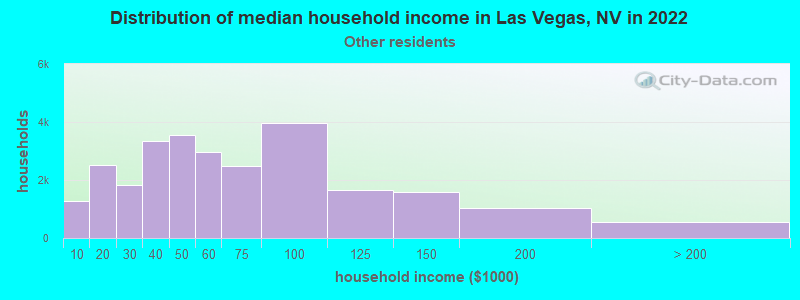
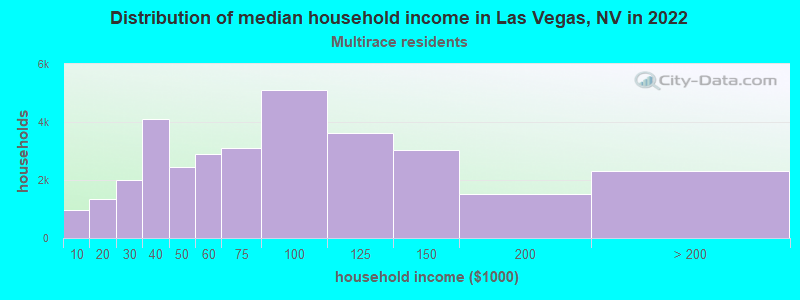
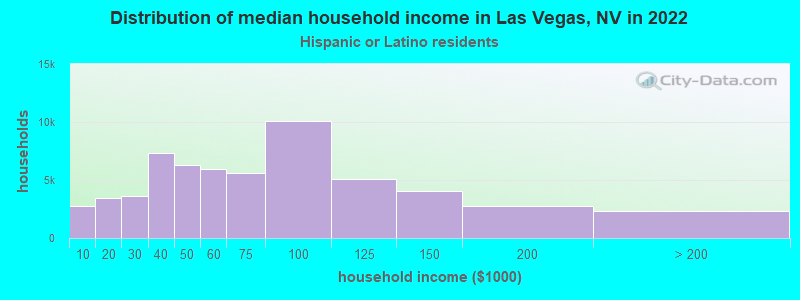
Income and house value in Las Vegas Median household income in 2022 $79,166 White non-Hispanic householders$50,533 Black householders$53,616 American Indian and Alaska Native householders$74,641 Asian householders$58,997 Native Hawaiian and other Pacific Islander householders$54,059 Some other race householders$71,369 Two or more races householders$60,763 Hispanic or Latino race householdersMedian 2022 house value $458,756 White Non-Hispanic householders$392,121 Black or African American householders$403,013 American Indian or Alaska Native householders $473,172 Asian householders$409,420 Native Hawaiian and other Pacific Islander householders$339,902 Some other race householders$401,091 Two or more races householders$353,998 Hispanic or Latino householders
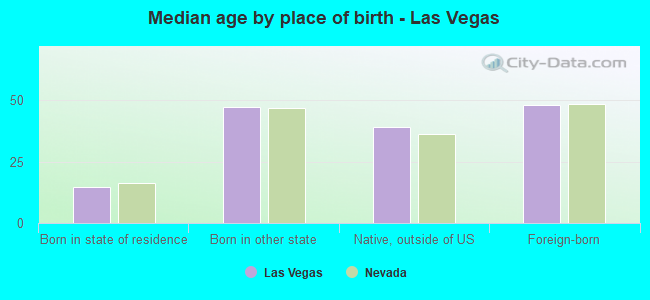
Median age by race in Las Vegas
47.1 Median age for White residents46.1 48.0 34.4 Median age for Black or African American residents32.0 36.7 34.1 Median age for American Indian / Alaska Native residents31.9 35.4 44.6 Median age for Asian residents41.7 46.0 43.2 Median age for Native Hawaiian / Pacific Islander residents34.0 43.5 31.7 Median age for Other race residents32.0 31.6 28.3 Median age for Two or more races residents28.7 27.7 50.0 Median age for White alone residents49.7 50.3 29.4 Median age for Hispanic or Latino residents28.7 29.9
Owner/renter occupied households by race in Las Vegas
House owners and renters - White residents 89,309 68.9% Owner occupied40,225 31.1% Renter occupiedHouse owners and renters - Black or African American residents 9,108 29.1% Owner occupied22,186 70.9% Renter occupiedHouse owners and renters - American Indian / Alaska Native residents 964 30.8% Owner occupied2,161 69.2% Renter occupiedHouse owners and renters - Asian residents 11,466 62.5% Owner occupied6,884 37.5% Renter occupiedHouse owners and renters - Native Hawaiian / Pacific Islander residents 1,206 72.1% Owner occupied467 27.9% Renter occupiedHouse owners and renters - Other race residents 13,269 49.6% Owner occupied13,484 50.4% Renter occupiedHouse owners and renters - Two or more races residents 18,101 55.7% Owner occupied14,393 44.3% Renter occupiedHouse owners and renters - White alone residents 85,074 69.9% Owner occupied36,575 30.1% Renter occupiedHouse owners and renters - Hispanic or Latino residents 30,173 50.9% Owner occupied29,148 49.1% Renter occupied
Language usage in Las Vegas
English speakers - Total 66.0% of residents of Las Vegas speak English at home.
25.1% of residents speak Spanish at home 91,077 58.8% Speak English very well63,718 41.2% Speak English less than very well8.9% of residents speak other language at home 37,776 69.2% Speak English very well16,808 30.8% Speak English less than very well
English speakers - Born in the United States 86.1% of residents of Las Vegas speak English at home.
11.6% of residents speak Spanish at home 31,507 84.6% Speak English very well5,726 15.4% Speak English less than very well2.4% of residents speak other language at home 6,813 89.2% Speak English very well826 10.8% Speak English less than very well
English speakers - Native, born elsewhere 61.9% of residents of Las Vegas speak English at home.
23.8% of residents speak Spanish at home 2,303 81.5% Speak English very well522 18.5% Speak English less than very well14.3% of residents speak other language at home 1,297 76.6% Speak English very well397 23.4% Speak English less than very well
English speakers - Foreign-born 13.1% of residents of Las Vegas speak English at home.
56.1% of residents speak Spanish at home 26,503 34.5% Speak English very well50,343 65.5% Speak English less than very well30.8% of residents speak other language at home 26,939 63.7% Speak English very well15,331 36.3% Speak English less than very well
White (Caucasian) - Speak only English Native:
91.9% (235,121)Foreign-born:
33.9% (8,302)
White (Caucasian) - Speak another language Native:
8.1% (20,756)Foreign-born:
66.1% (16,187)
Black or African American - Speak only English Native:
97.7% (69,108)Foreign-born:
39.3% (573)
Black or African American - Speak another language Native:
2.3% (1,592)Foreign-born:
60.7% (886)
American Indian / Alaska Native - Speak another language Native:
44.0% (2,223)Foreign-born:
100.0% (2,624)
Asian - Speak only English Native:
72.8% (12,442)Foreign-born:
11.6% (3,676)
Asian - Speak another language Native:
27.2% (4,652)Foreign-born:
88.4% (28,058)
Native Hawaiian / Pacific Islander - Speak only English Native:
73.6% (3,055)Foreign-born:
41.4% (256)
Native Hawaiian / Pacific Islander - Speak another language Native:
26.0% (1,080)Foreign-born:
62.8% (387)
Other race - Speak only English Native:
32.0% (15,584)Foreign-born:
3.6% (1,428)
Other race - Speak another language Native:
68.0% (33,123)Foreign-born:
96.4% (37,978)
Two or more races - Speak only English Native:
66.2% (52,378)Foreign-born:
10.1% (3,705)
Two or more races - Speak another language Native:
33.8% (26,699)Foreign-born:
89.9% (33,029)
White alone - Speak only English Native:
96.4% (224,378)Foreign-born:
42.9% (8,058)
White alone - Speak another language Native:
3.6% (8,440)Foreign-born:
57.1% (10,733)
Hispanic or Latino - Speak only English Native:
41.0% (50,805)Foreign-born:
5.5% (4,460)
Hispanic or Latino - Speak another language Native:
59.0% (73,081)Foreign-born:
94.5% (76,504)
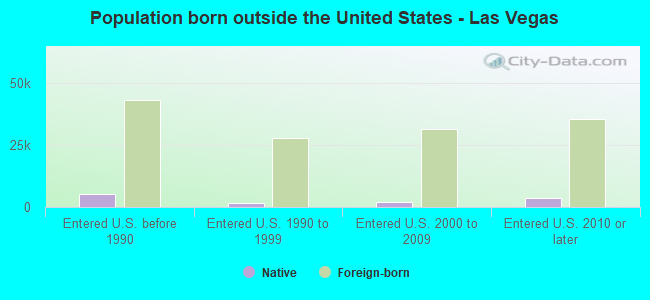
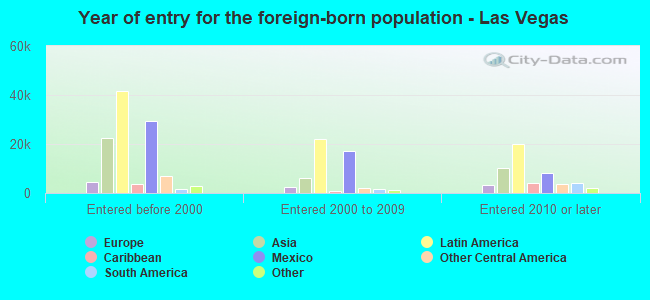
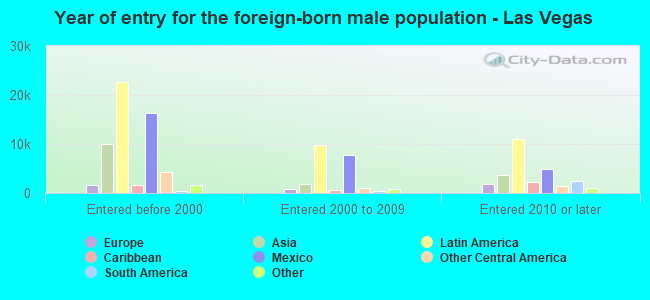
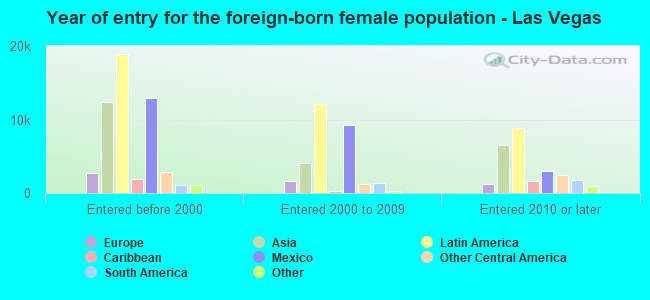
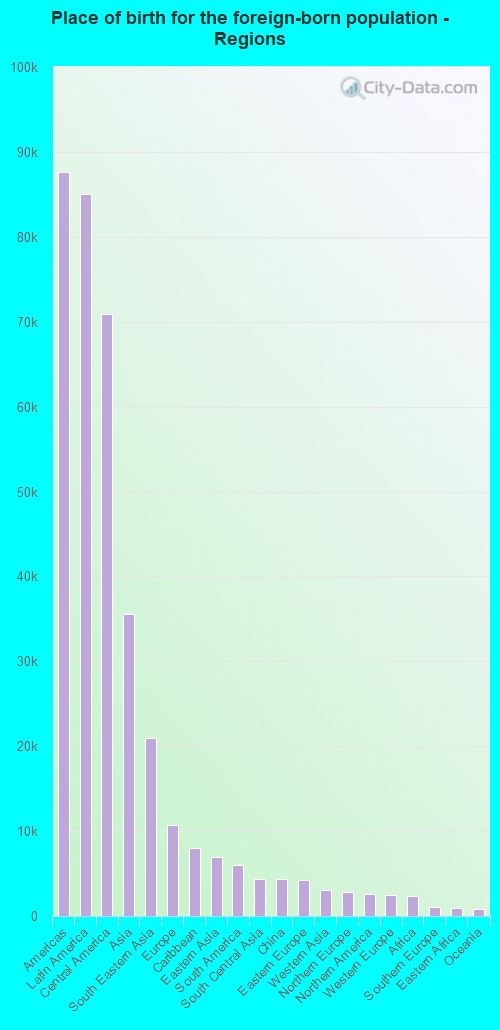
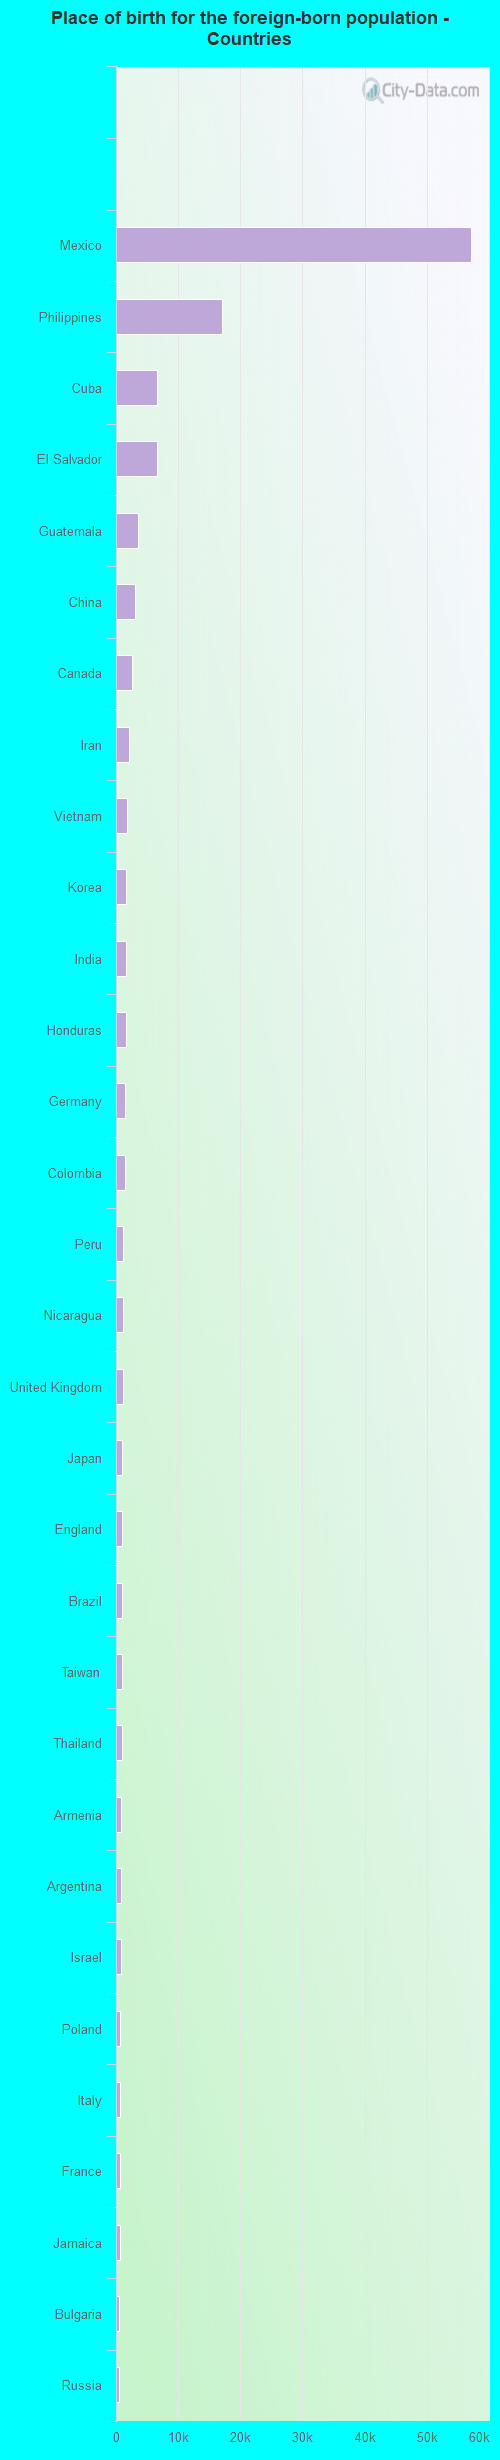
Foreign-born residents in Las Vegas 137,131 residents are foreign born (12.9% Latin America , 5.4% Asia ).
This city:
20.7%Nevada:
19.1%
Marital status for residents in Las Vegas Marital status - White (Caucasian) population 15 years and over
Males 31.1% Never married49.0% Now married1.5% Separated4.3% Widowed14.1% DivorcedFemales 26.1% Never married44.4% Now married1.2% Separated9.8% Widowed18.5% DivorcedWomen who gave birth in the past 12 months Now married:
88.1% (3,015)Unmarried:
11.9% (407)
Women who did not give birth in the past 12 months Now married:
40.5% (21,873)Unmarried:
59.5% (32,101)
Marital status - Black or African American population 15 years and over
Males 56.0% Never married27.2% Now married1.6% Separated1.1% Widowed14.2% DivorcedFemales 49.9% Never married23.0% Now married3.3% Separated7.1% Widowed16.7% DivorcedWomen who gave birth in the past 12 months Now married:
48.5% (921)Unmarried:
51.5% (977)
Women who did not give birth in the past 12 months Now married:
21.1% (4,054)Unmarried:
78.9% (15,115)
Marital status - American Indian / Alaska Native population 15 years and over
Males 51.3% Never married31.5% Now married11.4% Separated3.7% Widowed2.2% DivorcedFemales 48.4% Never married33.7% Now married0.0% Separated1.1% Widowed16.7% DivorcedWomen who gave birth in the past 12 months Now married:
64.6% (70)Unmarried:
35.4% (38)
Women who did not give birth in the past 12 months Now married:
30.8% (772)Unmarried:
69.2% (1,730)
Marital status - Asian population 15 years and over
Males 36.0% Never married51.9% Now married1.1% Separated4.7% Widowed6.3% DivorcedFemales 26.7% Never married44.9% Now married2.4% Separated11.7% Widowed14.3% DivorcedWomen who gave birth in the past 12 months Now married:
58.7% (430)Unmarried:
41.3% (302)
Women who did not give birth in the past 12 months Now married:
42.4% (5,343)Unmarried:
57.6% (7,246)
Marital status - Native Hawaiian / Pacific Islander population 15 years and over
Males 53.8% Never married36.7% Now married2.3% Separated0.6% Widowed6.7% DivorcedFemales 35.6% Never married39.0% Now married5.9% Separated4.7% Widowed14.8% DivorcedWomen who gave birth in the past 12 months Now married:
100.0% (22)Unmarried:
0.0% (0)
Women who did not give birth in the past 12 months Now married:
39.8% (579)Unmarried:
60.2% (874)
Marital status - Other race population 15 years and over
Males 45.4% Never married41.8% Now married0.5% Separated1.3% Widowed10.9% DivorcedFemales 39.3% Never married44.3% Now married4.2% Separated2.7% Widowed9.6% DivorcedWomen who gave birth in the past 12 months Now married:
72.4% (1,471)Unmarried:
27.6% (562)
Women who did not give birth in the past 12 months Now married:
42.7% (9,578)Unmarried:
57.3% (12,875)
Marital status - Two or more races population 15 years and over
Males 47.6% Never married40.5% Now married2.7% Separated1.2% Widowed8.0% DivorcedFemales 42.4% Never married39.7% Now married2.9% Separated3.9% Widowed11.0% DivorcedWomen who gave birth in the past 12 months Now married:
59.1% (823)Unmarried:
40.9% (569)
Women who did not give birth in the past 12 months Now married:
36.7% (11,980)Unmarried:
63.3% (20,697)
Marital status - White alone, not Hispanic / Latino population 15 years and over
Males 28.7% Never married50.3% Now married1.7% Separated4.7% Widowed14.5% DivorcedFemales 24.1% Never married44.7% Now married1.3% Separated10.6% Widowed19.4% DivorcedWomen who gave birth in the past 12 months Now married:
87.5% (1,960)Unmarried:
12.5% (281)
Women who did not give birth in the past 12 months Now married:
42.2% (19,445)Unmarried:
57.8% (26,687)
Marital status - Hispanic or Latino population 15 years and over
Males 47.9% Never married41.2% Now married1.6% Separated1.4% Widowed8.0% DivorcedFemales 40.3% Never married42.6% Now married2.9% Separated3.3% Widowed10.9% DivorcedWomen who gave birth in the past 12 months Now married:
73.4% (3,282)Unmarried:
26.6% (1,187)
Women who did not give birth in the past 12 months Now married:
39.6% (21,582)Unmarried:
60.4% (32,918)
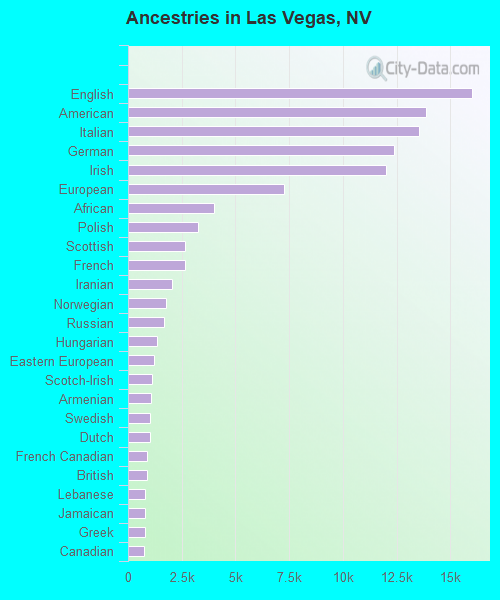
Ancestries in Las Vegas
16,003 4.2% English13,864 3.6% American13,563 3.5% Italian12,393 3.2% German11,994 3.1% Irish7,270 1.9% European4,019 1.0% African3,273 0.9% Polish2,635 0.7% Scottish2,631 0.7% French2,043 0.5% Iranian1,789 0.5% Norwegian1,687 0.4% Russian1,357 0.4% Hungarian1,231 0.3% Eastern European1,095 0.3% Scotch-Irish1,078 0.3% Armenian1,047 0.3% Swedish1,006 0.3% Dutch884 0.2% French Canadian880 0.2% British803 0.2% Lebanese793 0.2% Jamaican788 0.2% Greek760 0.2% Canadian720 0.2% Danish701 0.2% Portuguese673 0.2% Romanian562 0.1% Ukrainian527 0.1% Israeli499 0.1% Czech488 0.1% Brazilian443 0.1% Haitian408 0.1% Kenyan407 0.1% Ethiopian407 0.1% Nigerian404 0.1% Scandinavian403 0.1% Belizean383 0.10% Palestinian382 0.10% Bulgarian351 0.09% Finnish336 0.09% Serbian325 0.08% Northern European281 0.07% Iraqi259 0.07% Swiss250 0.07% Egyptian222 0.06% Welsh220 0.06% Lithuanian217 0.06% Arab207 0.05% Czechoslovakian194 0.05% Slavic189 0.05% Jordanian180 0.05% Turkish179 0.05% Slovak173 0.05% Austrian171 0.04% German Russian153 0.04% Moroccan150 0.04% Australian140 0.04% Cape Verdean119 0.03% Croatian118 0.03% South African98 0.03% Albanian96 0.03% Assyrian94 0.02% Slovene92 0.02% Yugoslavian85 0.02% Belgian83 0.02% West Indian77 0.02% Pennsylvania German76 0.02% Somali63 0.02% Afghan53 0.01% New Zealander50 0.01% Macedonian40 0.01% Liberian35 0.01% Latvian31 0.01% Basque31 0.01% Maltese30 0.01% British West Indian28 0.01% Icelander28 0.01% U.S. Virgin Islander27 0.01% Celtic25 0.01% Cajun23 0.01% Estonian
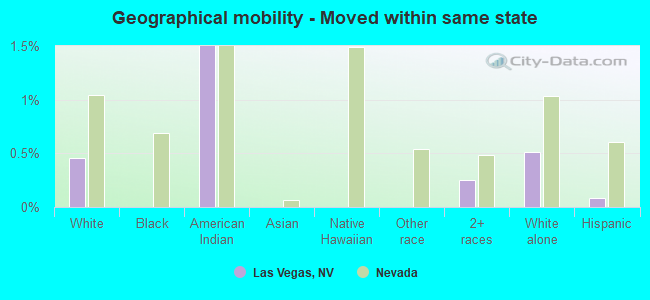
Geographical mobility in Las Vegas Same house 1 year ago 248,888 85.9% White (Caucasian)63,379 82.8% Black or African American7,816 88.6% American Indian / Alaska Native43,957 86.5% Asian4,213 82.3% Native Hawaiian / Pacific Islander83,227 89.0% Other race107,287 85.2% Two or more races222,915 86.2% White alone, not Hispanic / Latino190,851 86.8% Hispanic or LatinoMoved within same county 28,216 9.7% White / Caucasian7,674 10.0% Black or African American520 5.9% American Indian / Alaska Native4,174 8.2% Asian596 11.6% Native Hawaiian / Pacific Islander6,955 7.4% Other race12,227 9.7% Two or more races23,929 9.3% White alone, not Hispanic / Latino19,677 8.9% Hispanic or LatinoMoved within same state 1,327 0.5% White / Caucasian166 1.9% American Indian / Alaska Native314 0.2% Two or more races1,327 0.5% White alone, not Hispanic / Latino180 0.1% Hispanic or LatinoMoved from different state 10,765 3.7% White / Caucasian5,347 7.0% Black or African American167 1.9% American Indian / Alaska Native2,669 5.3% Asian200 3.9% Native Hawaiian / Pacific Islander2,519 2.7% Other race3,289 2.6% Two or more races9,699 3.8% White alone, not Hispanic / Latino5,501 2.5% Hispanic or LatinoMoved from abroad 618 0.2% White123 0.2% Black or African American102 1.2% American Indian / Alaska Native140 2.7% Native Hawaiian / Pacific Islander855 0.9% Other race2,810 2.2% Two or more races618 0.2% White alone, not Hispanic / Latino3,737 1.7% Hispanic or Latino
Children Nativity (place of birth) in Las Vegas
Children under 6 years - Living with two parents Both parents native 15,064 100.0% NativeBoth parents foreign-born 5,490 96.9% Native178 3.1% Foreign-bornOne native, one foreign-born parent 5,180 100.0% NativeChildren under 6 years - Living with one parent Native parent 14,881 100.0% NativeForeign-born parent 3,973 88.7% Native505 11.3% Foreign-bornChildren 6 to 17 years - Living with two parents Both parents native 27,054 99.5% Native140 0.5% Foreign-bornBoth parents foreign-born 13,504 83.8% Native2,603 16.2% Foreign-bornOne native, one foreign-born parent 11,382 96.3% Native432 3.7% Foreign-bornChildren 6 to 17 years - Living with one parent Native parent 27,173 100.0% NativeForeign-born parent 10,878 51.8% Native10,105 48.2% Foreign-born
Place of birth for residents in Las Vegas 87,623 Americas85,014 Latin America70,904 Central America35,594 Asia20,972 South Eastern Asia10,687 Europe8,065 Caribbean7,003 Eastern Asia6,044 South America4,407 South Central Asia4,323 China4,265 Eastern Europe3,090 Western Asia2,830 Northern Europe2,608 Northern America2,479 Western Europe2,395 Africa1,069 Southern Europe896 Eastern Africa830 Oceania621 Northern Africa499 Australia and New Zealand Subregion478 Western Africa187 Southern Africa29 Middle Africa57,181 Mexico17,123 Philippines6,669 Cuba6,570 El Salvador3,620 Guatemala3,097 China2,608 Canada2,149 Iran1,783 Vietnam1,611 Korea1,588 India1,559 Honduras1,425 Germany1,395 Colombia1,186 Peru1,160 Nicaragua1,084 United Kingdom1,025 Japan1,013 England1,012 Brazil992 Taiwan975 Thailand835 Armenia830 Argentina813 Israel631 Poland628 Italy615 France597 Jamaica562 Bulgaria549 Russia500 Ukraine451 Romania434 Chile424 Ecuador421 Belize393 Hungary379 Iraq372 Lebanon361 Dominican Republic353 Australia337 Ethiopia321 Venezuela291 Bolivia273 Kenya271 Egypt264 Malaysia252 Laos250 Indonesia241 Jordan234 Costa Rica233 Greece233 Hong Kong230 Netherlands211 Morocco200 Uzbekistan200 Serbia197 Nigeria196 Cambodia193 Haiti193 Turkey193 Ireland190 Pakistan187 South Africa181 Scotland164 Albania159 Spain158 Panama146 New Zealand130 Senegal113 Zimbabwe113 Czechoslovakia112 Denmark112 Nepal107 Singapore91 Austria90 Eritrea84 Croatia81 Moldova78 Bahamas73 Sweden72 Georgia71 Lithuania70 Fiji68 Belgium68 Ivory Coast62 Bosnia and Herzegovina62 Belarus59 North Macedonia (Macedonia)59 Uruguay52 Saudi Arabia52 Kazakhstan51 Sri Lanka44 Latvia43 Afghanistan40 Switzerland39 Trinidad and Tobago38 Portugal38 Algeria32 United Arab Emirates30 Syria29 Sudan29 Somalia28 Norway23 Guyana22 Barbados19 Burma (Myanmar)19 West Indies18 Cameroon14 Uganda14 Ghana12 Kuwait8 Tanzania6 Micronesia3 Marshall Islands
Grandparents responsible for own grandchildren in Las Vegas
Grandparents (30 to 59 years) White / Caucasian 1,353 47.0% Responsible for grandchildren1,523 53.0% Not responsible for grandchildrenBlack or African American 914 44.9% Responsible for grandchildren1,120 55.1% Not responsible for grandchildrenAmerican Indian / Alaska Native 34 28.8% Responsible for grandchildren83 71.2% Not responsible for grandchildrenAsian 133 42.3% Responsible for grandchildren181 57.7% Not responsible for grandchildrenNative Hawaiian / Pacific Islander 50 84.5% Responsible for grandchildren9 15.5% Not responsible for grandchildrenOther race 1,950 50.4% Responsible for grandchildren1,921 49.6% Not responsible for grandchildrenTwo or more races 422 19.5% Responsible for grandchildren1,747 80.5% Not responsible for grandchildrenWhite alone, not Hispanic / Latino 1,353 51.3% Responsible for grandchildren1,286 48.7% Not responsible for grandchildrenHispanic or Latino 2,372 37.1% Responsible for grandchildren4,015 62.9% Not responsible for grandchildrenGrandparents (60 years and over) White / Caucasian 772 22.8% Responsible for grandchildren2,609 77.2% Not responsible for grandchildrenBlack or African American 976 51.1% Responsible for grandchildren935 48.9% Not responsible for grandchildrenAmerican Indian / Alaska Native 57 18.2% Responsible for grandchildren257 81.8% Not responsible for grandchildrenAsian 126 11.4% Responsible for grandchildren977 88.6% Not responsible for grandchildrenNative Hawaiian / Pacific Islander 5 5.2% Responsible for grandchildren84 94.8% Not responsible for grandchildrenOther race 1,237 100.0% Not responsible for grandchildrenTwo or more races 241 10.1% Responsible for grandchildren2,135 89.9% Not responsible for grandchildrenWhite alone, not Hispanic / Latino 715 22.3% Responsible for grandchildren2,493 77.7% Not responsible for grandchildrenHispanic or Latino 189 5.0% Responsible for grandchildren3,588 95.0% Not responsible for grandchildren
Zip codes: 89030 , 89101 , 89102 , 89104 , 89106 , 89107 , 89108 , 89109 , 89110 , 89117 , 89128 , 89129 , 89130 , 89131 , 89134 , 89135 , 89138 , 89143 , 89144 , 89145 , 89146 , 89149 , 89166 .