Crime rate in Dallas, Texas (TX): murders, rapes, robberies, assaults, burglaries, thefts, auto thefts, arson, law enforcement employees, police officers, crime map
Crime rate in Dallas, TX
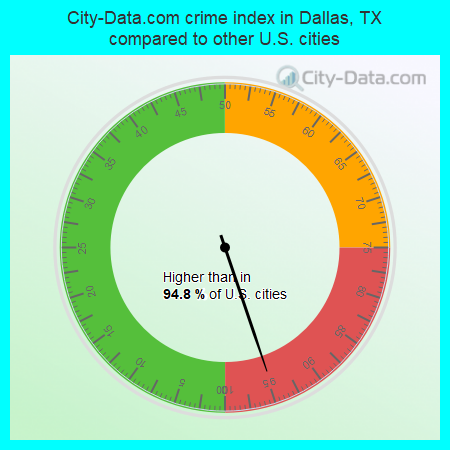
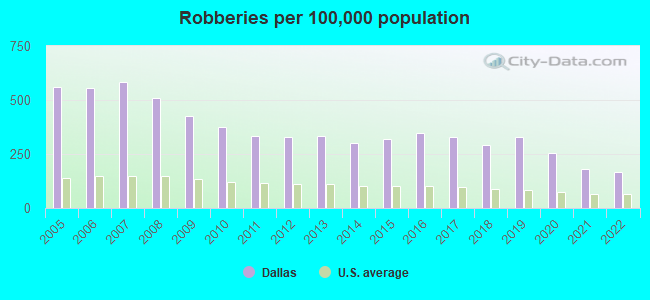
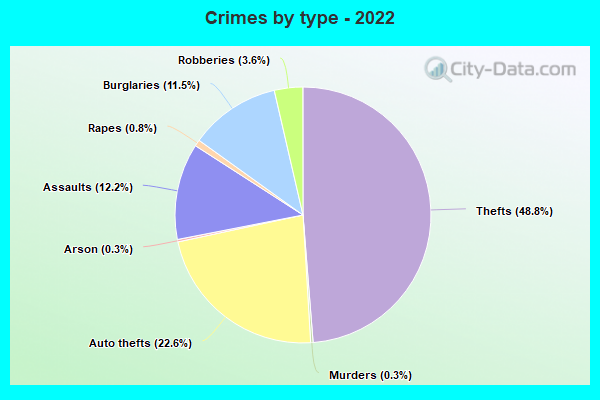
The 2022 crime rate in Dallas, TX is 427 (City-Data.com crime index), which is 1.7 times higher than the U.S. average. It was higher than in 94.8% U.S. cities. The 2022 Dallas crime rate rose by 0% compared to 2021. The number of homicides stood at 157 - a decrease of 52 compared to 2021. In the last 5 years Dallas has seen rise of violent crime and increasing property crime.(Note: Higher means more crime)
| Dallas: | 427.1 |
| Highland Park: | 126.5 |
| University Park: | 91.0 |
| Cockrell Hill: | 175.8 |
| Mesquite: | 325.4 |
| Farmers Branch: | 289.2 |
| Irving: | 241.7 |
| Addison: | 561.3 |
| Balch Springs: | 323.3 |
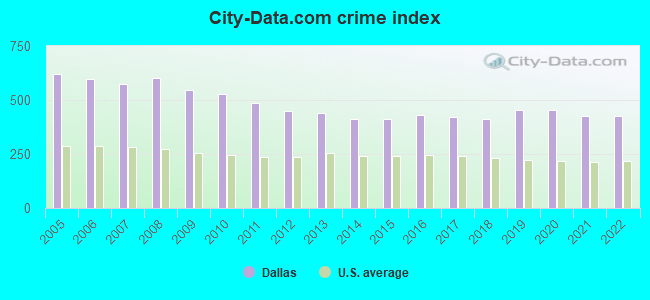
The City-Data.com crime index weighs serious crimes and violent crimes more heavily. Higher means more crime, U.S. average is 246.1. It adjusts for the number of visitors and daily workers commuting into cities.
- means the value is about the same as the state average.- means the value is bigger than the state average.
- means the value is much bigger than the state average.
According to our research of Texas and other state lists, there were 4,271 registered sex offenders living in Dallas, Texas as of April 27, 2024.
The ratio of all residents to sex offenders in Dallas is 309 to 1.
Violent crime rate in 2022
| Dallas: | 426.6 |
| U.S. Average: | 219.8 |
Violent crime rate in 2021
| Dallas: | 458.7 |
| U.S. Average: | 224.8 |
Violent crime rate in 2020
| Dallas: | 499.8 |
| U.S. Average: | 228.2 |
Violent crime rate in 2019
| Dallas: | 484.6 |
| U.S. Average: | 219.9 |
Violent crime rate in 2018
| Dallas: | 424.5 |
| U.S. Average: | 221.2 |
Violent crime rate in 2017
| Dallas: | 437.1 |
| U.S. Average: | 226.2 |
Violent crime rate in 2016
| Dallas: | 429.7 |
| U.S. Average: | 227.3 |
Violent crime rate in 2015
| Dallas: | 392.8 |
| U.S. Average: | 219.3 |
Violent crime rate in 2014
| Dallas: | 376.7 |
| U.S. Average: | 211.1 |
Violent crime rate in 2013
| Dallas: | 370.6 |
| U.S. Average: | 214.2 |
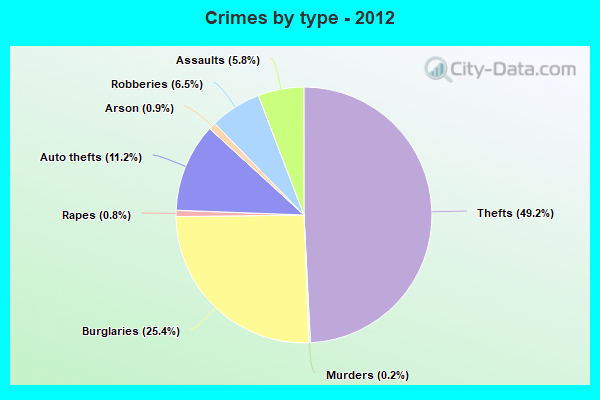
Violent crime rate in 2012
| Dallas: | 375.7 |
| U.S. Average: | 187.4 |
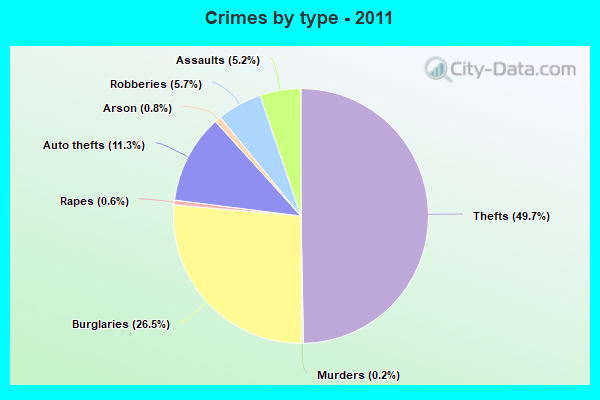
Violent crime rate in 2011
| Dallas: | 374.4 |
| U.S. Average: | 187.1 |
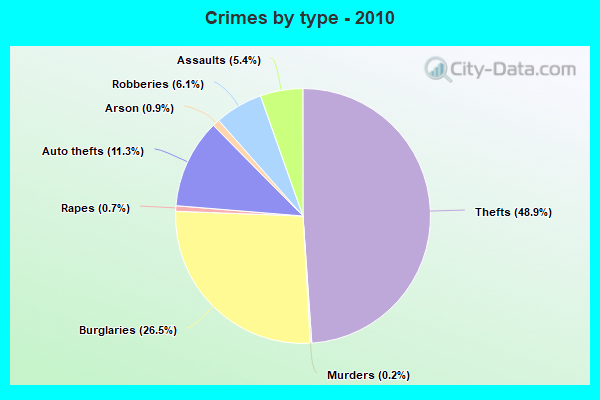
Violent crime rate in 2010
| Dallas: | 422.0 |
| U.S. Average: | 195.7 |
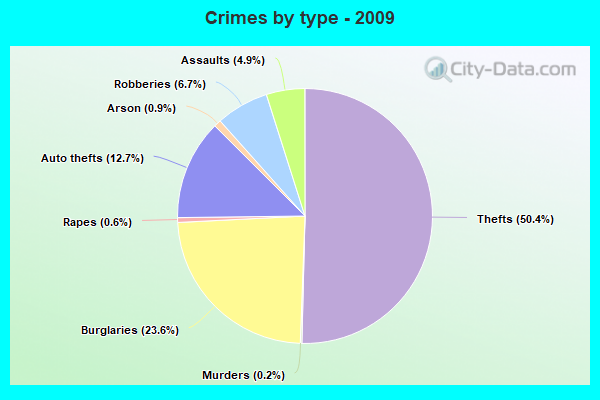
Violent crime rate in 2009
| Dallas: | 434.2 |
| U.S. Average: | 208.9 |
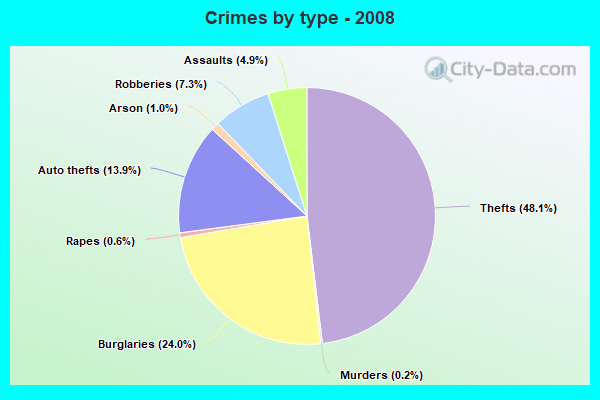
Violent crime rate in 2008
| Dallas: | 486.9 |
| U.S. Average: | 222.5 |
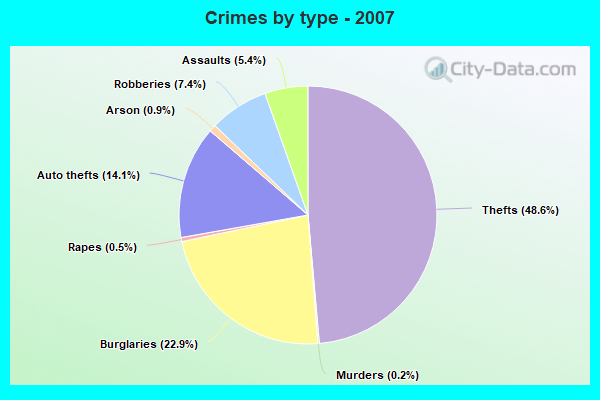
Violent crime rate in 2007
| Dallas: | 475.9 |
| U.S. Average: | 229.1 |
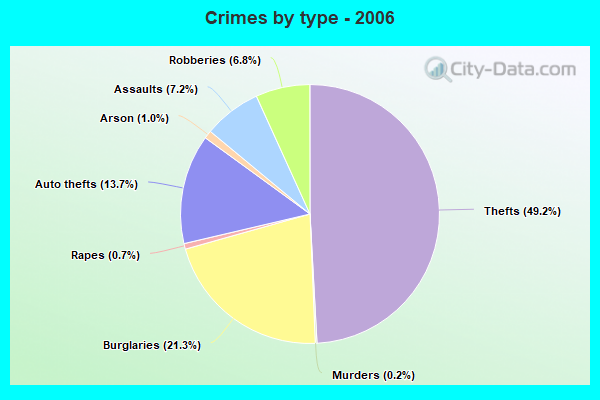
Violent crime rate in 2006
| Dallas: | 535.8 |
| U.S. Average: | 232.6 |
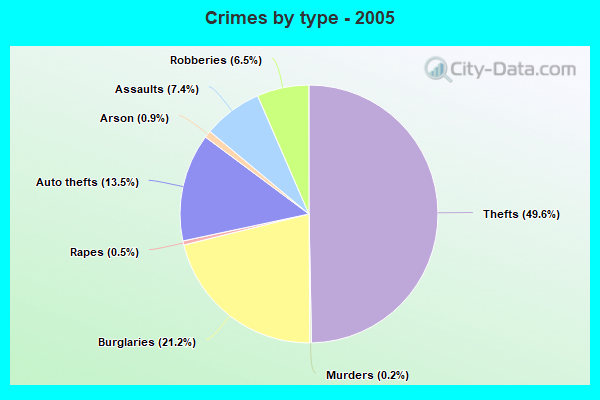
Violent crime rate in 2005
| Dallas: | 554.1 |
| U.S. Average: | 227.0 |
Property crime rate in 2022
| Dallas: | 373.8 |
| U.S. Average: | 166.5 |
Property crime rate in 2021
| Dallas: | 337.9 |
| U.S. Average: | 157.8 |
Property crime rate in 2020
| Dallas: | 352.5 |
| U.S. Average: | 169.6 |
Property crime rate in 2019
| Dallas: | 347.8 |
| U.S. Average: | 179.7 |
Property crime rate in 2018
| Dallas: | 334.0 |
| U.S. Average: | 190.2 |
Property crime rate in 2017
| Dallas: | 329.0 |
| U.S. Average: | 206.4 |
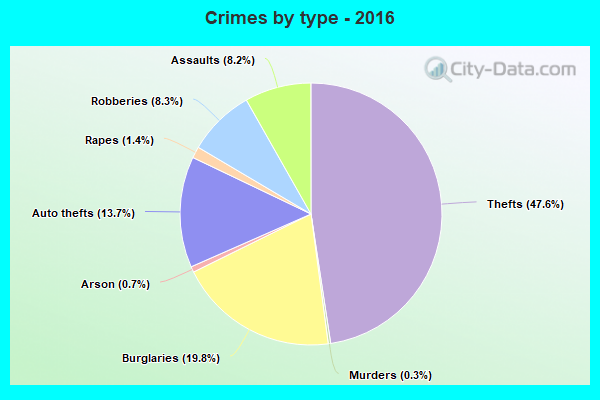
Property crime rate in 2016
| Dallas: | 351.8 |
| U.S. Average: | 216.6 |
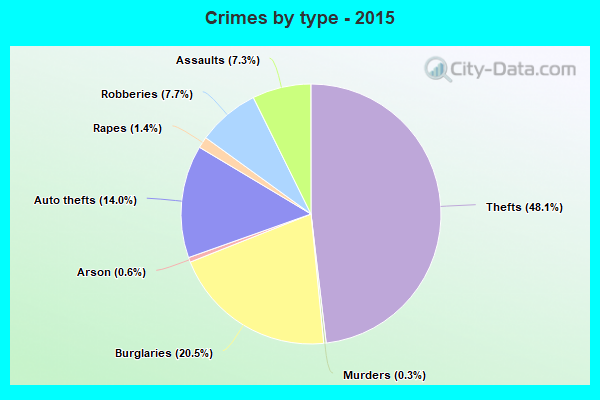
Property crime rate in 2015
| Dallas: | 358.5 |
| U.S. Average: | 221.5 |
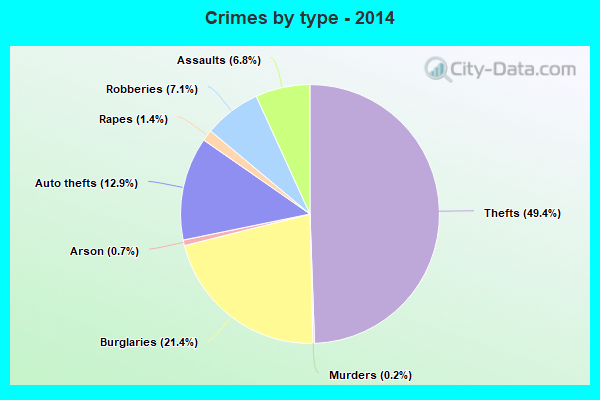
Property crime rate in 2014
| Dallas: | 372.6 |
| U.S. Average: | 230.8 |
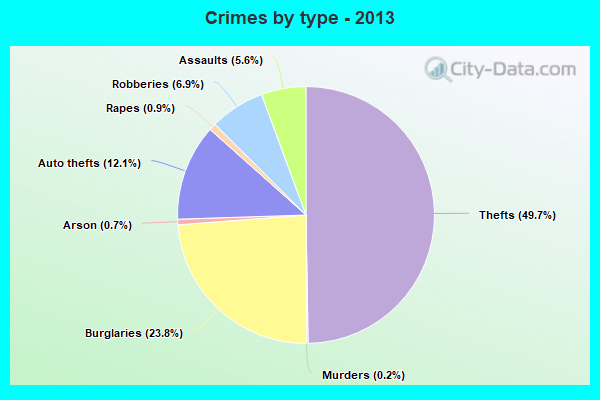
Property crime rate in 2013
| Dallas: | 440.6 |
| U.S. Average: | 250.4 |
Property crime rate in 2012
| Dallas: | 470.0 |
| U.S. Average: | 267.3 |
Property crime rate in 2011
| Dallas: | 547.9 |
| U.S. Average: | 273.5 |
Property crime rate in 2010
| Dallas: | 583.0 |
| U.S. Average: | 276.4 |
Property crime rate in 2009
| Dallas: | 583.4 |
| U.S. Average: | 285.6 |
Property crime rate in 2008
| Dallas: | 641.0 |
| U.S. Average: | 302.2 |
Property crime rate in 2007
| Dallas: | 593.2 |
| U.S. Average: | 309.2 |
Property crime rate in 2006
| Dallas: | 587.0 |
| U.S. Average: | 317.3 |
Property crime rate in 2005
| Dallas: | 616.2 |
| U.S. Average: | 322.3 |
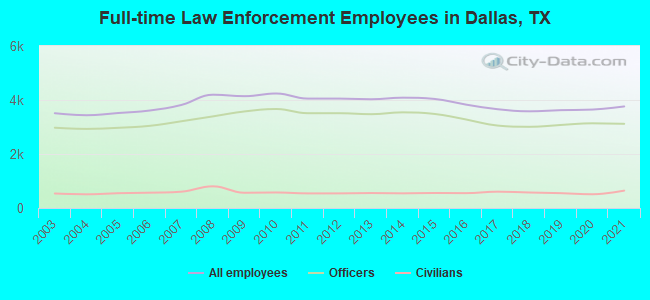
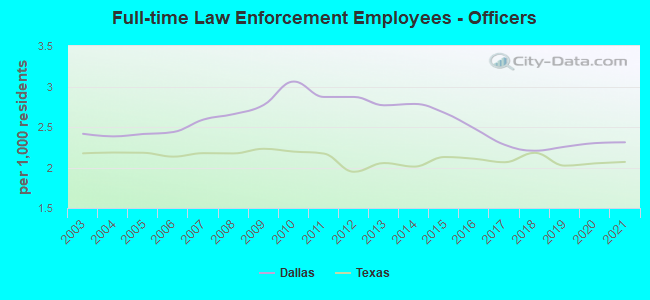
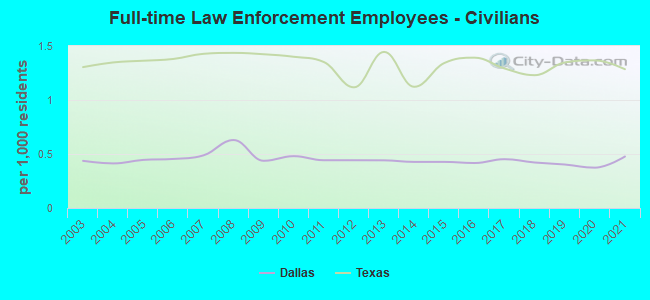
Full-time law enforcement employees in 2021, including police officers: 3,761 (3,118 officers - 2,525 male; 593 female).
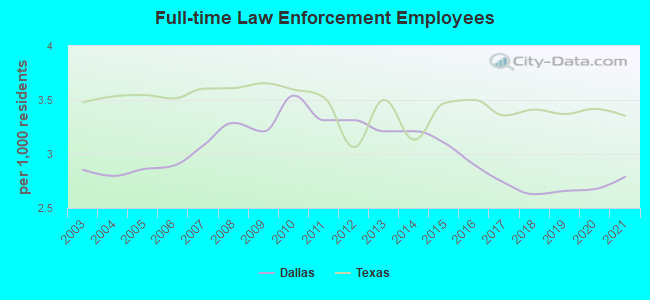
| Officers per 1,000 residents here: | 2.31 |
| Texas average: | 2.07 |
Full-time law enforcement employees in 2020, including police officers: 3,646 (3,137 officers - 2,540 male; 597 female).
| Officers per 1,000 residents here: | 2.30 |
| Texas average: | 2.05 |
Full-time law enforcement employees in 2019, including police officers: 3,624 (3,075 officers - 2,496 male; 579 female).
| Officers per 1,000 residents here: | 2.26 |
| Texas average: | 2.02 |
Full-time law enforcement employees in 2018, including police officers: 3,581 (3,007 officers - 2,440 male; 567 female).
| Officers per 1,000 residents here: | 2.21 |
| Texas average: | 2.18 |
Full-time law enforcement employees in 2017, including police officers: 3,658 (3,053 officers - 2,484 male; 569 female).
| Officers per 1,000 residents here: | 2.28 |
| Texas average: | 2.06 |
Full-time law enforcement employees in 2016, including police officers: 3,829 (3,279 officers - 2,666 male; 613 female).
| Officers per 1,000 residents here: | 2.48 |
| Texas average: | 2.11 |
Full-time law enforcement employees in 2015, including police officers: 4,040 (3,484 officers - 2,844 male; 640 female).
| Officers per 1,000 residents here: | 2.68 |
| Texas average: | 2.13 |
Full-time law enforcement employees in 2014, including police officers: 4,086 (3,543 officers - 2,918 male; 625 female).
| Officers per 1,000 residents here: | 2.78 |
| Texas average: | 2.01 |
Full-time law enforcement employees in 2013, including police officers: 4,028 (3,474 officers - 2,868 male; 606 female).
| Officers per 1,000 residents here: | 2.77 |
| Texas average: | 2.05 |
Full-time law enforcement employees in 2011, including police officers: 4,052 (3,511 officers - 2,923 male; 588 female).
| Officers per 1,000 residents here: | 2.87 |
| Texas average: | 2.17 |
Full-time law enforcement employees in 2010, including police officers: 4,241 (3,666 officers - 3,051 male; 615 female).
| Officers per 1,000 residents here: | 3.06 |
| Texas average: | 2.20 |
Full-time law enforcement employees in 2009, including police officers: 4,141 (3,577 officers - 2,979 male; 598 female).
| Officers per 1,000 residents here: | 2.77 |
| Texas average: | 2.23 |
Full-time law enforcement employees in 2008, including police officers: 4,196 (3,393 officers - 2,818 male; 575 female).
| Officers per 1,000 residents here: | 2.66 |
| Texas average: | 2.17 |
Full-time law enforcement employees in 2007, including police officers: 3,816 (3,212 officers - 2,673 male; 539 female).
| Officers per 1,000 residents here: | 2.59 |
| Texas average: | 2.18 |
Full-time law enforcement employees in 2006, including police officers: 3,610 (3,043 officers - 2,522 male; 521 female).
| Officers per 1,000 residents here: | 2.44 |
| Texas average: | 2.13 |
Full-time law enforcement employees in 2005, including police officers: 3,518 (2,970 officers - 2,450 male; 520 female).
| Officers per 1,000 residents here: | 2.41 |
| Texas average: | 2.18 |
Full-time law enforcement employees in 2004, including police officers: 3,436 (2,929 officers - 2,430 male; 499 female).
| Officers per 1,000 residents here: | 2.38 |
| Texas average: | 2.19 |
Full-time law enforcement employees in 2003, including police officers: 3,510 (2,973 officers - 2,474 male; 499 female).
| Officers per 1,000 residents here: | 2.42 |
| Texas average: | 2.17 |
Zip codes: 75032, 75039, 75041, 75043, 75060, 75061, 75062, 75075, 75080, 75081, 75087, 75088, 75089, 75098, 75116, 75126, 75134, 75141, 75150, 75166, 75182, 75201, 75202, 75203, 75204, 75205, 75206, 75207, 75208, 75209, 75210, 75212, 75214, 75215, 75216, 75218, 75219, 75220, 75223, 75224, 75225, 75226, 75227, 75228, 75229, 75230, 75231, 75232, 75233, 75234, 75235, 75236, 75237, 75238, 75240, 75241, 75243, 75246, 75247, 75251, 75252, 75270, 75390.