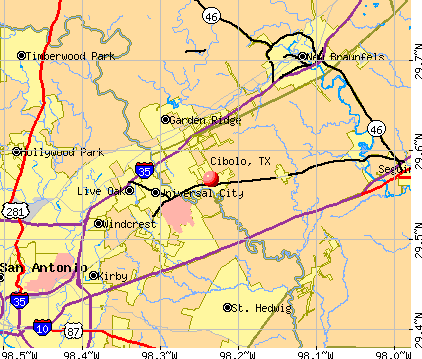
Cibolo, Texas
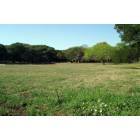
Cibolo: Deer Creek
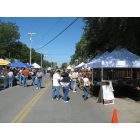
Cibolo: Cibolo Fest
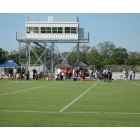
Cibolo: Multi Use Facility - Soccer
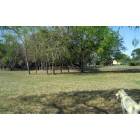
Cibolo: Deer Creek Park
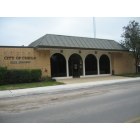
Cibolo: Current police station
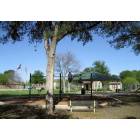
Cibolo: Deer Creek Park
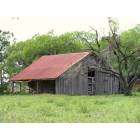
Cibolo: Rustic Barn. This barn belonged to the Borgfeld's and was taken in May 2006.

Cibolo: Taken at the Longhorn Ranch on 1103
- add
your
Submit your own pictures of this city and show them to the world
- OSM Map
- General Map
- Google Map
- MSN Map
Population change since 2000: +1047.1%
| Males: 17,754 | |
| Females: 17,060 |
| Median resident age: | 36.3 years |
| Texas median age: | 35.6 years |
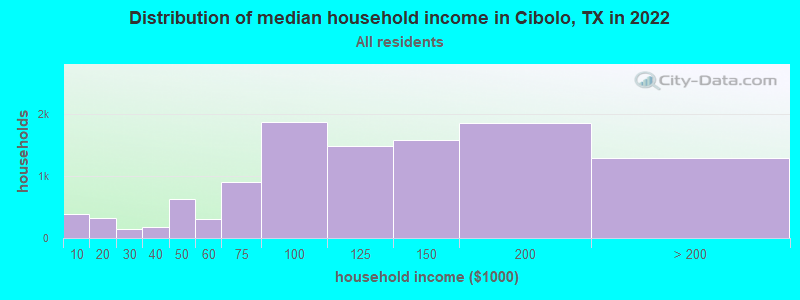
| Cibolo: | $115,081 |
| TX: | $72,284 |
Estimated per capita income in 2022: $39,907 (it was $23,988 in 2000)
Cibolo city income, earnings, and wages data
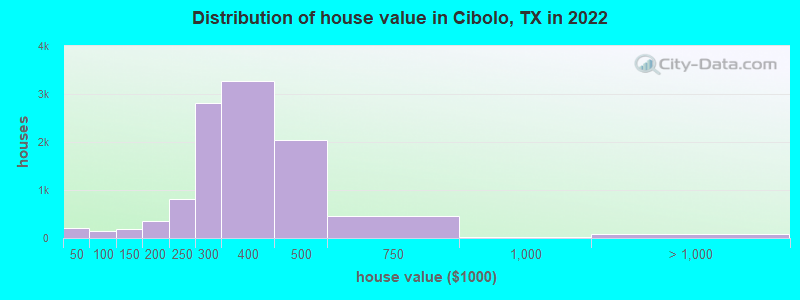
Estimated median house or condo value in 2022: $333,095 (it was $120,100 in 2000)
| Cibolo: | $333,095 |
| TX: | $275,400 |
Mean prices in 2022: all housing units: $342,459; detached houses: $349,159; townhouses or other attached units: $151,589; mobile homes: $137,174
Median gross rent in 2022: $2,428.
(3.9% for White Non-Hispanic residents, 1.6% for Black residents, 2.9% for Hispanic or Latino residents, 2.3% for American Indian residents, 11.3% for other race residents, 4.4% for two or more races residents)
Detailed information about poverty and poor residents in Cibolo, TX

Compare current foreclosures near Cibolo, TX:
| Photo | Address | Area | Beds / Baths | Price | Details |
|---|---|---|---|---|---|

|
#1
Turning Stone
Cibolo, TX 78108
|
4,005 sq. feet
|
4 baths 5 beds |
$619,900
|
show details |

|
#2
Vista Del Rey
Cibolo, TX 78108
|
2,396 sq. feet
|
2 baths 4 beds |
show details | |

|
#3
Tranquil Vw
Cibolo, TX 78108
|
- sq. feet
|
3 baths 4 beds |
show details | |

|
#4
Silver Fox
Cibolo, TX 78108
|
- sq. feet
|
2 baths 3 beds |
show details | |

|
#5
Clearbrook Ave
Cibolo, TX 78108
|
- sq. feet
|
2 baths 4 beds |
show details | |

|
#6
Canyon Vis
Cibolo, TX 78108
|
2,544 sq. feet
|
2 baths 4 beds |
show details | |

|
#7
Arcadia Pl
Cibolo, TX 78108
|
1,710 sq. feet
|
2 baths 4 beds |
show details | |

|
#8
Redtip Dr
Cibolo, TX 78108
|
1,706 sq. feet
|
2 baths 3 beds |
show details | |

|
#9
Springtree Shadow
Cibolo, TX 78108
|
3,154 sq. feet
|
2 baths 4 beds |
show details | |

|
#10
Longhorn Way
Cibolo, TX 78108
|
1,375 sq. feet
|
2 baths - beds |
show details |
| Photo | Address | Area | Beds / Baths | Price | Details |
|---|---|---|---|---|---|

|
#11
Cherry Tree Dr
Cibolo, TX 78108
|
2,160 sq. feet
|
2 baths - beds |
show details | |

|
#12
Cliffside Dr
Cibolo, TX 78108
|
- sq. feet
|
- baths - beds |
show details | |

|
#13
Nomad Ln
Cibolo, TX 78108
|
- sq. feet
|
- baths - beds |
show details | |

|
#14
Mineral Spgs
Cibolo, TX 78108
|
- sq. feet
|
- baths - beds |
show details | |

|
#15
Cavan
Cibolo, TX 78108
|
- sq. feet
|
- baths - beds |
show details | |

|
#16
Springtree Blf
Cibolo, TX 78108
|
3,278 sq. feet
|
- baths - beds |
show details | |

|
#17
Somerset Ave, Apt 313
Cibolo, TX 78108
|
- sq. feet
|
- baths - beds |
show details | |

|
#18
War Admiral
Cibolo, TX 78108
|
- sq. feet
|
- baths - beds |
show details | |

|
#19
Ramblas
Cibolo, TX 78108
|
- sq. feet
|
- baths - beds |
show details | |

|
#20
Falling Oak
Cibolo, TX 78108
|
- sq. feet
|
- baths - beds |
show details |
| Photo | Address | Area | Beds / Baths | Price | Details |
|---|---|---|---|---|---|

|
#21
Padova
Cibolo, TX 78108
|
- sq. feet
|
- baths - beds |
show details | |

|
#22
Whisper Blf
Cibolo, TX 78108
|
- sq. feet
|
- baths - beds |
show details | |

|
#23
Somerset Ave, Apt 316
Cibolo, TX 78108
|
- sq. feet
|
- baths - beds |
show details | |

|
#24
Wimbledon Dr
Cibolo, TX 78108
|
- sq. feet
|
- baths - beds |
show details | |

|
#25
Tirrema
Cibolo, TX 78108
|
- sq. feet
|
- baths - beds |
show details | |

|
#26
Blue Sage Ln
Cibolo, TX 78108
|
1,921 sq. feet
|
- baths - beds |
show details | |

|
#27
Fawndale Pt
Cibolo, TX 78108
|
- sq. feet
|
- baths - beds |
show details | |

|
#28
Rawhide Way
Cibolo, TX 78108
|
- sq. feet
|
- baths - beds |
show details | |

|
#29
Morningside Pl
Schertz, TX 78154
|
2,109 sq. feet
|
2 baths 3 beds |
$389,900
|
show details |

|
#30
Sunrise Pass
San Antonio, TX 78244
|
912 sq. feet
|
1 baths 3 beds |
$40,600
|
show details |
| Photo | Address | Area | Beds / Baths | Price | Details |
|---|---|---|---|---|---|

|
#31
Tractor Pass
Schertz, TX 78154
|
1,873 sq. feet
|
2 baths 3 beds |
$329,900
|
show details |

|
#32
Woodstone Pt
Cibolo, TX 78108
|
- sq. feet
|
- baths - beds |
show details | |

|
#33
Dixon Ridge Dr
San Antonio, TX 78239
|
1,104 sq. feet
|
2 baths 3 beds |
show details | |

|
#34
Mystic Sunrise Dr
San Antonio, TX 78244
|
925 sq. feet
|
1 baths 2 beds |
show details | |

|
#35
Primrose Way
New Braunfels, TX 78132
|
- sq. feet
|
2 baths 3 beds |
show details | |

|
#36
Baywood Crest
San Antonio, TX 78222
|
1,247 sq. feet
|
3 baths 3 beds |
show details | |

|
#37
Homecrest Dr
La Vernia, TX 78121
|
2,400 sq. feet
|
4 baths 4 beds |
show details | |

|
#38
Ravina St
San Antonio, TX 78222
|
1,502 sq. feet
|
3 baths 3 beds |
show details | |

|
#39
Mystic Sunrise Dr
San Antonio, TX 78244
|
1,744 sq. feet
|
2 baths 4 beds |
show details | |

|
#40
Bear Br
San Antonio, TX 78222
|
1,784 sq. feet
|
3 baths 4 beds |
show details |
| Photo | Address | Area | Beds / Baths | Price | Details |
|---|---|---|---|---|---|

|
#41
Stockport
San Antonio, TX 78239
|
1,729 sq. feet
|
2 baths 3 beds |
show details | |

|
#42
Rotary
San Antonio, TX 78202
|
1,080 sq. feet
|
1 baths 3 beds |
show details | |

|
#43
Glacier Lk
San Antonio, TX 78222
|
- sq. feet
|
2 baths 3 beds |
show details | |

|
#44
Espada Point
San Antonio, TX 78222
|
- sq. feet
|
2 baths 4 beds |
show details | |

|
#45
Paso Rio Crk
San Antonio, TX 78247
|
1,926 sq. feet
|
2 baths 3 beds |
show details | |

|
#46
Archers Coach
San Antonio, TX 78244
|
1,605 sq. feet
|
2 baths 3 beds |
show details | |

|
#47
Avenue A
Converse, TX 78109
|
- sq. feet
|
2 baths 3 beds |
show details | |

|
#48
De Palma
San Antonio, TX 78239
|
1,162 sq. feet
|
2 baths 3 beds |
show details | |

|
#49
Ayers Dr
Seguin, TX 78155
|
- sq. feet
|
2 baths 4 beds |
show details | |

|
Check over 1 million property listings on Foreclosure.com!
|
browse all offers | |||


- 15,74045.9%White alone
- 9,70028.3%Hispanic
- 4,75513.9%Black alone
- 2,4397.1%Two or more races
- 1,4044.1%Asian alone
- 1290.4%Other race alone
- 400.1%American Indian alone
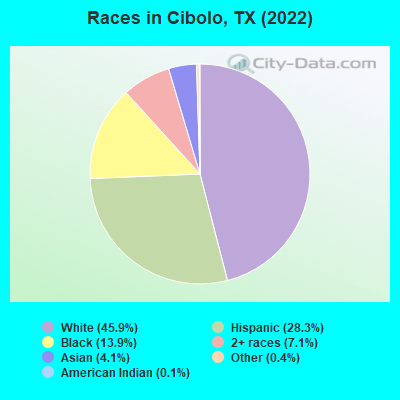
Races in Cibolo detailed stats: ancestries, foreign born residents, place of birth
According to our research of Texas and other state lists, there were 16 registered sex offenders living in Cibolo, Texas as of April 29, 2024.
The ratio of all residents to sex offenders in Cibolo is 1,664 to 1.
The ratio of registered sex offenders to all residents in this city is much lower than the state average.
Type |
2009 |
2010 |
2011 |
2012 |
2013 |
2014 |
2015 |
2016 |
2017 |
2018 |
2019 |
2020 |
2021 |
2022 |
|---|---|---|---|---|---|---|---|---|---|---|---|---|---|---|
| Murders (per 100,000) | 1 (5.8) | 0 (0.0) | 0 (0.0) | 1 (6.2) | 0 (0.0) | 0 (0.0) | 0 (0.0) | 0 (0.0) | 1 (3.4) | 0 (0.0) | 0 (0.0) | 0 (0.0) | 0 (0.0) | 0 (0.0) |
| Rapes (per 100,000) | 2 (11.6) | 4 (26.1) | 7 (44.7) | 4 (24.9) | 3 (13.8) | 1 (4.0) | 6 (22.5) | 3 (10.7) | 11 (37.5) | 10 (32.5) | 9 (28.0) | 10 (30.5) | 12 (34.2) | 14 (41.0) |
| Robberies (per 100,000) | 3 (17.4) | 1 (6.5) | 2 (12.8) | 1 (6.2) | 3 (13.8) | 3 (12.1) | 1 (3.8) | 4 (14.2) | 6 (20.5) | 1 (3.3) | 1 (3.1) | 4 (12.2) | 2 (5.7) | 3 (8.8) |
| Assaults (per 100,000) | 12 (69.4) | 12 (78.2) | 12 (76.6) | 17 (105.7) | 10 (46.1) | 11 (44.3) | 17 (63.8) | 17 (60.5) | 13 (44.3) | 26 (84.5) | 29 (90.3) | 25 (76.3) | 13 (37.0) | 28 (82.0) |
| Burglaries (per 100,000) | 36 (208.2) | 36 (234.5) | 32 (204.2) | 52 (323.2) | 44 (202.9) | 65 (261.6) | 47 (176.3) | 31 (110.4) | 34 (115.9) | 35 (113.8) | 36 (112.1) | 43 (131.2) | 47 (133.8) | 108 (316.2) |
| Thefts (per 100,000) | 130 (751.8) | 153 (996.8) | 162 (1,034) | 184 (1,144) | 181 (834.5) | 206 (829.1) | 204 (765.3) | 253 (901.1) | 235 (801.4) | 226 (734.5) | 233 (725.6) | 209 (637.6) | 224 (637.5) | 353 (1,033) |
| Auto thefts (per 100,000) | 14 (81.0) | 5 (32.6) | 10 (63.8) | 6 (37.3) | 8 (36.9) | 12 (48.3) | 16 (60.0) | 18 (64.1) | 14 (47.7) | 10 (32.5) | 13 (40.5) | 19 (58.0) | 43 (122.4) | 39 (114.2) |
| Arson (per 100,000) | 2 (11.6) | 1 (6.5) | 0 (0.0) | 0 (0.0) | 1 (4.6) | 3 (12.1) | 2 (7.5) | 1 (3.6) | 1 (3.4) | 1 (3.3) | 0 (0.0) | 0 (0.0) | 3 (8.5) | 0 (0.0) |
| City-Data.com crime index | 91.0 | 97.3 | 115.6 | 126.7 | 75.0 | 71.0 | 79.6 | 73.8 | 95.8 | 83.8 | 81.5 | 82.6 | 81.1 | 124.4 |
The City-Data.com crime index weighs serious crimes and violent crimes more heavily. Higher means more crime, U.S. average is 246.1. It adjusts for the number of visitors and daily workers commuting into cities.
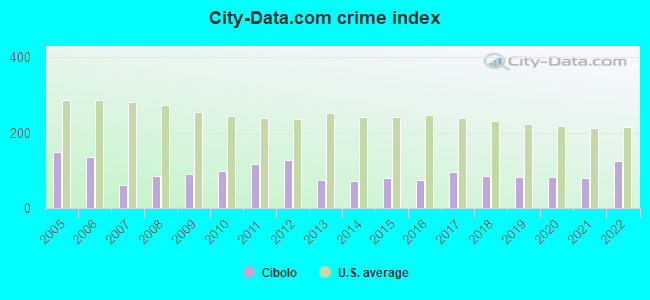
Crime rate in Cibolo detailed stats: murders, rapes, robberies, assaults, burglaries, thefts, arson
Full-time law enforcement employees in 2021, including police officers: 46 (41 officers - 38 male; 3 female).
| Officers per 1,000 residents here: | 1.17 |
| Texas average: | 2.07 |
 Recent articles from our blog. Our writers, many of them Ph.D. graduates or candidates, create easy-to-read articles on a wide variety of topics.

 | T-Mobile signal strength in Cibolo and Schertz (3 replies) |
| Relocating to SA - Stone Oak/Schertz/Cibolo (10 replies) |
| SA I Know You Won't Disappoint (62 replies) |
| New Santikos entertainment complex coming to Cibolo (10 replies) |
| Help us find an area to live please (16 replies) |
| Job in Schertz - where to live with young kids? (3 replies) |
Latest news from Cibolo, TX collected exclusively by city-data.com from local newspapers, TV, and radio stations
Ancestries: German (10.4%), Irish (6.9%), English (6.1%), American (4.5%), European (1.9%), Liberian (1.0%).
Current Local Time: CST time zone
Elevation: 704 feet
Land area: 5.33 square miles.
Population density: 6,533 people per square mile (high).
2,071 residents are foreign born (2.1% Latin America, 2.1% Asia, 1.3% Europe).
| This city: | 6.0% |
| Texas: | 17.1% |
Median real estate property taxes paid for housing units with mortgages in 2022: $5,944 (1.8%)
Median real estate property taxes paid for housing units with no mortgage in 2022: $4,285 (1.3%)
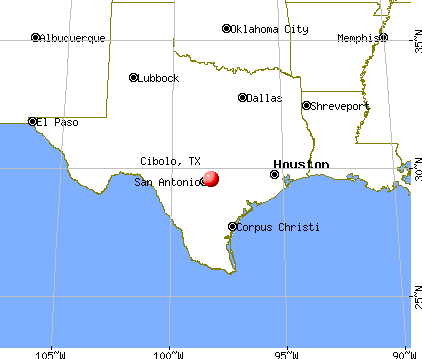
Nearest city with pop. 50,000+: San Antonio, TX  (18.5 miles , pop. 1,144,646).
Nearest cities:
), ), ), ), ), ), Latitude: 29.57 N, Longitude: 98.24 W
Area code commonly used in this area: 830
Cibolo, Texas accommodation & food services, waste management - Economy and Business Data
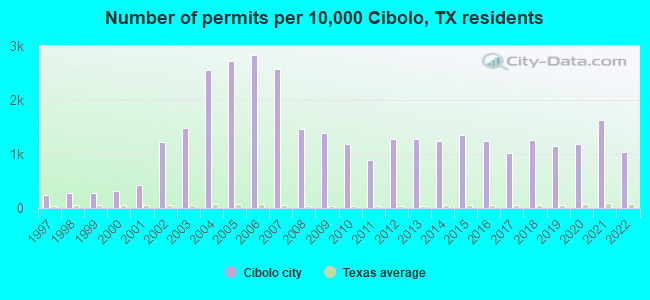
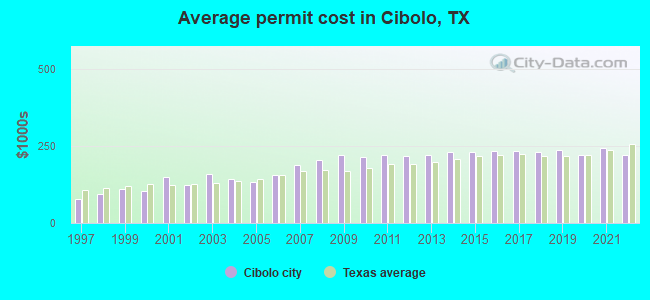
Single-family new house construction building permits:
- 2022: 313 buildings, average cost: $220,200
- 2021: 493 buildings, average cost: $243,900
- 2020: 360 buildings, average cost: $221,300
- 2019: 347 buildings, average cost: $237,400
- 2018: 380 buildings, average cost: $230,600
- 2017: 308 buildings, average cost: $235,300
- 2016: 377 buildings, average cost: $235,300
- 2015: 412 buildings, average cost: $232,200
- 2014: 379 buildings, average cost: $230,600
- 2013: 390 buildings, average cost: $220,200
- 2012: 390 buildings, average cost: $218,800
- 2011: 271 buildings, average cost: $220,500
- 2010: 360 buildings, average cost: $213,500
- 2009: 424 buildings, average cost: $219,500
- 2008: 445 buildings, average cost: $204,900
- 2007: 782 buildings, average cost: $189,100
- 2006: 860 buildings, average cost: $154,700
- 2005: 827 buildings, average cost: $135,000
- 2004: 778 buildings, average cost: $143,700
- 2003: 447 buildings, average cost: $159,700
- 2002: 371 buildings, average cost: $125,300
- 2001: 128 buildings, average cost: $150,500
- 2000: 94 buildings, average cost: $103,200
- 1999: 84 buildings, average cost: $109,600
- 1998: 82 buildings, average cost: $92,700
- 1997: 74 buildings, average cost: $77,500
| Here: | 3.0% |
| Texas: | 3.5% |
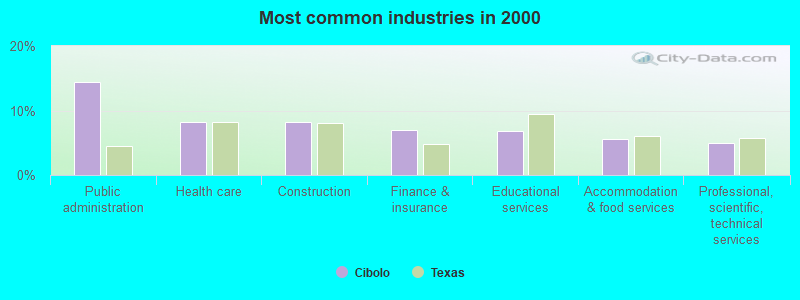
- Public administration (14.4%)
- Health care (8.3%)
- Construction (8.2%)
- Finance & insurance (7.0%)
- Educational services (6.8%)
- Accommodation & food services (5.7%)
- Professional, scientific, technical services (4.9%)
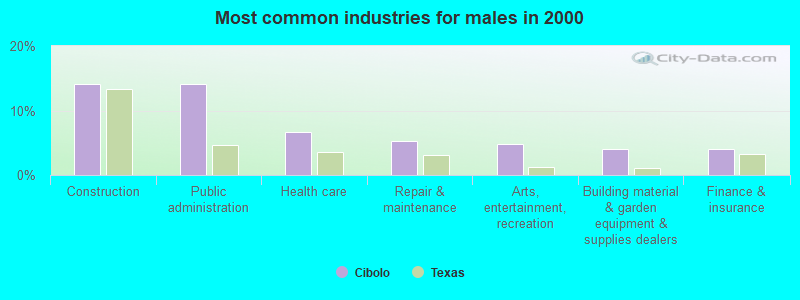
- Construction (14.2%)
- Public administration (14.2%)
- Health care (6.7%)
- Repair & maintenance (5.3%)
- Arts, entertainment, recreation (4.9%)
- Building material & garden equipment & supplies dealers (4.0%)
- Finance & insurance (4.0%)
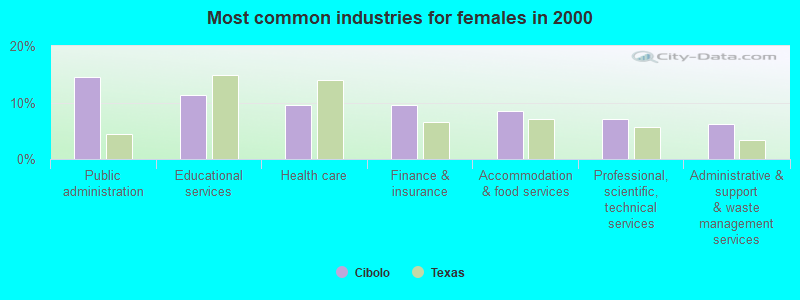
- Public administration (14.5%)
- Educational services (11.2%)
- Health care (9.6%)
- Finance & insurance (9.5%)
- Accommodation & food services (8.4%)
- Professional, scientific, technical services (7.0%)
- Administrative & support & waste management services (6.2%)
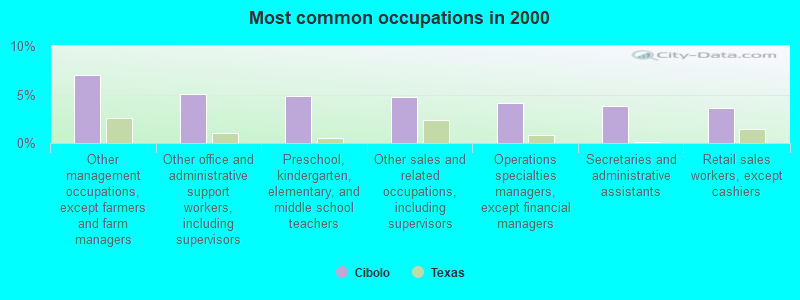
- Other management occupations, except farmers and farm managers (7.0%)
- Other office and administrative support workers, including supervisors (5.1%)
- Preschool, kindergarten, elementary, and middle school teachers (4.9%)
- Other sales and related occupations, including supervisors (4.7%)
- Operations specialties managers, except financial managers (4.1%)
- Secretaries and administrative assistants (3.8%)
- Retail sales workers, except cashiers (3.6%)
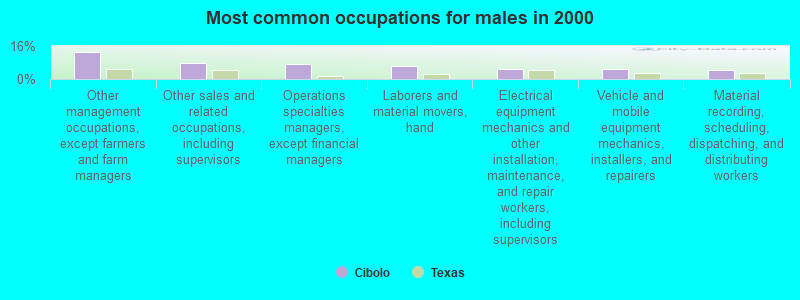
- Other management occupations, except farmers and farm managers (13.2%)
- Other sales and related occupations, including supervisors (7.8%)
- Operations specialties managers, except financial managers (7.2%)
- Laborers and material movers, hand (6.1%)
- Electrical equipment mechanics and other installation, maintenance, and repair workers, including supervisors (5.0%)
- Vehicle and mobile equipment mechanics, installers, and repairers (5.0%)
- Material recording, scheduling, dispatching, and distributing workers (4.6%)
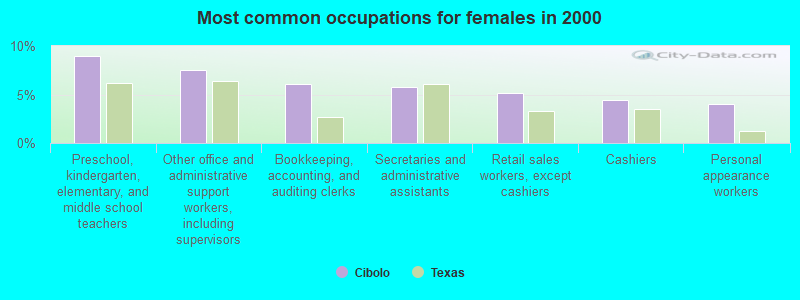
- Preschool, kindergarten, elementary, and middle school teachers (9.0%)
- Other office and administrative support workers, including supervisors (7.5%)
- Bookkeeping, accounting, and auditing clerks (6.1%)
- Secretaries and administrative assistants (5.7%)
- Retail sales workers, except cashiers (5.2%)
- Cashiers (4.4%)
- Personal appearance workers (4.0%)
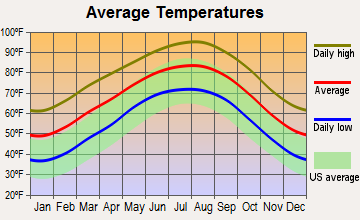
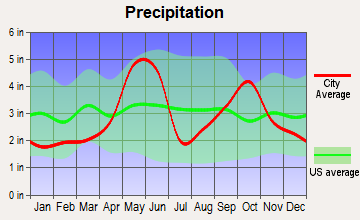
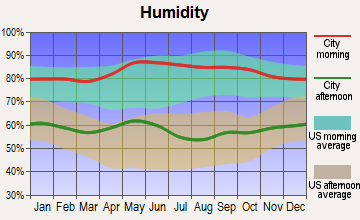
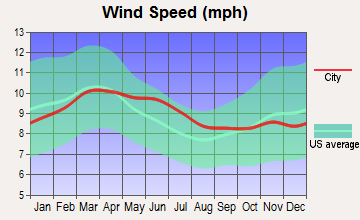
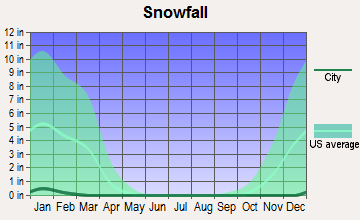
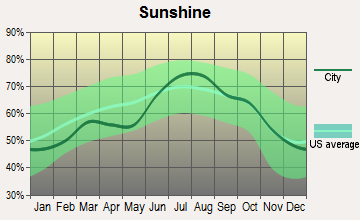
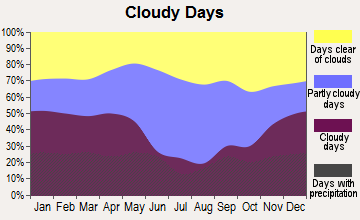
Average climate in Cibolo, Texas
Based on data reported by over 4,000 weather stations
(lower is better)
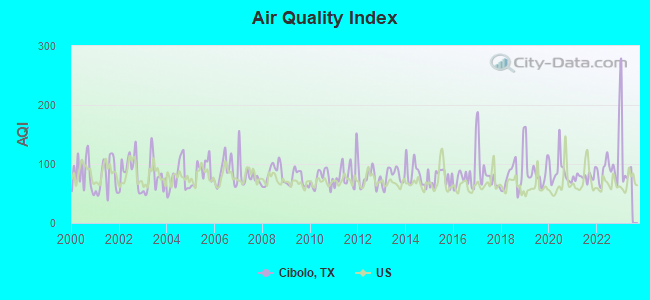
Air Quality Index (AQI) level in 2022 was 95.9. This is worse than average.
| City: | 95.9 |
| U.S.: | 72.6 |
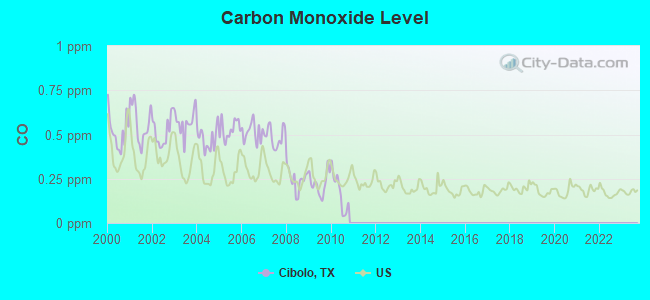
Carbon Monoxide (CO) [ppm] level in 2010 was 0.174. This is significantly better than average. Closest monitor was 16.0 miles away from the city center.
| City: | 0.174 |
| U.S.: | 0.251 |
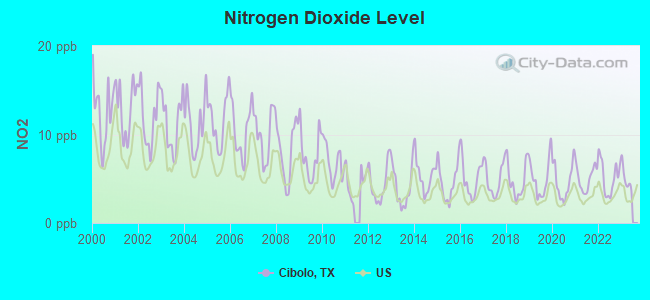
Nitrogen Dioxide (NO2) [ppb] level in 2022 was 5.19. This is about average. Closest monitor was 14.1 miles away from the city center.
| City: | 5.19 |
| U.S.: | 5.11 |
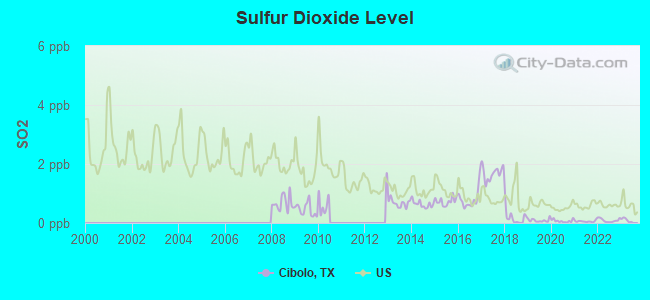
Sulfur Dioxide (SO2) [ppb] level in 2022 was 0.0888. This is significantly better than average. Closest monitor was 14.1 miles away from the city center.
| City: | 0.0888 |
| U.S.: | 1.5147 |
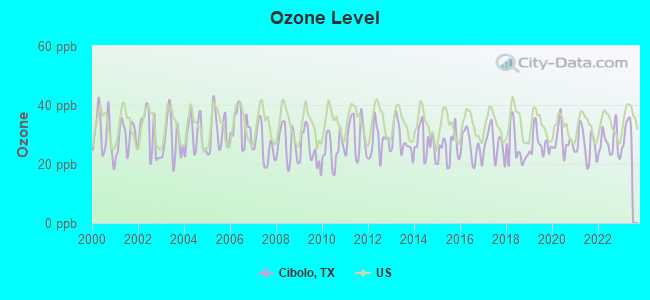
Ozone [ppb] level in 2022 was 27.2. This is better than average. Closest monitor was 16.0 miles away from the city center.
| City: | 27.2 |
| U.S.: | 33.3 |
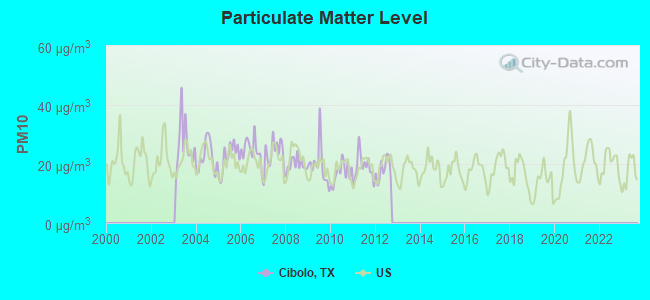
Particulate Matter (PM10) [µg/m3] level in 2012 was 18.1. This is about average. Closest monitor was 4.9 miles away from the city center.
| City: | 18.1 |
| U.S.: | 19.2 |
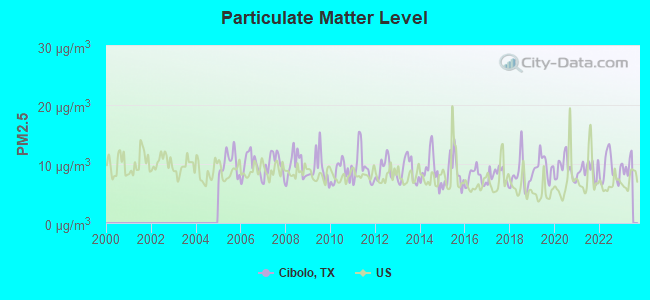
Particulate Matter (PM2.5) [µg/m3] level in 2022 was 9.11. This is about average. Closest monitor was 4.9 miles away from the city center.
| City: | 9.11 |
| U.S.: | 8.11 |
Tornado activity:
Cibolo-area historical tornado activity is slightly below Texas state average. It is 4% greater than the overall U.S. average.
On 4/28/1953, a category F4 (max. wind speeds 207-260 mph) tornado 28.0 miles away from the Cibolo city center killed 2 people and injured 15 people.
On 9/20/1967, a category F3 (max. wind speeds 158-206 mph) tornado 9.0 miles away from the city center caused between $50,000 and $500,000 in damages.
Earthquake activity:
Cibolo-area historical earthquake activity is significantly above Texas state average. It is 26% smaller than the overall U.S. average.On 10/20/2011 at 12:24:41, a magnitude 4.8 (4.8 MW, Depth: 3.1 mi, Class: Light, Intensity: IV - V) earthquake occurred 49.5 miles away from Cibolo center
On 4/14/1995 at 00:32:56, a magnitude 5.7 (5.6 MB, 5.7 MS, 5.7 MW, Depth: 11.1 mi, Class: Moderate, Intensity: VI - VII) earthquake occurred 311.5 miles away from the city center
On 4/9/1993 at 12:29:19, a magnitude 4.3 (4.1 MB, 4.3 LG, Depth: 3.1 mi) earthquake occurred 52.7 miles away from the city center
On 6/16/1978 at 11:46:54, a magnitude 5.3 (4.4 MB, 4.6 UK, 5.3 ML) earthquake occurred 282.4 miles away from Cibolo center
On 5/1/2018 at 16:28:56, a magnitude 4.0 (4.0 MW, Depth: 3.1 mi) earthquake occurred 45.1 miles away from Cibolo center
On 4/7/2008 at 09:51:12, a magnitude 3.9 (3.9 MW, Depth: 3.1 mi, Class: Light, Intensity: II - III) earthquake occurred 46.4 miles away from the city center
Magnitude types: regional Lg-wave magnitude (LG), body-wave magnitude (MB), local magnitude (ML), surface-wave magnitude (MS), moment magnitude (MW)
Natural disasters:
The number of natural disasters in Guadalupe County (17) is near the US average (15).Major Disasters (Presidential) Declared: 9
Emergencies Declared: 6
Causes of natural disasters: Floods: 7, Storms: 7, Fires: 4, Hurricanes: 4, Tornadoes: 4, Winds: 2, Tropical Storm: 1, Other: 1 (Note: some incidents may be assigned to more than one category).

Hospitals and medical centers near Cibolo:
- SILVER TREE NURSING AND REHABILITATION CENTER (Nursing Home, about 2 miles away; SCHERTZ, TX)
- COUNCIL OAKS AT PHOENIX (Hospital, about 6 miles away; SELMA, TX)
- COUNCIL OAKS AT SHALLOW CREEK (Hospital, about 7 miles away; SAN ANTONIO, TX)
- COUNCIL OAKS AT SHALLOW RIDGE (Hospital, about 7 miles away; SAN ANTONIO, TX)
- FMC - VILLAGE OAKS KIDNEY DISEASE CLINC (Dialysis Facility, about 7 miles away; LIVE OAK, TX)
- SPRUCE RIDGE (Hospital, about 7 miles away; CONVERSE, TX)
- NORTHEAST METHODIST HOSP TR (Nursing Home, about 7 miles away; SAN ANTONIO, TX)
Colleges/universities with over 2000 students nearest to Cibolo:
- University of the Incarnate Word (about 16 miles; San Antonio, TX; Full-time enrollment: 6,875)
- Trinity University (about 17 miles; San Antonio, TX; FT enrollment: 2,467)
- St Philip's College (about 17 miles; San Antonio, TX; FT enrollment: 5,970)
- San Antonio College (about 18 miles; San Antonio, TX; FT enrollment: 15,182)
- Our Lady of the Lake University (about 22 miles; San Antonio, TX; FT enrollment: 2,133)
- The University of Texas at San Antonio (about 24 miles; San Antonio, TX; FT enrollment: 25,503)
- Palo Alto College (about 26 miles; San Antonio, TX; FT enrollment: 5,055)
Public elementary/middle schools in Cibolo:
- DOBIE J H (Students: 1,006, Location: 395 W BORGFELD RD, Grades: 7-8)
- WIEDERSTEIN EL (Students: 661, Location: 171 BORGFELD RD, Grades: PK-4)
- ELAINE S SCHLATHER INT (Students: 651, Location: 230 ELAINE S SCHLATHER PKWY, Grades: 5-6)
- WATTS EL (Students: 648, Location: 100 DEER MEADOW, Grades: PK-4)
- BARBARA JORDAN INT (Students: 567, Location: 515 THISTLE CREEK DR, Grades: 5-6)
User-submitted facts and corrections:
- New High School - Byron Steele III High School - 1300 FM 1103, Ciblol, TX 78108 - Grades 9-12
Points of interest:
Notable location: Cibolo Volunteer Fire Department (A). Display/hide its location on the map
Church in Cibolo: Saint Paul Church (A). Display/hide its location on the map
| This city: | 3.1 people |
| Texas: | 2.8 people |
| This city: | 84.0% |
| Whole state: | 69.9% |
| This city: | 3.3% |
| Whole state: | 6.0% |
Likely homosexual households (counted as self-reported same-sex unmarried-partner households)
- Lesbian couples: 0.3% of all households
- Gay men: 0.1% of all households
Banks with branches in Cibolo (2011 data):
- Wells Fargo Bank, National Association: Cibolo Branch at 700 W Fm 78, branch established on 1967/09/15. Info updated 2011/04/05: Bank assets: $1,161,490.0 mil, Deposits: $905,653.0 mil, headquarters in Sioux Falls, SD, positive income, 6395 total offices, Holding Company: Wells Fargo & Company
For population 15 years and over in Cibolo:
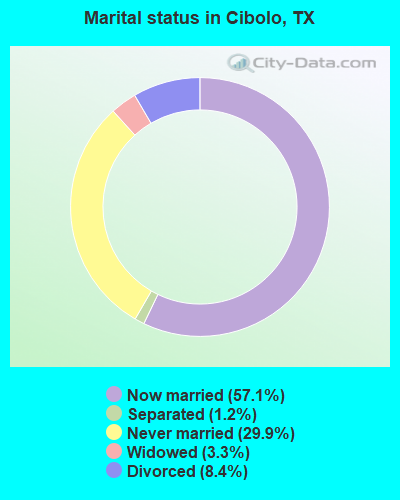
- Never married: 29.9%
- Now married: 57.1%
- Separated: 1.2%
- Widowed: 3.3%
- Divorced: 8.4%
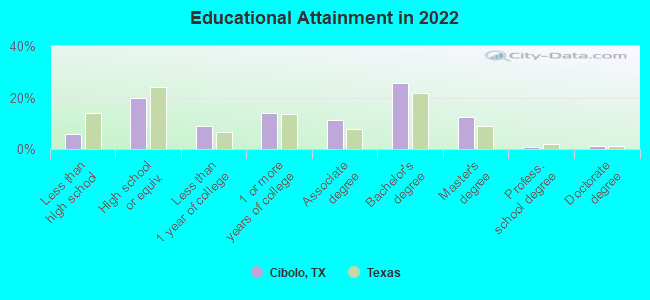
For population 25 years and over in Cibolo:
- High school or higher: 94.0%
- Bachelor's degree or higher: 38.8%
- Graduate or professional degree: 15.2%
- Unemployed: 3.1%
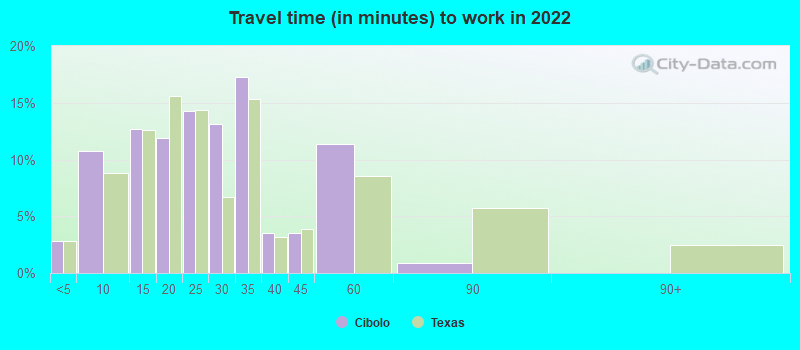
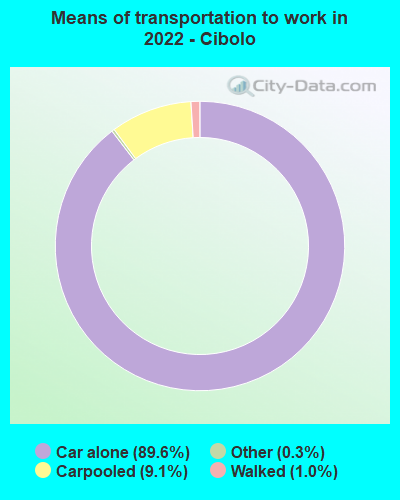
- Mean travel time to work (commute): 27.0 minutes
| Here: | 10.1 |
| Texas average: | 14.0 |
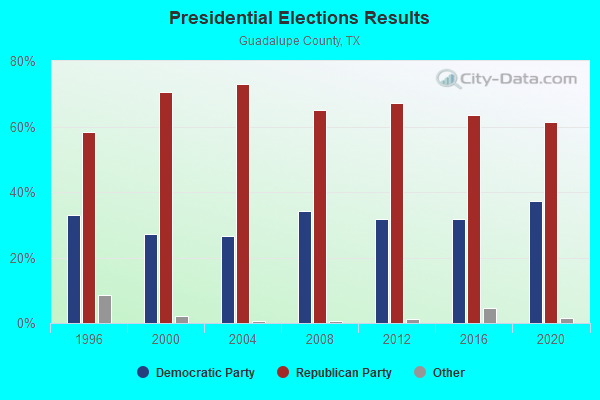


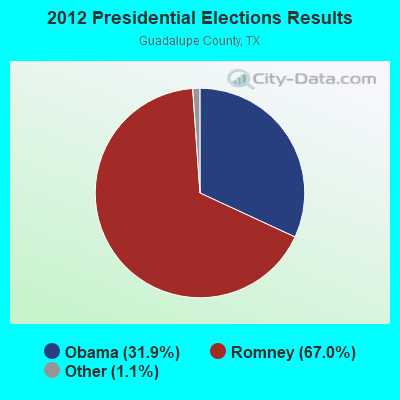
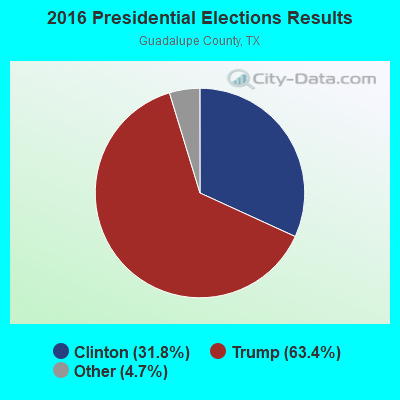
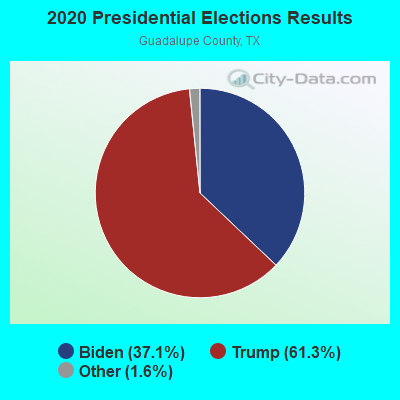
Graphs represent county-level data. Detailed 2008 Election Results
Religion statistics for Cibolo, TX (based on Guadalupe County data)
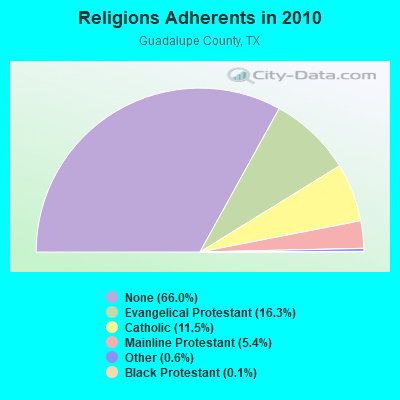
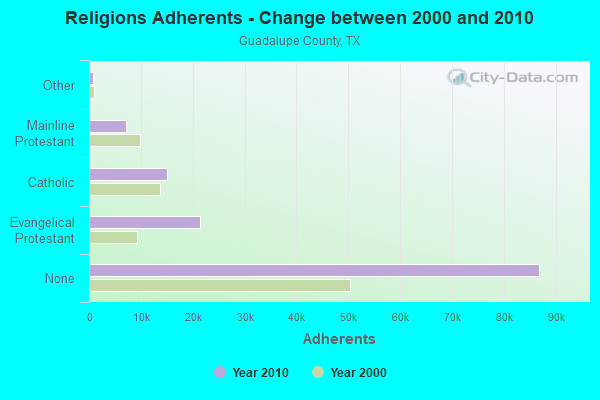
| Religion | Adherents | Congregations |
|---|---|---|
| Evangelical Protestant | 21,414 | 82 |
| Catholic | 15,094 | 4 |
| Mainline Protestant | 7,148 | 14 |
| Other | 848 | 2 |
| Black Protestant | 190 | 3 |
| None | 86,839 | - |
Food Environment Statistics:
| This county: | 1.07 / 10,000 pop. |
| Texas: | 1.47 / 10,000 pop. |
| Guadalupe County: | 0.18 / 10,000 pop. |
| State: | 0.14 / 10,000 pop. |
| Guadalupe County: | 0.80 / 10,000 pop. |
| Texas: | 1.11 / 10,000 pop. |
| Guadalupe County: | 4.54 / 10,000 pop. |
| Texas: | 3.95 / 10,000 pop. |
| This county: | 4.36 / 10,000 pop. |
| Texas: | 6.13 / 10,000 pop. |
| This county: | 9.1% |
| Texas: | 8.9% |
| This county: | 28.6% |
| Texas: | 26.6% |
| This county: | 15.1% |
| State: | 15.7% |
Health and Nutrition:
| Cibolo: | 51.3% |
| Texas: | 48.6% |
| This city: | 51.4% |
| Texas: | 47.4% |
| This city: | 28.6 |
| Texas: | 28.5 |
| This city: | 20.7% |
| Texas: | 20.6% |
| Cibolo: | 9.0% |
| Texas: | 10.3% |
| This city: | 6.8 |
| Texas: | 6.8 |
| This city: | 35.2% |
| Texas: | 33.1% |
| Cibolo: | 59.3% |
| State: | 56.2% |
| This city: | 81.9% |
| Texas: | 80.7% |
More about Health and Nutrition of Cibolo, TX Residents
| Local government employment and payroll (March 2022) | |||||
| Function | Full-time employees | Monthly full-time payroll | Average yearly full-time wage | Part-time employees | Monthly part-time payroll |
|---|---|---|---|---|---|
| Police Protection - Officers | 38 | $231,232 | $73,021 | 0 | $0 |
| Firefighters | 32 | $186,793 | $70,047 | 0 | $0 |
| Other Government Administration | 21 | $78,557 | $44,890 | 0 | $0 |
| Police - Other | 17 | $35,910 | $25,348 | 7 | $2,217 |
| Streets and Highways | 14 | $48,179 | $41,296 | 0 | $0 |
| Water Supply | 12 | $45,844 | $45,844 | 0 | $0 |
| Parks and Recreation | 12 | $41,137 | $41,137 | 0 | $0 |
| Housing and Community Development (Local) | 8 | $46,564 | $69,846 | 0 | $0 |
| Sewerage | 8 | $25,271 | $37,907 | 0 | $0 |
| Financial Administration | 7 | $32,764 | $56,167 | 0 | $0 |
| Fire - Other | 1 | $3,421 | $41,052 | 0 | $0 |
| Totals for Government | 170 | $775,674 | $54,753 | 7 | $2,217 |
Cibolo government finances - Expenditure in 2021 (per resident):
- Construction - Parks and Recreation: $216,000 ($6.20)
Regular Highways: $125,000 ($3.59)
Sewerage: $75,000 ($2.15)
Local Fire Protection: $72,000 ($2.07)
- Current Operations - Water Utilities: $4,495,000 ($129.11)
Police Protection: $3,695,000 ($106.14)
Sewerage: $3,277,000 ($94.13)
Solid Waste Management: $2,707,000 ($77.76)
Local Fire Protection: $2,230,000 ($64.05)
Regular Highways: $1,859,000 ($53.40)
Central Staff Services: $1,565,000 ($44.95)
Protective Inspection and Regulation - Other: $940,000 ($27.00)
Parks and Recreation: $807,000 ($23.18)
General - Other: $626,000 ($17.98)
Financial Administration: $459,000 ($13.18)
Health - Other: $212,000 ($6.09)
Judicial and Legal Services: $205,000 ($5.89)
- General - Interest on Debt: $1,292,000 ($37.11)
- Intergovernmental to Local - Other - Health - Other: $269,000 ($7.73)
Other - General - Other: $160,000 ($4.60)
Other - Libraries: $35,000 ($1.01)
Other - Public Welfare - Other: $30,000 ($0.86)
Other - Transit Utilities: $2,000 ($0.06)
- Other Capital Outlay - Police Protection: $160,000 ($4.60)
Parks and Recreation: $115,000 ($3.30)
General - Other: $23,000 ($0.66)
Regular Highways: $7,000 ($0.20)
- Total Salaries and Wages: $8,200,000 ($235.54)
- Water Utilities - Interest on Debt: $290,000 ($8.33)
Cibolo government finances - Revenue in 2021 (per resident):
- Charges - Sewerage: $3,242,000 ($93.12)
Solid Waste Management: $3,035,000 ($87.18)
Other: $1,324,000 ($38.03)
- Local Intergovernmental - Other: $370,000 ($10.63)
Public Welfare: $26,000 ($0.75)
Sewerage: $7,000 ($0.20)
- Miscellaneous - General Revenue - Other: $1,785,000 ($51.27)
Interest Earnings: $820,000 ($23.55)
Fines and Forfeits: $365,000 ($10.48)
Rents: $58,000 ($1.67)
Sale of Property: $34,000 ($0.98)
Donations From Private Sources: $4,000 ($0.11)
- Revenue - Water Utilities: $4,888,000 ($140.40)
- State Intergovernmental - General Local Government Support: $30,000 ($0.86)
- Tax - Property: $10,256,000 ($294.59)
General Sales and Gross Receipts: $3,328,000 ($95.59)
Other License: $2,642,000 ($75.89)
Public Utilities Sales: $892,000 ($25.62)
Alcoholic Beverage License: $10,000 ($0.29)
Cibolo government finances - Debt in 2021 (per resident):
- Long Term Debt - Beginning Outstanding - Unspecified Public Purpose: $66,122,000 ($1899.29)
Outstanding Unspecified Public Purpose: $62,627,000 ($1798.90)
Retired Unspecified Public Purpose: $3,495,000 ($100.39)
Cibolo government finances - Cash and Securities in 2021 (per resident):
- Bond Funds - Cash and Securities: $30,986,000 ($890.04)
- Other Funds - Cash and Securities: $54,077,000 ($1553.31)
- Sinking Funds - Cash and Securities: $915,000 ($26.28)
12.64% of this county's 2021 resident taxpayers lived in other counties in 2020 ($62,125 average adjusted gross income)
| Here: | 12.64% |
| Texas average: | 8.12% |
0.13% of residents moved from foreign countries ($795 average AGI)
Guadalupe County: 0.13% Texas average: 0.04%
Top counties from which taxpayers relocated into this county between 2020 and 2021:
| from Bexar County, TX | |
| from Comal County, TX | |
| from Hays County, TX |
10.16% of this county's 2020 resident taxpayers moved to other counties in 2021 ($64,534 average adjusted gross income)
| Here: | 10.16% |
| Texas average: | 7.40% |
0.09% of residents moved to foreign countries ($804 average AGI)
Guadalupe County: 0.09% Texas average: 0.03%
Top counties to which taxpayers relocated from this county between 2020 and 2021:
| to Bexar County, TX | |
| to Comal County, TX | |
| to Hays County, TX |
Businesses in Cibolo, TX
- FedEx: 1
- SONIC Drive-In: 1
- U-Haul: 1
Strongest AM radio stations in Cibolo:
- KTKR (760 AM; 50 kW; SAN ANTONIO, TX; Owner: CCB TEXAS LICENSES, L.P.)
- KSAH (720 AM; 10 kW; UNIVERSAL CITY, TX; Owner: KSAH LICENSING, INC.)
- WOAI (1200 AM; 50 kW; SAN ANTONIO, TX; Owner: CCB TEXAS LICENSES, L.P.)
- KDRY (1100 AM; 11 kW; ALAMO HEIGHTS, TX; Owner: KDRY RADIO, INC.)
- KTSA (550 AM; 5 kW; SAN ANTONIO, TX; Owner: INFINITY BROADCASTING CORPORATION OF SAN ANTONIO)
- KKYX (680 AM; 50 kW; SAN ANTONIO, TX; Owner: CXR HOLDINGS, INC.)
- KLUP (930 AM; 5 kW; TERRELL HILLS, TX; Owner: SOUTH TEXAS BROADCASTING, INC.)
- KSLR (630 AM; 5 kW; SAN ANTONIO, TX; Owner: SALEM MEDIA OF TEXAS, INC.)
- KENS (1160 AM; 25 kW; SAN ANTONIO, TX; Owner: KENS-TV, INC.)
- KONO (860 AM; 5 kW; SAN ANTONIO, TX; Owner: CXR HOLDINGS, INC.)
- KXTN (1310 AM; 5 kW; SAN ANTONIO, TX)
- KBIB (1000 AM; daytime; 0 kW; MARION, TX; Owner: HISPANIC COMMUNITY COLLEGE)
- KEDA (1540 AM; 5 kW; SAN ANTONIO, TX; Owner: D & E BROADCASTING CO., INC.)
Strongest FM radio stations in Cibolo:
- KYFS (90.9 FM; SAN ANTONIO, TX; Owner: BIBLE BROADCASTING NETWORK, INC.)
- KXTN-FM (107.5 FM; SAN ANTONIO, TX; Owner: TICHENOR LICENSE CORPORATION ("TLC"))
- KROM (92.9 FM; SAN ANTONIO, TX; Owner: TICHENOR LICENSE CORPORATION ("TLC"))
- KXXM (96.1 FM; SAN ANTONIO, TX; Owner: CCB TEXAS LICENSES, L.P.)
- KSMG (105.3 FM; SEGUIN, TX; Owner: CXR HOLDINGS, INC.)
- KISS-FM (99.5 FM; SAN ANTONIO, TX; Owner: CXR HOLDINGS, INC.)
- KCYY (100.3 FM; SAN ANTONIO, TX; Owner: CXR HOLDINGS, INC.)
- KTSW (89.9 FM; SAN MARCOS, TX; Owner: SOUTHWEST TEXAS STATE UNIVERSITY)
- KONO-FM (101.1 FM; HELOTES, TX; Owner: CXR HOLDINGS, INC.)
- KQXT-FM (101.9 FM; SAN ANTONIO, TX; Owner: CCB TEXAS LICENSES, L.P.)
- KAJA (97.3 FM; SAN ANTONIO, TX; Owner: CCB TEXAS LICENSES, L.P.)
- KTFM (102.7 FM; SAN ANTONIO, TX; Owner: INFINITY BROADCASTING CORPORATION OF SAN ANTONIO)
- KZEP-FM (104.5 FM; SAN ANTONIO, TX; Owner: TEXAS LOTUS LTD.)
- KSTX (89.1 FM; SAN ANTONIO, TX; Owner: TEXAS PUBLIC RADIO)
- KCJZ (106.7 FM; TERRELL HILLS, TX; Owner: CXR HOLDINGS, INC.)
- KNBT (92.1 FM; NEW BRAUNFELS, TX; Owner: NEW BRAUNFELS COMMUNICATIONS, INC.)
- KEYI-FM (103.5 FM; SAN MARCOS, TX; Owner: EMMIS AUSTIN RADIO BROADCASTING COMPANY, L.P.)
- KPAC (88.3 FM; SAN ANTONIO, TX; Owner: TEXAS PUBLIC RADIO)
- K237AS (95.3 FM; SAN ANTONIO, TX; Owner: CXR HOLDINGS, INC.)
- KLEY-FM (94.1 FM; FLORESVILLE, TX; Owner: KLEY LICENSING, INC.)
TV broadcast stations around Cibolo:
- KENS-TV (Channel 5; SAN ANTONIO, TX; Owner: KENS-TV, INC.)
- KVDA (Channel 60; SAN ANTONIO, TX; Owner: TELEMUNDO OF TEXAS PARTNERSHIP, LP)
- KABB (Channel 29; SAN ANTONIO, TX; Owner: KABB LICENSEE, LLC)
- KWEX-TV (Channel 41; SAN ANTONIO, TX; Owner: KWEX LICENSE PARTNERSHIP, L.P.)
- KXTM-LP (Channel 21; SAN ANTONIO, TX; Owner: HUMBERTO LOPEZ)
- WOAI-TV (Channel 4; SAN ANTONIO, TX; Owner: CCB TEXAS LICENSES, L.P.)
- KSAA-LP (Channel 28; SAN ANTONIO, TX; Owner: MAKO COMMUNICATIONS, LLC)
- KLRN (Channel 9; SAN ANTONIO, TX; Owner: ALAMO PUBLIC TELECOMMUNICATIONS COUNCIL)
- KSAT-TV (Channel 12; SAN ANTONIO, TX; Owner: POST-NEWSWEEK STATIONS, SAN ANTONIO, LP)
- KRRT (Channel 35; KERRVILLE, TX; Owner: SAN ANTONIO (KRRT-TV) LICENSEE, INC.)
- KJLF-LP (Channel 7; SAN ANTONIO, TX; Owner: B COMMUNICATIONS JOINT VENTURE)
- KTDF-LP (Channel 18; SAN ANTONIO, TX; Owner: JOSEPH W. SHAFFER)
- KEVI-LP (Channel 25; SAN ANTONIO, TX; Owner: KEVIN ORTIZ)
- KHCE (Channel 23; SAN ANTONIO, TX; Owner: SAN ANTONIO COMMUNITY EDUCATIONAL TV, INC.)
- KFTO-CA (Channel 67; SAN ANTONIO, TX; Owner: TELEFUTURA PARTNERSHIP OF SAN ANTONIO)
- KMHZ-LP (Channel 65; SAN ANTONIO, TX; Owner: LOUIS MARTINEZ FAMILY GROUP, LLC)
- K45FJ (Channel 45; SAN ANTONIO, TX; Owner: TRINITY BROADCASTING NETWORK)
- KQVE-LP (Channel 46; La VERNIA, TX; Owner: WORD OF GOD FELLOWSHIP, INC.)
- K45DX (Channel 45; FLORESVILLE, TX; Owner: TELEFUTURA PARTNERSHIP OF FLORESVILLE)
- KNIC-CA (Channel 17; SAN ANTONIO, TX; Owner: TELEFUTURA PARTNERSHIP OF SAN ANTONIO)
- K52EA (Channel 52; SAN ANTONIO, TX; Owner: ORTIZ BROADCASTING CORPORATION)
- KNTA-LP (Channel 62; NEW BRAUNFELS, TX; Owner: ARACELIS ORTIZ, EXECUTRIX OF THE ESTATE OF CARLOS ORTIZ)
- KGMM-CA (Channel 58; SAN ANTONIO, TX; Owner: CABALLERO TELEVISION TEXAS, L.L.C.)
- K31EX (Channel 31; SAN ANTONIO, TX; Owner: MAKO COMMUNICATIONS, LLC)
- KTXU-LP (Channel 38; SAN MARCOS, TX; Owner: GERALD G. BENAVIDES)
- National Bridge Inventory (NBI) Statistics
- 20Number of bridges
- 315ft / 96.1mTotal length
- $7,284,000Total costs
- 407,039Total average daily traffic
- 86,339Total average daily truck traffic
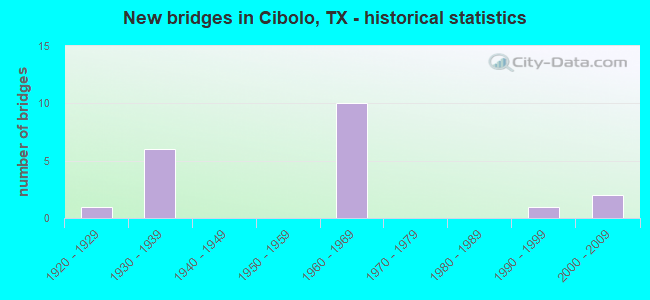
- New bridges - historical statistics
- 11920-1929
- 61930-1939
- 101960-1969
- 11990-1999
- 22000-2009
FCC Registered Broadcast Land Mobile Towers: 8 (See the full list of FCC Registered Broadcast Land Mobile Towers in Cibolo, TX)
FCC Registered Microwave Towers: 14 (See the full list of FCC Registered Microwave Towers in this town)
FCC Registered Amateur Radio Licenses: 107 (See the full list of FCC Registered Amateur Radio Licenses in Cibolo)
FAA Registered Aircraft: 14 (See the full list of FAA Registered Aircraft in Cibolo)
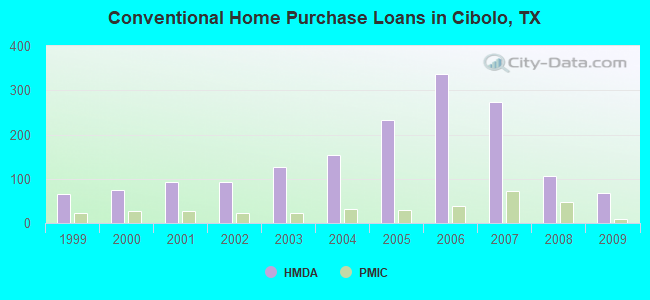
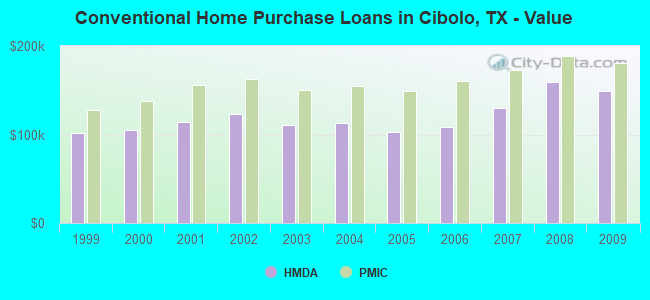
| Home Mortgage Disclosure Act Aggregated Statistics For Year 2009 (Based on 1 partial tract) | ||||||||||||
| A) FHA, FSA/RHS & VA Home Purchase Loans | B) Conventional Home Purchase Loans | C) Refinancings | D) Home Improvement Loans | F) Non-occupant Loans on < 5 Family Dwellings (A B C & D) | G) Loans On Manufactured Home Dwelling (A B C & D) | |||||||
|---|---|---|---|---|---|---|---|---|---|---|---|---|
| Number | Average Value | Number | Average Value | Number | Average Value | Number | Average Value | Number | Average Value | Number | Average Value | |
| LOANS ORIGINATED | 231 | $192,657 | 68 | $149,019 | 247 | $164,694 | 23 | $31,340 | 17 | $119,969 | 0 | $0 |
| APPLICATIONS APPROVED, NOT ACCEPTED | 6 | $149,462 | 5 | $145,824 | 33 | $147,017 | 5 | $27,916 | 2 | $147,880 | 0 | $0 |
| APPLICATIONS DENIED | 39 | $186,233 | 9 | $134,172 | 72 | $166,474 | 17 | $27,794 | 4 | $163,795 | 2 | $45,075 |
| APPLICATIONS WITHDRAWN | 29 | $191,087 | 11 | $173,509 | 69 | $156,343 | 4 | $83,232 | 6 | $160,532 | 1 | $56,150 |
| FILES CLOSED FOR INCOMPLETENESS | 2 | $224,985 | 1 | $120,990 | 11 | $175,737 | 0 | $0 | 0 | $0 | 0 | $0 |
Detailed HMDA statistics for the following Tracts: 2107.01
| Private Mortgage Insurance Companies Aggregated Statistics For Year 2009 (Based on 1 partial tract) | ||||
| A) Conventional Home Purchase Loans | B) Refinancings | |||
|---|---|---|---|---|
| Number | Average Value | Number | Average Value | |
| LOANS ORIGINATED | 10 | $180,737 | 7 | $168,553 |
| APPLICATIONS APPROVED, NOT ACCEPTED | 2 | $156,380 | 1 | $192,960 |
| APPLICATIONS DENIED | 1 | $136,410 | 1 | $172,790 |
| APPLICATIONS WITHDRAWN | 0 | $0 | 0 | $0 |
| FILES CLOSED FOR INCOMPLETENESS | 0 | $0 | 0 | $0 |
Detailed PMIC statistics for the following Tracts: 2107.01
2002 - 2018 National Fire Incident Reporting System (NFIRS) incidents
- Fire incident types reported to NFIRS in Cibolo, TX
- 60051.5%Outside Fires
- 39333.7%Structure Fires
- 11710.0%Mobile Property/Vehicle Fires
- 554.7%Other
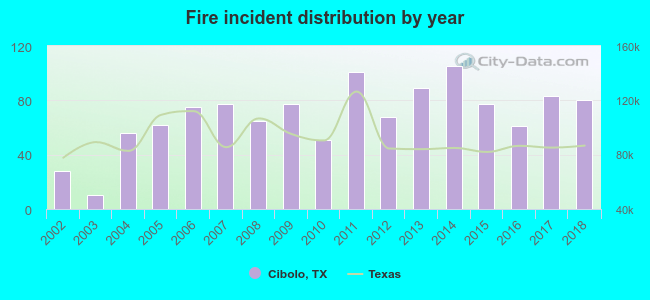 Based on the data from the years 2002 - 2018 the average number of fire incidents per year is 69. The highest number of reported fires - 105 took place in 2014, and the least - 10 in 2003. The data has a growing trend.
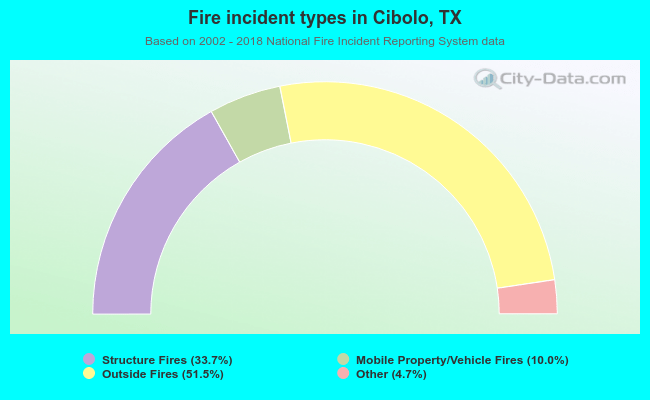 When looking into fire subcategories, the most incidents belonged to: Outside Fires (51.5%), and Structure Fires (33.7%).
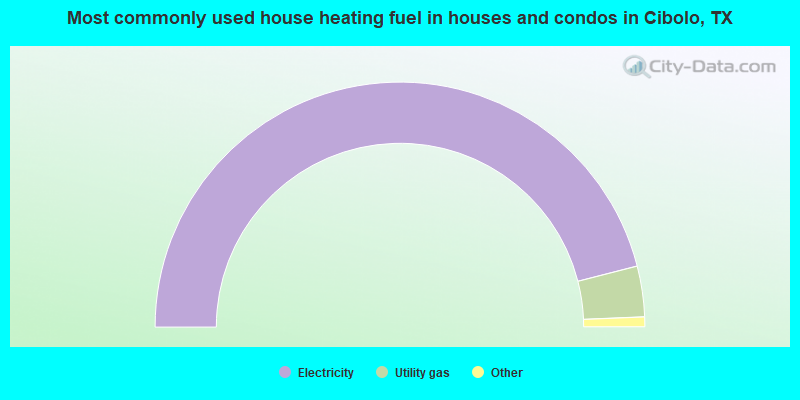
- 92.0%Electricity
- 6.7%Utility gas
- 1.1%Bottled, tank, or LP gas
- 0.2%No fuel used
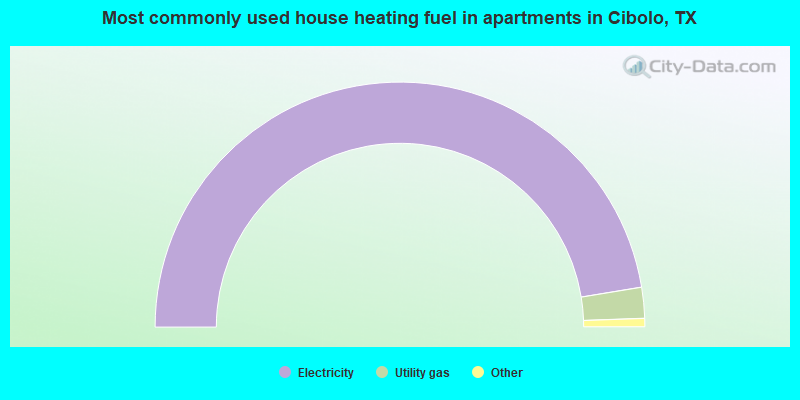
- 94.9%Electricity
- 4.1%Utility gas
- 0.7%Bottled, tank, or LP gas
- 0.3%No fuel used
Cibolo compared to Texas state average:
- Median household income above state average.
- Unemployed percentage significantly below state average.
- Black race population percentage significantly above state average.
- Hispanic race population percentage significantly above state average.
- Foreign-born population percentage significantly above state average.
- Renting percentage significantly below state average.
- Length of stay since moving in significantly above state average.
- Number of rooms per house above state average.
- House age significantly below state average.
- Number of college students significantly above state average.
- Percentage of population with a bachelor's degree or higher above state average.
Cibolo on our top lists:
- #16 on the list of "Top 101 cities with most building permits per 10,000 residents (population 5,000+)"
- #29 on the list of "Top 100 fastest growing cities from 2000 to 2014"
- #61 on the list of "Top 100 cities with newest houses (pop. 5,000+)"
- #57 (78108) on the list of "Top 101 zip codes with the smallest percentage of taxpayers using paid preparers for 2012 taxes (pop 5,000+)"
- #30 on the list of "Top 101 counties with the largest number of people moving in compared to moving out (pop. 50,000+)"
- #69 on the list of "Top 101 counties with the highest percentage of residents relocating from other counties between 2010 and 2011 (pop. 50,000+)"
- #70 on the list of "Top 101 counties with the highest percentage of residents relocating from foreign countries between 2010 and 2011"
- #87 on the list of "Top 101 counties with the highest percentage of residents relocating to foreign countries in 2011 (pop. 50,000+)"
State forum archive:
- Texas Pages: 2 3 4 5 6 7 8 9 10 11 12 13 14 15 16 17 18 19 20 21 22 23 24 25 26 27 28 29 30 31 32 33 34 35 36 37 38 39 40 41 42 43 44 45 46 47 48 49 50 51 52 53 54 55 56 57 58 59 60 61 62 63 64
- Austin Pages: 2 3 4 5 6 7 8 9 10 11 12 13 14 15 16 17 18 19 20 21 22 23 24 25 26 27 28 29 30 31 32 33 34 35 36 37 38 39 40 41 42 43 44 45 46 47 48 49 50 51 52 53 54 55 56 57 58 59 60 61 62 63 64 65 66 67 68 69 70 71 72 73 74 75 76 77 78 79 80 81 82 83 84 85 86 87 88 89 90 91 92 93 94 95 96 97 98 99 100 101 102 103 104 105 106 107 108 109 110 111 112 113 114 115 116 117 118 119 120 121 122 123 124 125 126 127 128 129
- Corpus Christi Pages: 2 3 4 5 6
- Dallas Pages: 2 3 4 5 6 7 8 9 10 11 12 13 14 15 16 17 18 19 20 21 22 23 24 25 26 27 28 29 30 31 32 33 34 35 36 37 38 39 40 41 42 43 44 45 46 47 48 49 50 51 52 53 54 55 56 57 58 59 60 61 62 63 64 65 66 67 68 69 70 71 72 73 74 75 76 77 78 79 80 81 82 83 84 85 86 87 88 89 90 91 92 93 94 95 96 97 98 99 100 101 102 103 104 105 106 107 108 109 110 111 112 113 114 115 116 117 118 119 120 121 122 123 124 125 126 127 128 129 130 131 132 133 134 135 136 137 138 139 140 141 142 143 144 145 146 147 148 149 150 151 152 153 154 155 156
- El Paso Pages: 2 3 4 5 6 7 8 9 10 11 12 13 14 15 16 17
- Fort Worth Pages: 2 3 4 5 6 7 8 9 10 11 12 13 14 15 16 17 18 19 20 21 22 23 24 25 26 27 28
- Houston Pages: 2 3 4 5 6 7 8 9 10 11 12 13 14 15 16 17 18 19 20 21 22 23 24 25 26 27 28 29 30 31 32 33 34 35 36 37 38 39 40 41 42 43 44 45 46 47 48 49 50 51 52 53 54 55 56 57 58 59 60 61 62 63 64 65 66 67 68 69 70 71 72 73 74 75 76 77 78 79 80 81 82 83 84 85 86 87 88 89 90 91 92 93 94 95 96 97 98 99 100 101 102 103 104 105 106 107 108 109 110 111 112 113 114 115 116 117 118 119 120 121 122 123 124 125 126 127 128 129 130 131 132 133 134 135 136 137 138 139 140 141 142 143 144 145 146 147 148 149 150 151 152 153 154 155 156 157 158 159 160 161 162 163 164 165 166 167 168 169 170 171 172 173 174 175 176 177
- Lubbock Pages: 2 3
- San Antonio Pages: 2 3 4 5 6 7 8 9 10 11 12 13 14 15 16 17 18 19 20 21 22 23 24 25 26 27 28 29 30 31 32 33 34 35 36 37 38 39 40 41 42 43 44 45 46 47 48 49 50 51 52 53 54 55 56 57 58 59 60 61 62 63 64 65 66 67 68 69 70 71 72 73 74 75 76 77 78 79 80 81 82 83 84 85 86 87 88 89 90 91 92 93 94 95 96 97 98 99 100 101 102 103 104 105 106 107 108 109 110 111 112 113 114
- Tyler Pages: 2 3 4

|
|
Total of 44 patent applications in 2008-2024.