Coconut Creek, Florida Submit your own pictures of this city and show them to the world
OSM Map
General Map
Google Map
MSN Map
OSM Map
General Map
Google Map
MSN Map
OSM Map
General Map
Google Map
MSN Map
OSM Map
General Map
Google Map
MSN Map
Please wait while loading the map...
Population in 2022: 57,348 (100% urban, 0% rural). Population change since 2000: +31.6%Males: 27,419 Females: 29,929
March 2022 cost of living index in Coconut Creek: 108.7 (more than average, U.S. average is 100) Percentage of residents living in poverty in 2022: 9.9%for White Non-Hispanic residents , 6.6% for Black residents , 14.4% for Hispanic or Latino residents , 22.6% for American Indian residents , 7.6% for other race residents , 19.8% for two or more races residents )
Profiles of local businesses
Business Search - 14 Million verified businesses
Data:
Median household income ($)
Median household income (% change since 2000)
Household income diversity
Ratio of average income to average house value (%)
Ratio of average income to average rent
Median household income ($) - White
Median household income ($) - Black or African American
Median household income ($) - Asian
Median household income ($) - Hispanic or Latino
Median household income ($) - American Indian and Alaska Native
Median household income ($) - Multirace
Median household income ($) - Other Race
Median household income for houses/condos with a mortgage ($)
Median household income for apartments without a mortgage ($)
Races - White alone (%)
Races - White alone (% change since 2000)
Races - Black alone (%)
Races - Black alone (% change since 2000)
Races - American Indian alone (%)
Races - American Indian alone (% change since 2000)
Races - Asian alone (%)
Races - Asian alone (% change since 2000)
Races - Hispanic (%)
Races - Hispanic (% change since 2000)
Races - Native Hawaiian and Other Pacific Islander alone (%)
Races - Native Hawaiian and Other Pacific Islander alone (% change since 2000)
Races - Two or more races (%)
Races - Two or more races (% change since 2000)
Races - Other race alone (%)
Races - Other race alone (% change since 2000)
Racial diversity
Unemployment (%)
Unemployment (% change since 2000)
Unemployment (%) - White
Unemployment (%) - Black or African American
Unemployment (%) - Asian
Unemployment (%) - Hispanic or Latino
Unemployment (%) - American Indian and Alaska Native
Unemployment (%) - Multirace
Unemployment (%) - Other Race
Population density (people per square mile)
Population - Males (%)
Population - Females (%)
Population - Males (%) - White
Population - Males (%) - Black or African American
Population - Males (%) - Asian
Population - Males (%) - Hispanic or Latino
Population - Males (%) - American Indian and Alaska Native
Population - Males (%) - Multirace
Population - Males (%) - Other Race
Population - Females (%) - White
Population - Females (%) - Black or African American
Population - Females (%) - Asian
Population - Females (%) - Hispanic or Latino
Population - Females (%) - American Indian and Alaska Native
Population - Females (%) - Multirace
Population - Females (%) - Other Race
Coronavirus confirmed cases (Apr 28, 2024)
Deaths caused by coronavirus (Apr 28, 2024)
Coronavirus confirmed cases (per 100k population) (Apr 28, 2024)
Deaths caused by coronavirus (per 100k population) (Apr 28, 2024)
Daily increase in number of cases (Apr 28, 2024)
Weekly increase in number of cases (Apr 28, 2024)
Cases doubled (in days) (Apr 28, 2024)
Hospitalized patients (Apr 18, 2022)
Negative test results (Apr 18, 2022)
Total test results (Apr 18, 2022)
COVID Vaccine doses distributed (per 100k population) (Sep 19, 2023)
COVID Vaccine doses administered (per 100k population) (Sep 19, 2023)
COVID Vaccine doses distributed (Sep 19, 2023)
COVID Vaccine doses administered (Sep 19, 2023)
Likely homosexual households (%)
Likely homosexual households (% change since 2000)
Likely homosexual households - Lesbian couples (%)
Likely homosexual households - Lesbian couples (% change since 2000)
Likely homosexual households - Gay men (%)
Likely homosexual households - Gay men (% change since 2000)
Cost of living index
Median gross rent ($)
Median contract rent ($)
Median monthly housing costs ($)
Median house or condo value ($)
Median house or condo value ($ change since 2000)
Mean house or condo value by units in structure - 1, detached ($)
Mean house or condo value by units in structure - 1, attached ($)
Mean house or condo value by units in structure - 2 ($)
Mean house or condo value by units in structure by units in structure - 3 or 4 ($)
Mean house or condo value by units in structure - 5 or more ($)
Mean house or condo value by units in structure - Boat, RV, van, etc. ($)
Mean house or condo value by units in structure - Mobile home ($)
Median house or condo value ($) - White
Median house or condo value ($) - Black or African American
Median house or condo value ($) - Asian
Median house or condo value ($) - Hispanic or Latino
Median house or condo value ($) - American Indian and Alaska Native
Median house or condo value ($) - Multirace
Median house or condo value ($) - Other Race
Median resident age
Resident age diversity
Median resident age - Males
Median resident age - Females
Median resident age - White
Median resident age - Black or African American
Median resident age - Asian
Median resident age - Hispanic or Latino
Median resident age - American Indian and Alaska Native
Median resident age - Multirace
Median resident age - Other Race
Median resident age - Males - White
Median resident age - Males - Black or African American
Median resident age - Males - Asian
Median resident age - Males - Hispanic or Latino
Median resident age - Males - American Indian and Alaska Native
Median resident age - Males - Multirace
Median resident age - Males - Other Race
Median resident age - Females - White
Median resident age - Females - Black or African American
Median resident age - Females - Asian
Median resident age - Females - Hispanic or Latino
Median resident age - Females - American Indian and Alaska Native
Median resident age - Females - Multirace
Median resident age - Females - Other Race
Commute - mean travel time to work (minutes)
Travel time to work - Less than 5 minutes (%)
Travel time to work - Less than 5 minutes (% change since 2000)
Travel time to work - 5 to 9 minutes (%)
Travel time to work - 5 to 9 minutes (% change since 2000)
Travel time to work - 10 to 19 minutes (%)
Travel time to work - 10 to 19 minutes (% change since 2000)
Travel time to work - 20 to 29 minutes (%)
Travel time to work - 20 to 29 minutes (% change since 2000)
Travel time to work - 30 to 39 minutes (%)
Travel time to work - 30 to 39 minutes (% change since 2000)
Travel time to work - 40 to 59 minutes (%)
Travel time to work - 40 to 59 minutes (% change since 2000)
Travel time to work - 60 to 89 minutes (%)
Travel time to work - 60 to 89 minutes (% change since 2000)
Travel time to work - 90 or more minutes (%)
Travel time to work - 90 or more minutes (% change since 2000)
Marital status - Never married (%)
Marital status - Now married (%)
Marital status - Separated (%)
Marital status - Widowed (%)
Marital status - Divorced (%)
Median family income ($)
Median family income (% change since 2000)
Median non-family income ($)
Median non-family income (% change since 2000)
Median per capita income ($)
Median per capita income (% change since 2000)
Median family income ($) - White
Median family income ($) - Black or African American
Median family income ($) - Asian
Median family income ($) - Hispanic or Latino
Median family income ($) - American Indian and Alaska Native
Median family income ($) - Multirace
Median family income ($) - Other Race
Median year house/condo built
Median year apartment built
Year house built - Built 2005 or later (%)
Year house built - Built 2000 to 2004 (%)
Year house built - Built 1990 to 1999 (%)
Year house built - Built 1980 to 1989 (%)
Year house built - Built 1970 to 1979 (%)
Year house built - Built 1960 to 1969 (%)
Year house built - Built 1950 to 1959 (%)
Year house built - Built 1940 to 1949 (%)
Year house built - Built 1939 or earlier (%)
Average household size
Household density (households per square mile)
Average household size - White
Average household size - Black or African American
Average household size - Asian
Average household size - Hispanic or Latino
Average household size - American Indian and Alaska Native
Average household size - Multirace
Average household size - Other Race
Occupied housing units (%)
Vacant housing units (%)
Owner occupied housing units (%)
Renter occupied housing units (%)
Vacancy status - For rent (%)
Vacancy status - For sale only (%)
Vacancy status - Rented or sold, not occupied (%)
Vacancy status - For seasonal, recreational, or occasional use (%)
Vacancy status - For migrant workers (%)
Vacancy status - Other vacant (%)
Residents with income below the poverty level (%)
Residents with income below 50% of the poverty level (%)
Children below poverty level (%)
Poor families by family type - Married-couple family (%)
Poor families by family type - Male, no wife present (%)
Poor families by family type - Female, no husband present (%)
Poverty status for native-born residents (%)
Poverty status for foreign-born residents (%)
Poverty among high school graduates not in families (%)
Poverty among people who did not graduate high school not in families (%)
Residents with income below the poverty level (%) - White
Residents with income below the poverty level (%) - Black or African American
Residents with income below the poverty level (%) - Asian
Residents with income below the poverty level (%) - Hispanic or Latino
Residents with income below the poverty level (%) - American Indian and Alaska Native
Residents with income below the poverty level (%) - Multirace
Residents with income below the poverty level (%) - Other Race
Air pollution - Air Quality Index (AQI)
Air pollution - CO
Air pollution - NO2
Air pollution - SO2
Air pollution - Ozone
Air pollution - PM10
Air pollution - PM25
Air pollution - Pb
Crime - Murders per 100,000 population
Crime - Rapes per 100,000 population
Crime - Robberies per 100,000 population
Crime - Assaults per 100,000 population
Crime - Burglaries per 100,000 population
Crime - Thefts per 100,000 population
Crime - Auto thefts per 100,000 population
Crime - Arson per 100,000 population
Crime - City-data.com crime index
Crime - Violent crime index
Crime - Property crime index
Crime - Murders per 100,000 population (5 year average)
Crime - Rapes per 100,000 population (5 year average)
Crime - Robberies per 100,000 population (5 year average)
Crime - Assaults per 100,000 population (5 year average)
Crime - Burglaries per 100,000 population (5 year average)
Crime - Thefts per 100,000 population (5 year average)
Crime - Auto thefts per 100,000 population (5 year average)
Crime - Arson per 100,000 population (5 year average)
Crime - City-data.com crime index (5 year average)
Crime - Violent crime index (5 year average)
Crime - Property crime index (5 year average)
1996 Presidential Elections Results (%) - Democratic Party (Clinton)
1996 Presidential Elections Results (%) - Republican Party (Dole)
1996 Presidential Elections Results (%) - Other
2000 Presidential Elections Results (%) - Democratic Party (Gore)
2000 Presidential Elections Results (%) - Republican Party (Bush)
2000 Presidential Elections Results (%) - Other
2004 Presidential Elections Results (%) - Democratic Party (Kerry)
2004 Presidential Elections Results (%) - Republican Party (Bush)
2004 Presidential Elections Results (%) - Other
2008 Presidential Elections Results (%) - Democratic Party (Obama)
2008 Presidential Elections Results (%) - Republican Party (McCain)
2008 Presidential Elections Results (%) - Other
2012 Presidential Elections Results (%) - Democratic Party (Obama)
2012 Presidential Elections Results (%) - Republican Party (Romney)
2012 Presidential Elections Results (%) - Other
2016 Presidential Elections Results (%) - Democratic Party (Clinton)
2016 Presidential Elections Results (%) - Republican Party (Trump)
2016 Presidential Elections Results (%) - Other
2020 Presidential Elections Results (%) - Democratic Party (Biden)
2020 Presidential Elections Results (%) - Republican Party (Trump)
2020 Presidential Elections Results (%) - Other
Ancestries Reported - Arab (%)
Ancestries Reported - Czech (%)
Ancestries Reported - Danish (%)
Ancestries Reported - Dutch (%)
Ancestries Reported - English (%)
Ancestries Reported - French (%)
Ancestries Reported - French Canadian (%)
Ancestries Reported - German (%)
Ancestries Reported - Greek (%)
Ancestries Reported - Hungarian (%)
Ancestries Reported - Irish (%)
Ancestries Reported - Italian (%)
Ancestries Reported - Lithuanian (%)
Ancestries Reported - Norwegian (%)
Ancestries Reported - Polish (%)
Ancestries Reported - Portuguese (%)
Ancestries Reported - Russian (%)
Ancestries Reported - Scotch-Irish (%)
Ancestries Reported - Scottish (%)
Ancestries Reported - Slovak (%)
Ancestries Reported - Subsaharan African (%)
Ancestries Reported - Swedish (%)
Ancestries Reported - Swiss (%)
Ancestries Reported - Ukrainian (%)
Ancestries Reported - United States (%)
Ancestries Reported - Welsh (%)
Ancestries Reported - West Indian (%)
Ancestries Reported - Other (%)
Educational Attainment - No schooling completed (%)
Educational Attainment - Less than high school (%)
Educational Attainment - High school or equivalent (%)
Educational Attainment - Less than 1 year of college (%)
Educational Attainment - 1 or more years of college (%)
Educational Attainment - Associate degree (%)
Educational Attainment - Bachelor's degree (%)
Educational Attainment - Master's degree (%)
Educational Attainment - Professional school degree (%)
Educational Attainment - Doctorate degree (%)
School Enrollment - Nursery, preschool (%)
School Enrollment - Kindergarten (%)
School Enrollment - Grade 1 to 4 (%)
School Enrollment - Grade 5 to 8 (%)
School Enrollment - Grade 9 to 12 (%)
School Enrollment - College undergrad (%)
School Enrollment - Graduate or professional (%)
School Enrollment - Not enrolled in school (%)
School enrollment - Public schools (%)
School enrollment - Private schools (%)
School enrollment - Not enrolled (%)
Median number of rooms in houses and condos
Median number of rooms in apartments
Housing units lacking complete plumbing facilities (%)
Housing units lacking complete kitchen facilities (%)
Density of houses
Urban houses (%)
Rural houses (%)
Households with people 60 years and over (%)
Households with people 65 years and over (%)
Households with people 75 years and over (%)
Households with one or more nonrelatives (%)
Households with no nonrelatives (%)
Population in households (%)
Family households (%)
Nonfamily households (%)
Population in families (%)
Family households with own children (%)
Median number of bedrooms in owner occupied houses
Mean number of bedrooms in owner occupied houses
Median number of bedrooms in renter occupied houses
Mean number of bedrooms in renter occupied houses
Median number of vehichles in owner occupied houses
Mean number of vehichles in owner occupied houses
Median number of vehichles in renter occupied houses
Mean number of vehichles in renter occupied houses
Mortgage status - with mortgage (%)
Mortgage status - with second mortgage (%)
Mortgage status - with home equity loan (%)
Mortgage status - with both second mortgage and home equity loan (%)
Mortgage status - without a mortgage (%)
Average family size
Average family size - White
Average family size - Black or African American
Average family size - Asian
Average family size - Hispanic or Latino
Average family size - American Indian and Alaska Native
Average family size - Multirace
Average family size - Other Race
Geographical mobility - Same house 1 year ago (%)
Geographical mobility - Moved within same county (%)
Geographical mobility - Moved from different county within same state (%)
Geographical mobility - Moved from different state (%)
Geographical mobility - Moved from abroad (%)
Place of birth - Born in state of residence (%)
Place of birth - Born in other state (%)
Place of birth - Native, outside of US (%)
Place of birth - Foreign born (%)
Housing units in structures - 1, detached (%)
Housing units in structures - 1, attached (%)
Housing units in structures - 2 (%)
Housing units in structures - 3 or 4 (%)
Housing units in structures - 5 to 9 (%)
Housing units in structures - 10 to 19 (%)
Housing units in structures - 20 to 49 (%)
Housing units in structures - 50 or more (%)
Housing units in structures - Mobile home (%)
Housing units in structures - Boat, RV, van, etc. (%)
House/condo owner moved in on average (years ago)
Renter moved in on average (years ago)
Year householder moved into unit - Moved in 1999 to March 2000 (%)
Year householder moved into unit - Moved in 1995 to 1998 (%)
Year householder moved into unit - Moved in 1990 to 1994 (%)
Year householder moved into unit - Moved in 1980 to 1989 (%)
Year householder moved into unit - Moved in 1970 to 1979 (%)
Year householder moved into unit - Moved in 1969 or earlier (%)
Means of transportation to work - Drove car alone (%)
Means of transportation to work - Carpooled (%)
Means of transportation to work - Public transportation (%)
Means of transportation to work - Bus or trolley bus (%)
Means of transportation to work - Streetcar or trolley car (%)
Means of transportation to work - Subway or elevated (%)
Means of transportation to work - Railroad (%)
Means of transportation to work - Ferryboat (%)
Means of transportation to work - Taxicab (%)
Means of transportation to work - Motorcycle (%)
Means of transportation to work - Bicycle (%)
Means of transportation to work - Walked (%)
Means of transportation to work - Other means (%)
Working at home (%)
Industry diversity
Most Common Industries - Agriculture, forestry, fishing and hunting, and mining (%)
Most Common Industries - Agriculture, forestry, fishing and hunting (%)
Most Common Industries - Mining, quarrying, and oil and gas extraction (%)
Most Common Industries - Construction (%)
Most Common Industries - Manufacturing (%)
Most Common Industries - Wholesale trade (%)
Most Common Industries - Retail trade (%)
Most Common Industries - Transportation and warehousing, and utilities (%)
Most Common Industries - Transportation and warehousing (%)
Most Common Industries - Utilities (%)
Most Common Industries - Information (%)
Most Common Industries - Finance and insurance, and real estate and rental and leasing (%)
Most Common Industries - Finance and insurance (%)
Most Common Industries - Real estate and rental and leasing (%)
Most Common Industries - Professional, scientific, and management, and administrative and waste management services (%)
Most Common Industries - Professional, scientific, and technical services (%)
Most Common Industries - Management of companies and enterprises (%)
Most Common Industries - Administrative and support and waste management services (%)
Most Common Industries - Educational services, and health care and social assistance (%)
Most Common Industries - Educational services (%)
Most Common Industries - Health care and social assistance (%)
Most Common Industries - Arts, entertainment, and recreation, and accommodation and food services (%)
Most Common Industries - Arts, entertainment, and recreation (%)
Most Common Industries - Accommodation and food services (%)
Most Common Industries - Other services, except public administration (%)
Most Common Industries - Public administration (%)
Occupation diversity
Most Common Occupations - Management, business, science, and arts occupations (%)
Most Common Occupations - Management, business, and financial occupations (%)
Most Common Occupations - Management occupations (%)
Most Common Occupations - Business and financial operations occupations (%)
Most Common Occupations - Computer, engineering, and science occupations (%)
Most Common Occupations - Computer and mathematical occupations (%)
Most Common Occupations - Architecture and engineering occupations (%)
Most Common Occupations - Life, physical, and social science occupations (%)
Most Common Occupations - Education, legal, community service, arts, and media occupations (%)
Most Common Occupations - Community and social service occupations (%)
Most Common Occupations - Legal occupations (%)
Most Common Occupations - Education, training, and library occupations (%)
Most Common Occupations - Arts, design, entertainment, sports, and media occupations (%)
Most Common Occupations - Healthcare practitioners and technical occupations (%)
Most Common Occupations - Health diagnosing and treating practitioners and other technical occupations (%)
Most Common Occupations - Health technologists and technicians (%)
Most Common Occupations - Service occupations (%)
Most Common Occupations - Healthcare support occupations (%)
Most Common Occupations - Protective service occupations (%)
Most Common Occupations - Fire fighting and prevention, and other protective service workers including supervisors (%)
Most Common Occupations - Law enforcement workers including supervisors (%)
Most Common Occupations - Food preparation and serving related occupations (%)
Most Common Occupations - Building and grounds cleaning and maintenance occupations (%)
Most Common Occupations - Personal care and service occupations (%)
Most Common Occupations - Sales and office occupations (%)
Most Common Occupations - Sales and related occupations (%)
Most Common Occupations - Office and administrative support occupations (%)
Most Common Occupations - Natural resources, construction, and maintenance occupations (%)
Most Common Occupations - Farming, fishing, and forestry occupations (%)
Most Common Occupations - Construction and extraction occupations (%)
Most Common Occupations - Installation, maintenance, and repair occupations (%)
Most Common Occupations - Production, transportation, and material moving occupations (%)
Most Common Occupations - Production occupations (%)
Most Common Occupations - Transportation occupations (%)
Most Common Occupations - Material moving occupations (%)
People in Group quarters - Institutionalized population (%)
People in Group quarters - Correctional institutions (%)
People in Group quarters - Federal prisons and detention centers (%)
People in Group quarters - Halfway houses (%)
People in Group quarters - Local jails and other confinement facilities (including police lockups) (%)
People in Group quarters - Military disciplinary barracks (%)
People in Group quarters - State prisons (%)
People in Group quarters - Other types of correctional institutions (%)
People in Group quarters - Nursing homes (%)
People in Group quarters - Hospitals/wards, hospices, and schools for the handicapped (%)
People in Group quarters - Hospitals/wards and hospices for chronically ill (%)
People in Group quarters - Hospices or homes for chronically ill (%)
People in Group quarters - Military hospitals or wards for chronically ill (%)
People in Group quarters - Other hospitals or wards for chronically ill (%)
People in Group quarters - Hospitals or wards for drug/alcohol abuse (%)
People in Group quarters - Mental (Psychiatric) hospitals or wards (%)
People in Group quarters - Schools, hospitals, or wards for the mentally retarded (%)
People in Group quarters - Schools, hospitals, or wards for the physically handicapped (%)
People in Group quarters - Institutions for the deaf (%)
People in Group quarters - Institutions for the blind (%)
People in Group quarters - Orthopedic wards and institutions for the physically handicapped (%)
People in Group quarters - Wards in general hospitals for patients who have no usual home elsewhere (%)
People in Group quarters - Wards in military hospitals for patients who have no usual home elsewhere (%)
People in Group quarters - Juvenile institutions (%)
People in Group quarters - Long-term care (%)
People in Group quarters - Homes for abused, dependent, and neglected children (%)
People in Group quarters - Residential treatment centers for emotionally disturbed children (%)
People in Group quarters - Training schools for juvenile delinquents (%)
People in Group quarters - Short-term care, detention or diagnostic centers for delinquent children (%)
People in Group quarters - Type of juvenile institution unknown (%)
People in Group quarters - Noninstitutionalized population (%)
People in Group quarters - College dormitories (includes college quarters off campus) (%)
People in Group quarters - Military quarters (%)
People in Group quarters - On base (%)
People in Group quarters - Barracks, unaccompanied personnel housing (UPH), (Enlisted/Officer), ;and similar group living quarters for military personnel (%)
People in Group quarters - Transient quarters for temporary residents (%)
People in Group quarters - Military ships (%)
People in Group quarters - Group homes (%)
People in Group quarters - Homes or halfway houses for drug/alcohol abuse (%)
People in Group quarters - Homes for the mentally ill (%)
People in Group quarters - Homes for the mentally retarded (%)
People in Group quarters - Homes for the physically handicapped (%)
People in Group quarters - Other group homes (%)
People in Group quarters - Religious group quarters (%)
People in Group quarters - Dormitories (%)
People in Group quarters - Agriculture workers' dormitories on farms (%)
People in Group quarters - Job Corps and vocational training facilities (%)
People in Group quarters - Other workers' dormitories (%)
People in Group quarters - Crews of maritime vessels (%)
People in Group quarters - Other nonhousehold living situations (%)
People in Group quarters - Other noninstitutional group quarters (%)
Residents speaking English at home (%)
Residents speaking English at home - Born in the United States (%)
Residents speaking English at home - Native, born elsewhere (%)
Residents speaking English at home - Foreign born (%)
Residents speaking Spanish at home (%)
Residents speaking Spanish at home - Born in the United States (%)
Residents speaking Spanish at home - Native, born elsewhere (%)
Residents speaking Spanish at home - Foreign born (%)
Residents speaking other language at home (%)
Residents speaking other language at home - Born in the United States (%)
Residents speaking other language at home - Native, born elsewhere (%)
Residents speaking other language at home - Foreign born (%)
Class of Workers - Employee of private company (%)
Class of Workers - Self-employed in own incorporated business (%)
Class of Workers - Private not-for-profit wage and salary workers (%)
Class of Workers - Local government workers (%)
Class of Workers - State government workers (%)
Class of Workers - Federal government workers (%)
Class of Workers - Self-employed workers in own not incorporated business and Unpaid family workers (%)
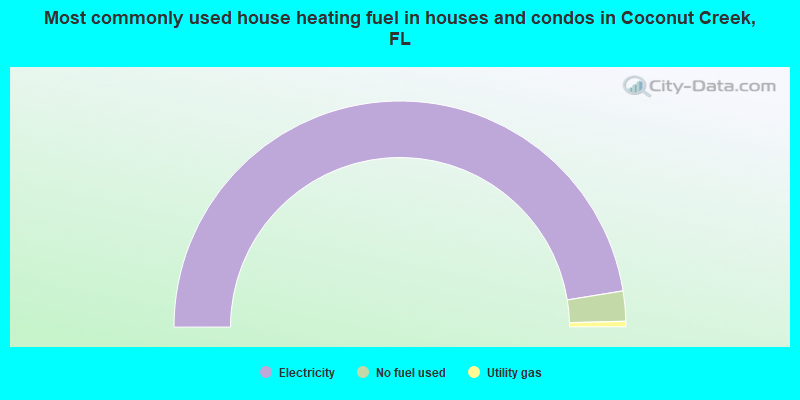
House heating fuel used in houses and condos - Utility gas (%)
House heating fuel used in houses and condos - Bottled, tank, or LP gas (%)
House heating fuel used in houses and condos - Electricity (%)
House heating fuel used in houses and condos - Fuel oil, kerosene, etc. (%)
House heating fuel used in houses and condos - Coal or coke (%)
House heating fuel used in houses and condos - Wood (%)
House heating fuel used in houses and condos - Solar energy (%)
House heating fuel used in houses and condos - Other fuel (%)
House heating fuel used in houses and condos - No fuel used (%)
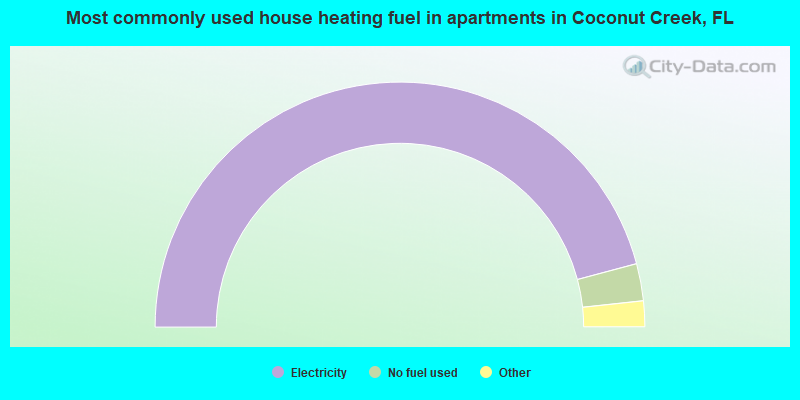
House heating fuel used in apartments - Utility gas (%)
House heating fuel used in apartments - Bottled, tank, or LP gas (%)
House heating fuel used in apartments - Electricity (%)
House heating fuel used in apartments - Fuel oil, kerosene, etc. (%)
House heating fuel used in apartments - Coal or coke (%)
House heating fuel used in apartments - Wood (%)
House heating fuel used in apartments - Solar energy (%)
House heating fuel used in apartments - Other fuel (%)
House heating fuel used in apartments - No fuel used (%)
Armed forces status - In Armed Forces (%)
Armed forces status - Civilian (%)
Armed forces status - Civilian - Veteran (%)
Armed forces status - Civilian - Nonveteran (%)
Fatal accidents locations in years 2005-2021
Fatal accidents locations in 2005
Fatal accidents locations in 2006
Fatal accidents locations in 2007
Fatal accidents locations in 2008
Fatal accidents locations in 2009
Fatal accidents locations in 2010
Fatal accidents locations in 2011
Fatal accidents locations in 2012
Fatal accidents locations in 2013
Fatal accidents locations in 2014
Fatal accidents locations in 2015
Fatal accidents locations in 2016
Fatal accidents locations in 2017
Fatal accidents locations in 2018
Fatal accidents locations in 2019
Fatal accidents locations in 2020
Fatal accidents locations in 2021
Alcohol use - People drinking some alcohol every month (%)
Alcohol use - People not drinking at all (%)
Alcohol use - Average days/month drinking alcohol
Alcohol use - Average drinks/week
Alcohol use - Average days/year people drink much
Audiometry - Average condition of hearing (%)
Audiometry - People that can hear a whisper from across a quiet room (%)
Audiometry - People that can hear normal voice from across a quiet room (%)
Audiometry - Ears ringing, roaring, buzzing (%)
Audiometry - Had a job exposure to loud noise (%)
Audiometry - Had off-work exposure to loud noise (%)
Blood Pressure & Cholesterol - Has high blood pressure (%)
Blood Pressure & Cholesterol - Checking blood pressure at home (%)
Blood Pressure & Cholesterol - Frequently checking blood cholesterol (%)
Blood Pressure & Cholesterol - Has high cholesterol level (%)
Consumer Behavior - Money monthly spent on food at supermarket/grocery store
Consumer Behavior - Money monthly spent on food at other stores
Consumer Behavior - Money monthly spent on eating out
Consumer Behavior - Money monthly spent on carryout/delivered foods
Consumer Behavior - Income spent on food at supermarket/grocery store (%)
Consumer Behavior - Income spent on food at other stores (%)
Consumer Behavior - Income spent on eating out (%)
Consumer Behavior - Income spent on carryout/delivered foods (%)
Current Health Status - General health condition (%)
Current Health Status - Blood donors (%)
Current Health Status - Has blood ever tested for HIV virus (%)
Current Health Status - Left-handed people (%)
Dermatology - People using sunscreen (%)
Diabetes - Diabetics (%)
Diabetes - Had a blood test for high blood sugar (%)
Diabetes - People taking insulin (%)
Diet Behavior & Nutrition - Diet health (%)
Diet Behavior & Nutrition - Milk product consumption (# of products/month)
Diet Behavior & Nutrition - Meals not home prepared (#/week)
Diet Behavior & Nutrition - Meals from fast food or pizza place (#/week)
Diet Behavior & Nutrition - Ready-to-eat foods (#/month)
Diet Behavior & Nutrition - Frozen meals/pizza (#/month)
Drug Use - People that ever used marijuana or hashish (%)
Drug Use - Ever used hard drugs (%)
Drug Use - Ever used any form of cocaine (%)
Drug Use - Ever used heroin (%)
Drug Use - Ever used methamphetamine (%)
Health Insurance - People covered by health insurance (%)
Kidney Conditions-Urology - Avg. # of times urinating at night
Medical Conditions - People with asthma (%)
Medical Conditions - People with anemia (%)
Medical Conditions - People with psoriasis (%)
Medical Conditions - People with overweight (%)
Medical Conditions - Elderly people having difficulties in thinking or remembering (%)
Medical Conditions - People who ever received blood transfusion (%)
Medical Conditions - People having trouble seeing even with glass/contacts (%)
Medical Conditions - People with arthritis (%)
Medical Conditions - People with gout (%)
Medical Conditions - People with congestive heart failure (%)
Medical Conditions - People with coronary heart disease (%)
Medical Conditions - People with angina pectoris (%)
Medical Conditions - People who ever had heart attack (%)
Medical Conditions - People who ever had stroke (%)
Medical Conditions - People with emphysema (%)
Medical Conditions - People with thyroid problem (%)
Medical Conditions - People with chronic bronchitis (%)
Medical Conditions - People with any liver condition (%)
Medical Conditions - People who ever had cancer or malignancy (%)
Mental Health - People who have little interest in doing things (%)
Mental Health - People feeling down, depressed, or hopeless (%)
Mental Health - People who have trouble sleeping or sleeping too much (%)
Mental Health - People feeling tired or having little energy (%)
Mental Health - People with poor appetite or overeating (%)
Mental Health - People feeling bad about themself (%)
Mental Health - People who have trouble concentrating on things (%)
Mental Health - People moving or speaking slowly or too fast (%)
Mental Health - People having thoughts they would be better off dead (%)
Oral Health - Average years since last visit a dentist
Oral Health - People embarrassed because of mouth (%)
Oral Health - People with gum disease (%)
Oral Health - General health of teeth and gums (%)
Oral Health - Average days a week using dental floss/device
Oral Health - Average days a week using mouthwash for dental problem
Oral Health - Average number of teeth
Pesticide Use - Households using pesticides to control insects (%)
Pesticide Use - Households using pesticides to kill weeds (%)
Physical Activity - People doing vigorous-intensity work activities (%)
Physical Activity - People doing moderate-intensity work activities (%)
Physical Activity - People walking or bicycling (%)
Physical Activity - People doing vigorous-intensity recreational activities (%)
Physical Activity - People doing moderate-intensity recreational activities (%)
Physical Activity - Average hours a day doing sedentary activities
Physical Activity - Average hours a day watching TV or videos
Physical Activity - Average hours a day using computer
Physical Functioning - People having limitations keeping them from working (%)
Physical Functioning - People limited in amount of work they can do (%)
Physical Functioning - People that need special equipment to walk (%)
Physical Functioning - People experiencing confusion/memory problems (%)
Physical Functioning - People requiring special healthcare equipment (%)
Prescription Medications - Average number of prescription medicines taking
Preventive Aspirin Use - Adults 40+ taking low-dose aspirin (%)
Reproductive Health - Vaginal deliveries (%)
Reproductive Health - Cesarean deliveries (%)
Reproductive Health - Deliveries resulted in a live birth (%)
Reproductive Health - Pregnancies resulted in a delivery (%)
Reproductive Health - Women breastfeeding newborns (%)
Reproductive Health - Women that had a hysterectomy (%)
Reproductive Health - Women that had both ovaries removed (%)
Reproductive Health - Women that have ever taken birth control pills (%)
Reproductive Health - Women taking birth control pills (%)
Reproductive Health - Women that have ever used Depo-Provera or injectables (%)
Reproductive Health - Women that have ever used female hormones (%)
Sexual Behavior - People 18+ that ever had sex (vaginal, anal, or oral) (%)
Sexual Behavior - Males 18+ that ever had vaginal sex with a woman (%)
Sexual Behavior - Males 18+ that ever performed oral sex on a woman (%)
Sexual Behavior - Males 18+ that ever had anal sex with a woman (%)
Sexual Behavior - Males 18+ that ever had any sex with a man (%)
Sexual Behavior - Females 18+ that ever had vaginal sex with a man (%)
Sexual Behavior - Females 18+ that ever performed oral sex on a man (%)
Sexual Behavior - Females 18+ that ever had anal sex with a man (%)
Sexual Behavior - Females 18+ that ever had any kind of sex with a woman (%)
Sexual Behavior - Average age people first had sex
Sexual Behavior - Average number of female sex partners in lifetime (males 18+)
Sexual Behavior - Average number of female vaginal sex partners in lifetime (males 18+)
Sexual Behavior - Average age people first performed oral sex on a woman (18+)
Sexual Behavior - Average number of woman performed oral sex on in lifetime (18+)
Sexual Behavior - Average number of male sex partners in lifetime (males 18+)
Sexual Behavior - Average number of male anal sex partners in lifetime (males 18+)
Sexual Behavior - Average age people first performed oral sex on a man (18+)
Sexual Behavior - Average number of male oral sex partners in lifetime (18+)
Sexual Behavior - People using protection when performing oral sex (%)
Sexual Behavior - Average number of times people have vaginal or anal sex a year
Sexual Behavior - People having sex without condom (%)
Sexual Behavior - Average number of male sex partners in lifetime (females 18+)
Sexual Behavior - Average number of male vaginal sex partners in lifetime (females 18+)
Sexual Behavior - Average number of female sex partners in lifetime (females 18+)
Sexual Behavior - Circumcised males 18+ (%)
Sleep Disorders - Average hours sleeping at night
Sleep Disorders - People that has trouble sleeping (%)
Smoking-Cigarette Use - People smoking cigarettes (%)
Taste & Smell - People 40+ having problems with smell (%)
Taste & Smell - People 40+ having problems with taste (%)
Taste & Smell - People 40+ that ever had wisdom teeth removed (%)
Taste & Smell - People 40+ that ever had tonsils teeth removed (%)
Taste & Smell - People 40+ that ever had a loss of consciousness because of a head injury (%)
Taste & Smell - People 40+ that ever had a broken nose or other serious injury to face or skull (%)
Taste & Smell - People 40+ that ever had two or more sinus infections (%)
Weight - Average height (inches)
Weight - Average weight (pounds)
Weight - Average BMI
Weight - People that are obese (%)
Weight - People that ever were obese (%)
Weight - People trying to lose weight (%)
According to our research of Florida and other state lists, there were 10 registered sex offenders living in Coconut Creek, Florida as of April 28, 2024 . The ratio of all residents to sex offenders in Coconut Creek is 5,915 to 1.The ratio of registered sex offenders to all residents in this city is much lower than the state average.
Officers per 1,000 residents here:
1.84Florida average:
2.33
Latest news from Coconut Creek, FL collected exclusively by city-data.com from local newspapers, TV, and radio stations
Ancestries: American (8.9%), Brazilian (8.0%), Italian (7.8%), Irish (5.0%), Jamaican (4.4%), German (3.3%).
Current Local Time:
Land area: 11.5 square miles.
Population density: 4,967 people per square mile (average).
20,650 residents are foreign born (27.1% Latin America ).
This city:
35.8%Florida:
21.1%
Median real estate property taxes paid for housing units with mortgages in 2022: $3,831 (1.0%)Median real estate property taxes paid for housing units with no mortgage in 2022: $1,589 (0.8%)
Nearest city with pop. 50,000+: Margate, FL
Nearest city with pop. 200,000+: Hialeah, FL
Nearest city with pop. 1,000,000+: Houston, TX
Nearest cities:
Godfrey Road, FL (1.6 miles),
Hillsboro Ranches, FL (1.8 miles),
Crystal Lake, FL (1.9 miles),
Latitude: 26.28 N, Longitude: 80.18 W
Nickname or alias (official or unofficial): Butterfly capital of the world
Daytime population change due to commuting: -10,865 (-18.8%)Workers who live and work in this city: 7,517 (25.1%)
Property values in Coconut Creek, FL
Coconut Creek tourist attractions:
Single-family new house construction building permits:
2020: 4 buildings , average cost: $141,7002019: 12 buildings , average cost: $136,1002018: 16 buildings , average cost: $137,2002017: 35 buildings , average cost: $146,5002016: 93 buildings , average cost: $103,8002015: 45 buildings , average cost: $106,7002014: 41 buildings , average cost: $119,6002013: 70 buildings , average cost: $203,8002012: 76 buildings , average cost: $196,2002011: 64 buildings , average cost: $203,6002010: 77 buildings , average cost: $204,4002009: 18 buildings , average cost: $213,4002008: 49 buildings , average cost: $207,6002007: 45 buildings , average cost: $258,9002006: 132 buildings , average cost: $211,4002005: 133 buildings , average cost: $208,2002004: 3 buildings , average cost: $122,8002003: 3 buildings , average cost: $425,0002002: 326 buildings , average cost: $71,3002001: 343 buildings , average cost: $102,6002000: 556 buildings , average cost: $96,9001999: 361 buildings , average cost: $96,1001998: 570 buildings , average cost: $99,2001997: 487 buildings , average cost: $94,400Unemployment in December 2023:
Population change in the 1990s: +16,173 (+59.0%).
Most common occupations in Coconut Creek, FL (%)
Both Males Females
Other sales and related occupations, including supervisors (6.7%)
Other management occupations, except farmers and farm managers (5.6%)
Sales representatives, services, wholesale and manufacturing (4.4%)
Other office and administrative support workers, including supervisors (4.2%)
Secretaries and administrative assistants (4.1%)
Computer specialists (3.4%)
Retail sales workers, except cashiers (3.4%)
Other sales and related occupations, including supervisors (7.0%)
Other management occupations, except farmers and farm managers (6.9%)
Computer specialists (5.3%)
Sales representatives, services, wholesale and manufacturing (5.1%)
Electrical equipment mechanics and other installation, maintenance, and repair workers, including supervisors (3.8%)
Driver/sales workers and truck drivers (3.5%)
Law enforcement workers, including supervisors (3.0%)
Secretaries and administrative assistants (8.5%)
Other sales and related occupations, including supervisors (6.4%)
Other office and administrative support workers, including supervisors (6.3%)
Preschool, kindergarten, elementary, and middle school teachers (4.5%)
Other management occupations, except farmers and farm managers (4.1%)
Information and record clerks, except customer service representatives (4.0%)
Retail sales workers, except cashiers (3.8%)
Tornado activity:
Coconut Creek-area historical tornado activity is slightly below Florida state average. It is 24% smaller than the overall U.S. average.
On 3/1/1980, a category F3 (max. wind speeds 158-206 mph) tornado 6.7 miles away from the Coconut Creek city center killed one person and injured 33 people and caused between $5,000,000 and $50,000,000 in damages.
On 2/23/1965, a category F3 tornado 8.3 miles away from the city center injured 6 people and caused between $50,000 and $500,000 in damages.
Earthquake activity:
Coconut Creek-area historical earthquake activity is slightly above Florida state average. It is 95% smaller than the overall U.S. average. On 9/10/2006 at 14:56:08, a magnitude 5.9 (5.9 MB, 5.5 MS, 5.8 MW, Class: Moderate, Intensity: VI - VII) earthquake occurred 399.7 miles away from Coconut Creek center On 2/22/1992 at 04:21:34, a magnitude 3.2 (3.2 MB, Depth: 6.2 mi, Class: Light, Intensity: II - III) earthquake occurred 80.6 miles away from the city center On 6/23/2016 at 17:20:29, a magnitude 3.8 (3.8 ML) earthquake occurred 261.2 miles away from Coconut Creek center On 7/16/2016 at 20:00:10, a magnitude 3.7 (3.7 MB) earthquake occurred 245.7 miles away from the city center On 9/21/2016 at 16:30:52, a magnitude 3.8 (3.8 ML) earthquake occurred 266.1 miles away from Coconut Creek center On 9/4/2016 at 18:29:29, a magnitude 3.8 (3.8 ML) earthquake occurred 267.1 miles away from the city center Magnitude types: body-wave magnitude (MB), local magnitude (ML), surface-wave magnitude (MS), moment magnitude (MW) Natural disasters: The number of natural disasters in Broward County (27) is a lot greater than the US average (15).Major Disasters (Presidential) Declared: 15Emergencies Declared: 8Hurricanes: 16, Fires: 3, Floods: 3, Tornadoes: 3, Freezes: 2, Tropical Storms: 2, Heavy Rain: 1, Storm: 1, Wind: 1, Other: 2 (Note: some incidents may be assigned to more than one category). Main business address for: SINGING MACHINE CO INC PHONOGRAPH RECORDS & PRERECORDED AUDIO TAPES & DISKS ).
Hospitals and medical centers in Coconut Creek: PARKCREEK SURGERY CENTER (6806 NORTH STATE ROAD 7) HEARTLAND HOME HEALTH CARE (4855 W HILLSBORO BLVD STE B-4)
HEALTH CENTER OF COCONUT CREEK, THE (4125 WEST SAMPLE RD)
Amtrak stations near Coconut Creek: 5 miles: DEERFIELD BEACH (1300 W. HILLSBORO BLVD.) Services: ticket office, fully wheelchair accessible, enclosed waiting area, public restrooms, public payphones, free short-term parking, free long-term parking, call for taxi service, public transit connection.
11 miles: FORT LAUDERDALE (200 SW 21ST TERRACE) Services: ticket office, partially wheelchair accessible, enclosed waiting area, public restrooms, public payphones, vending machines, free short-term parking, free long-term parking, call for car rental service, call for taxi service, public transit connection.
14 miles: DELRAY BEACH (345 S. CONGRESS AVE.) Services: enclosed waiting area, public restrooms, public payphones, vending machines, free short-term parking, free long-term parking, call for car rental service, call for taxi service, public transit connection.
College/University in Coconut Creek: Atlantic Technical Center Full-time enrollment: 1,295; Location: 4700 Coconut Creek Parkway; Public; Website: www.atlantictechcenter.com)
Colleges/universities with over 2000 students nearest to Coconut Creek:
Everest University-Pompano Beach (about 6 miles; Pompano Beach, FL ; Full-time enrollment: 2,316)
Keiser University-Ft Lauderdale (about 7 miles; Fort Lauderdale, FL ; FT enrollment: 18,270)
Lynn University (about 9 miles; Boca Raton, FL ; FT enrollment: 2,151)
Florida Atlantic University (about 9 miles; Boca Raton, FL ; FT enrollment: 24,403)
Broward College (about 14 miles; Fort Lauderdale, FL ; FT enrollment: 30,322)
Nova Southeastern University (about 15 miles; Fort Lauderdale, FL ; FT enrollment: 25,621)
DeVry University-Florida (about 23 miles; Miramar, FL ; FT enrollment: 3,674)
Public high schools in Coconut Creek: COCONUT CREEK HIGH SCHOOL Location: 1400 NW 44TH AVE, Grades: 9-12)
MONARCH HIGH SCHOOL Location: 5050 WILES RD, Grades: 9-12)
BROWARD VIRTUAL FRANCHISE Location: 1400 NW 44TH AVE, Grades: 6-12)
Private high schools in Coconut Creek: NORTH BROWARD PREPARATORY SCHOOL Students: 1,435, Location: 7600 LYONS RD, Grades: PK-12)
RANDAZZO SCHOOL Students: 83, Location: 2251 NW 36TH AVE, Grades: KG-12)
SOUTH FLORIDA ACADEMY OF LEARNING Students: 45, Location: 4640 NW 74TH PL, Grades: KG-12)
Public elementary/middle schools in Coconut Creek: WINSTON PARK ELEMENTARY SCHOOL Students: 595, Location: 4000 WINSTON PARK BLVD, Grades: PK-5)TRADEWINDS ELEMENTARY SCHOOL Students: 533, Location: 5400 JOHNSON RD, Grades: PK-5)LYONS CREEK MIDDLE SCHOOL Students: 110, Location: 4333 SOL PRESS BLVD, Grades: 6-8)COCONUT CREEK ELEMENTARY SCHOOL Location: 500 NW 45TH AVE, Grades: PK-5)
BROWARD VIRTUAL INSTRUCTION PROGRAM Location: 1400 NW 44TH AVE, Grades: KG-8)
BROWARD VIRTUAL INSTRUCTION PROGRAM (DISTRICT PROV Location: 1400 NW 44TH AVE, Grades: KG-6)
See full list of schools located in Coconut Creek
Notable locations in Coconut Creek: (A) , Shadow Wood Country Club (B) , Coconut Creek Plaza (C) , Broward Community College - North Campus Library (D) , Health Center of Coconut Creek (E) , Coconut Creek Fire Department (F) , Margate Fire Department Station 4 (G) , The Renfrew Center Treatment Facility (H) , Coconut Creek Police Department (I) . Display/hide their locations on the map
Main business address in Coconut Creek: (A) . Display/hide its location on the map
Churches in Coconut Creek include: (A) , All Saints Lutheran Church (B) , Calvary Presbyterian Church (C) , Saint Luke Catholic Church (D) , Calvary Church (E) . Display/hide their locations on the map
Park in Coconut Creek: (1) . Display/hide its location on the map
Birthplace of: Andrew Yogan - Ice hockey player, Darrell McClover - 2005 NFL player (New York Jets, born : Aug 25, 1981), Brice Hunter - Football player.
Broward County has a predicted average indoor radon screening level less than 2 pCi/L (pico curies per liter) - Low Potential Drinking water stations with addresses in Coconut Creek and their reported violations in the past:
LEVITT-WEINSTEIN FUNERAL HOME (Population served: 25, Groundwater):
Past monitoring violations:
Monitoring, Source Water (GWR) - In DEC-01-2012, Contaminant: E. COLI. Follow-up actions: St Compliance achieved (DEC-13-2012)
Failure to Conduct Assessment Monitoring - Between JUL-2012 and SEP-2012, Contaminant: E. COLI. Follow-up actions: St Compliance achieved (SEP-25-2012)
3 routine major monitoring violations
2 minor monitoring violations
2 regular monitoring violations
Drinking water stations with addresses in Coconut Creek that have no violations reported:
COCONUT CREEK, CITY OF (Population served: 58,874, Primary Water Source Type: Purch groundwater)
Average household size: This city:
2.3 peopleFlorida:
2.5 people
Percentage of family households: This city:
59.9%Whole state:
65.2%
Percentage of households with unmarried partners: This city:
7.0%Whole state:
7.3%
Likely homosexual households (counted as self-reported same-sex unmarried-partner households)
Lesbian couples: 0.4% of all households Gay men: 0.4% of all households
People in group quarters in Coconut Creek in 2010:
68 people in group homes for juveniles (non-correctional)
65 people in nursing facilities/skilled-nursing facilities
6 people in group homes intended for adults
5 people in residential treatment centers for juveniles (non-correctional)
2 people in workers' group living quarters and job corps centers
People in group quarters in Coconut Creek in 2000:
113 people in nursing homes
65 people in other group homes
19 people in other noninstitutional group quarters
Banks with most branches in Coconut Creek (2011 data):
Wells Fargo Bank, National Association: Winston Park Branch at 5321 Lyons Road, branch established on 2004/02/23; Coconut Creek Branch at 4901 Coconut Creek Parkway, branch established on 1950/08/16. Info updated 2011/04/05: Bank assets: $1,161,490.0 mil, Deposits: $905,653.0 mil, headquarters in Sioux Falls, SD, positive income , 6395 total offices , Holding Company: Wells Fargo & Company
Bank of America, National Association: Parkland Branch at 6650 North State Road 7, branch established on 1994/03/07; Coconut Creek Banking Center Branch at 4803 Coconut Creek Parkway, branch established on 1985/06/30. Info updated 2009/11/18: Bank assets: $1,451,969.3 mil, Deposits: $1,077,176.8 mil, headquarters in Charlotte, NC, positive income , 5782 total offices , Holding Company: Bank Of America Corporation
JPMorgan Chase Bank, National Association: 4809 Coconut Creek Pkwy Branch at 4809 Coconut Creek Parkway, branch established on 1988/06/30; Coconut Creek Branch at 6500 N. State Road 7, branch established on 1994/10/24. Info updated 2011/11/10: Bank assets: $1,811,678.0 mil, Deposits: $1,190,738.0 mil, headquarters in Columbus, OH, positive income , International Specialization, 5577 total offices , Holding Company: Jpmorgan Chase & Co.
Citibank, National Association: Coconut Creek Branch at 4807 Coconut Creek Parkway, branch established on 1984/08/20. Info updated 2012/01/10: Bank assets: $1,288,658.0 mil, Deposits: $882,541.0 mil, headquarters in Sioux Falls, SD, positive income , International Specialization, 1048 total offices , Holding Company: Citigroup Inc.
BankUnited, National Association: Coconut Creek Branch at 4913 Coconut Creek Parkway, branch established on 1997/11/03. Info updated 2012/03/05: Bank assets: $11,197.9 mil, Deposits: $7,515.1 mil, headquarters in Miami Lakes, FL, positive income , 82 total offices
Great Florida Bank: Coconut Creek Branch at 6135 Lyons Road, branch established on 2008/03/28. Info updated 2010/08/19: Bank assets: $1,145.7 mil, Deposits: $994.9 mil, headquarters in Coral Gables, FL, negative income in the last year , Commercial Lending Specialization, 26 total offices
Regions Bank: Margate/Coconut Creek Branch at 4808 Coconut Creek Pkwy, branch established on 2010/04/19. Info updated 2011/02/24: Bank assets: $123,368.2 mil, Deposits: $98,301.3 mil, headquarters in Birmingham, AL, positive income , Commercial Lending Specialization, 1778 total offices , Holding Company: Regions Financial Corporation
PNC Bank, National Association: Coconut Creek Branch at 4650 Lyons Road, branch established on 2006/08/21. Info updated 2012/03/20: Bank assets: $263,309.6 mil, Deposits: $197,343.0 mil, headquarters in Wilmington, DE, positive income , Commercial Lending Specialization, 3085 total offices , Holding Company: Pnc Financial Services Group, Inc., The
SunTrust Bank: Coconut Creek Branch at 4850 Wiles Road, branch established on 2009/08/03. Info updated 2010/05/27: Bank assets: $171,291.7 mil, Deposits: $129,833.2 mil, headquarters in Atlanta, GA, positive income , Commercial Lending Specialization, 1716 total offices , Holding Company: Suntrust Banks, Inc.
3 other banks with 3 local branches
For population 15 years and over in Coconut Creek:
Never married: 31.1%Now married: 46.1%Separated: 1.7%Widowed: 7.0%Divorced: 14.0% For population 25 years and over in Coconut Creek:
High school or higher: 92.9%Bachelor's degree or higher: 36.4%Graduate or professional degree: 11.8%Unemployed: 3.1%Mean travel time to work (commute): 25.3 minutes
Education Gini index (Inequality in education) Here:
11.4Florida average:
12.2
Religion statistics for Coconut Creek, FL (based on Broward County data)
Religion Adherents Congregations Catholic 280,324 47 Evangelical Protestant 221,258 701 Other 63,064 143 Mainline Protestant 53,412 88 Black Protestant 17,866 45 Orthodox 5,648 16 None 1,106,494 -
Source: Clifford Grammich, Kirk Hadaway, Richard Houseal, Dale E.Jones, Alexei Krindatch, Richie Stanley and Richard H.Taylor. 2012. 2010 U.S.Religion Census: Religious Congregations & Membership Study. Association of Statisticians of American Religious Bodies. Jones, Dale E., et al. 2002. Congregations and Membership in the United States 2000. Nashville, TN: Glenmary Research Center. Graphs represent county-level data
Food Environment Statistics: Number of grocery stores : 359Here :
2.05 / 10,000 pop.Florida :
2.04 / 10,000 pop.
Number of supercenters and club stores : 15Broward County :
0.09 / 10,000 pop.Florida :
0.11 / 10,000 pop.
Number of convenience stores (no gas) : 268Broward County :
1.53 / 10,000 pop.Florida :
1.28 / 10,000 pop.
Number of convenience stores (with gas) : 391This county :
2.24 / 10,000 pop.Florida :
3.04 / 10,000 pop.
Number of full-service restaurants : 1,399Here :
8.00 / 10,000 pop.Florida :
7.45 / 10,000 pop.
Adult diabetes rate : Broward County :
8.4%Florida :
9.2%
Adult obesity rate : Broward County :
20.6%Florida :
23.7%
Low-income preschool obesity rate : Broward County :
14.0%State :
14.0%
Health and Nutrition: Healthy diet rate : Coconut Creek:
54.4%State:
51.4%
Average overall health of teeth and gums : Coconut Creek:
52.7%Florida:
49.4%
Average BMI : Coconut Creek:
28.4Florida:
28.6
People feeling badly about themselves : Coconut Creek:
17.9%Florida:
19.5%
People not drinking alcohol at all : This city:
11.0%Florida:
10.7%
Average hours sleeping at night : Coconut Creek:
7.0Florida:
6.9
General health condition : Coconut Creek:
59.2%State:
57.0%
Average condition of hearing : Coconut Creek:
78.4%State:
79.2%
More about Health and Nutrition of Coconut Creek, FL Residents
Local government employment and payroll (March 2022)
Function
Full-time employees
Monthly full-time payroll
Average yearly full-time wage
Part-time employees
Monthly part-time payroll
Police Protection - Officers
107 $927,860 $104,059 0 $0 Other and Unallocable
77 $417,076 $64,999 1 $1,140 Firefighters
70 $525,702 $90,120 0 $0 Parks and Recreation
45 $226,823 $60,486 9 $10,172 Police - Other
39 $197,999 $60,923 0 $0 Financial Administration
38 $273,163 $86,262 0 $0 Water Supply
29 $163,195 $67,529 0 $0 Other Government Administration
18 $163,425 $108,950 5 $14,776 Sewerage
10 $44,932 $53,918 0 $0 Transit
10 $39,833 $47,800 1 $762 Streets and Highways
7 $49,297 $84,509 0 $0 Judicial and Legal
5 $69,179 $166,030 0 $0 Fire - Other
4 $18,208 $54,624 0 $0 Natural Resources
1 $7,117 $85,404 0 $0 Housing and Community Development (Local)
1 $7,188 $86,256 0 $0 Solid Waste Management
1 $2,788 $33,456 0 $0
Totals for Government
462 $3,133,784 $81,397 16 $26,850
Coconut Creek government finances - Expenditure in 2021 (per resident):
Construction - Regular Highways: $1,848,000 ($32.22)
General - Other: $438,000 ($7.64)Current Operations - Police Protection: $22,575,000 ($393.65)
Water Utilities: $20,295,000 ($353.89)Local Fire Protection: $10,820,000 ($188.67)Natural Resources - Other: $8,466,000 ($147.63)Parks and Recreation: $4,488,000 ($78.26)Central Staff Services: $3,066,000 ($53.46)Protective Inspection and Regulation - Other: $2,603,000 ($45.39)General - Other: $2,421,000 ($42.22)Financial Administration: $1,954,000 ($34.07)Sewerage: $1,259,000 ($21.95)Judicial and Legal Services: $912,000 ($15.90)Regular Highways: $867,000 ($15.12)Transit Utilities: $704,000 ($12.28)Housing and Community Development: $76,000 ($1.33)General - Interest on Debt: $643,000 ($11.21)
Other Capital Outlay - Natural Resources - Other: $3,516,000 ($61.31)
Parks and Recreation: $2,021,000 ($35.24)Local Fire Protection: $884,000 ($15.41)Police Protection: $273,000 ($4.76)
Coconut Creek government finances - Revenue in 2021 (per resident):
Charges - Other: $11,757,000 ($205.01)
Sewerage: $8,888,000 ($154.98)Natural Resources - Other: $1,788,000 ($31.18)Parks and Recreation: $374,000 ($6.52)Federal Intergovernmental - Other: $611,000 ($10.65)
Local Intergovernmental - General Local Government Support: $1,639,000 ($28.58)
Miscellaneous - Special Assessments: $8,576,000 ($149.54)
Interest Earnings: $2,018,000 ($35.19)General Revenue - Other: $1,210,000 ($21.10)Fines and Forfeits: $540,000 ($9.42)Donations From Private Sources: $145,000 ($2.53)Rents: $126,000 ($2.20)Revenue - Water Utilities: $13,287,000 ($231.69)
State Intergovernmental - General Local Government Support: $5,552,000 ($96.81)
Other: $434,000 ($7.57)Housing and Community Development: $332,000 ($5.79)Highways: $30,000 ($0.52)Tax - Property: $27,599,000 ($481.25)
Public Utilities Sales: $6,600,000 ($115.09)Occupation and Business License - Other: $4,748,000 ($82.79)Other License: $1,282,000 ($22.35)Other Selective Sales: $931,000 ($16.23)
Coconut Creek government finances - Debt in 2021 (per resident):
Long Term Debt - Beginning Outstanding - Unspecified Public Purpose: $22,140,000 ($386.06)
Outstanding Unspecified Public Purpose: $20,210,000 ($352.41)Retired Unspecified Public Purpose: $2,518,000 ($43.91)
Coconut Creek government finances - Cash and Securities in 2021 (per resident):
Other Funds - Cash and Securities: $119,640,000 ($2086.21)
6.62% of this county's 2021 resident taxpayers lived in other counties in 2020 ($102,632 average adjusted gross income )
Here:
6.62%Florida average:
8.80%
0.03% of residents moved from foreign countries ($231 average AGI )Broward County:
0.03%Florida average:
0.05%
Top counties from which taxpayers relocated into this county between 2020 and 2021:
6.99% of this county's 2020 resident taxpayers moved to other counties in 2021 ($73,182 average adjusted gross income )
Here:
6.99%Florida average:
7.45%
0.03% of residents moved to foreign countries ($336 average AGI )Broward County:
0.03%Florida average:
0.04%
Top counties to which taxpayers relocated from this county between 2020 and 2021:
Businesses in Coconut Creek, FL
Name Count Name Count
7-Eleven 2 Kohl's 1 AT&T 1 LA Fitness 1 Advance Auto Parts 1 Lane Bryant 1 BMW 1 Lane Furniture 1 Banana Republic 1 LensCrafters 1 Baskin-Robbins 1 MasterBrand Cabinets 1 Burger King 1 Mazda 1 CVS 2 McDonald's 3 Chevrolet 1 New York & Co 1 Chico's 1 Publix Super Markets 4 Cold Stone Creamery 1 Soma Intimates 1 Coldwater Creek 1 Staples 1 Dairy Queen 1 Starbucks 2 Dunkin Donuts 2 Subaru 1 FedEx 8 Subway 1 Firestone Complete Auto Care 1 Talbots 1 GNC 2 The Room Place 1 H&R Block 1 Toyota 1 Home Depot 1 U-Haul 1 Hyundai 1 UPS 7 Jimmy John's 1 Volkswagen 1 JoS. A. Bank 1 Walgreens 4 Justice 1 Walmart 1
Strongest AM radio stations in Coconut Creek:
WWNN (1470 AM; 50 kW; POMPANO BEACH, FL; Owner: WWNN LICENSE, LLC)
WLVJ (1040 AM; 25 kW; BOYNTON BEACH, FL; Owner: JAMES CRYSTAL BOYNTON BEACH, INC.)
WHSR (980 AM; 5 kW; POMPANO BEACH, FL; Owner: WWNN LICENSE, LLC)
WAQI (710 AM; 50 kW; MIAMI, FL; Owner: LICENSE CORPORATION #1)
WRFX (940 AM; 50 kW; MIAMI, FL; Owner: CLEAR CHANNEL BROADCASTING LICENSES, INC.)
WFTL (850 AM; 50 kW; WEST PALM BEACH, FL; Owner: JAMES CRYSTAL ENTERPRISES II, L.L.C.)
WSBR (740 AM; 2 kW; BOCA RATON, FL; Owner: WWNN LICENSE, LLC)
WWFE (670 AM; 50 kW; MIAMI, FL; Owner: FENIX BROADCASTING CORP.)
WNMA (1210 AM; 49 kW; MIAMI SPRINGS, FL; Owner: RADIO UNICA OF MIAMI LICENSE CORP.)
WEXY (1520 AM; 4 kW; WILTON MANORS, FL; Owner: MULTICULTURAL RADIO BROADCASTING, INC.)
WJNA (640 AM; 38 kW; ROYAL PALM BEACH, FL; Owner: SOUTH FLORIDA RADIO, INC.)
WSRF (1580 AM; 10 kW; FORT LAUDERDALE, FL; Owner: URBAN RADIO OF FLORIDA, LLC)
WSUA (1260 AM; 50 kW; MIAMI, FL; Owner: WSUA BROADCASTING CORPORATION)
Strongest FM radio stations in Coconut Creek:
WEDR (99.1 FM; MIAMI, FL; Owner: COX RADIO, INC.)
WEAT-FM (104.3 FM; WEST PALM BEACH, FL; Owner: INFINITY RADIO OPERATIONS INC.)
WAFG (90.3 FM; FORT LAUDERDALE, FL; Owner: WESTMINSTER ACADEMY)
WBGG-FM (105.9 FM; FORT LAUDERDALE, FL; Owner: CLEAR CHANNEL BROADCASTING LICENSES, INC.)
WHYI-FM (100.7 FM; FORT LAUDERDALE, FL; Owner: CLEAR CHANNEL BROADCASTING LICENSES, INC.)
WKIS (99.9 FM; BOCA RATON, FL; Owner: WKIS LICENSE LIMITED PARTNERSHIP)
WRMA (106.7 FM; FORT LAUDERDALE, FL; Owner: WRMA LICENSING, INC.)
WXEL (90.7 FM; WEST PALM BEACH, FL; Owner: BARRY TELECOMMUNICATIONS, INC.)
WFLC (97.3 FM; MIAMI, FL; Owner: COX RADIO, INC.)
WPYM (93.1 FM; MIAMI, FL; Owner: COX RADIO-MIAMI, LLC)
WHQT (105.1 FM; CORAL GABLES, FL; Owner: COX RADIO, INC.)
WLVE (93.9 FM; MIAMI BEACH, FL; Owner: CLEAR CHANNEL BROADCASTING LICENSES, INC.)
WMIB (103.5 FM; FORT LAUDERDALE, FL; Owner: CLEAR CHANNEL BROADCASTING LICENSES, INC.)
WMXJ (102.7 FM; POMPANO BEACH, FL; Owner: JEFFERSON-PILOT COMMUNICATIONS CO. OF FLORIDA)
WPOW (96.5 FM; MIAMI, FL; Owner: WPOW LICENSE LIMITED PARTNERSHIP)
WZTA (94.9 FM; MIAMI BEACH, FL; Owner: CLEAR CHANNEL BROADCASTING LICENSES, INC.)
WLRN-FM (91.3 FM; MIAMI, FL; Owner: THE SCHOOL BOARD OF MIAMI - DADE COUNTY, FL)
WRMF (97.9 FM; PALM BEACH, FL; Owner: PBB LICENSES, LLC)
WXDJ (95.7 FM; NORTH MIAMI BEACH, FL; Owner: WXDJ LICENSING, INC.)
WLYF (101.5 FM; MIAMI, FL; Owner: JEFFERSON-PILOT COMMUNICATIONS CO. OF FLORIDA)
TV broadcast stations around Coconut Creek:
WHDT-LP (Channel 44; MIAMI, FL; Owner: GUENTER MARKSTEINER)
WPTV (Channel 5; WEST PALM BEACH, FL; Owner: SCRIPPS HOWARD BROADCASTING COMPANY)
WFLX (Channel 29; WEST PALM BEACH, FL; Owner: RAYCOM NATIONAL, INC.)
WXEL-TV (Channel 42; WEST PALM BEACH, FL; Owner: BARRY TELECOMMUNICATIONS, INC.)
WDLP-CA (Channel 21; POMPANO BEACH, FL; Owner: WDLP BROADCASTING COMPANY, LLC)
WPBT (Channel 2; MIAMI, FL; Owner: COMMUNITY TV FOUNDATION OF S. FLORIDA, INC.)
WSVN (Channel 7; MIAMI, FL; Owner: SUNBEAM TELEVISION CORP.)
W58BU (Channel 58; HALLANDALE, FL; Owner: NBC STATIONS MANAGEMENT,INC.)
WPPB-TV (Channel 63; BOCA RATON, FL; Owner: THE SCHOOL BOARD OF BROWARD COUNTY, FLORIDA)
WHFT-TV (Channel 45; MIAMI, FL; Owner: TRINITY BROADCASTING OF FLORIDA, INC.)
WAMI-TV (Channel 69; HOLLYWOOD, FL; Owner: TELEFUTURA MIAMI LLC)
W24CA (Channel 24; MARATHON, FL; Owner: KEY COMMUNICATIONS OF TEXAS)
WSCV (Channel 51; FORT LAUDERDALE, FL; Owner: TELEMUNDO OF FLORIDA LICENSE CORP.)
WLRN-TV (Channel 17; MIAMI, FL; Owner: THE SCHOOL BOARD OF MIAMI - DADE COUNTY, FL)
WPLG (Channel 10; MIAMI, FL; Owner: POST-NEWSWEEK STATIONS, FLORIDA, INC.)
WLTV (Channel 23; MIAMI, FL; Owner: WLTV LICENSE PARTNERSHIP, G.P.)
WPEC (Channel 12; WEST PALM BEACH, FL; Owner: FREEDOM BROADCASTING OF FLORIDA, INC)
WBFS-TV (Channel 33; MIAMI, FL; Owner: VIACOM STATIONS GROUP OF MIAMI INC.)
WPXM (Channel 35; MIAMI, FL; Owner: PAXSON COMMUNICATIONS LICENSE COMPANY, LLC)
WBZL (Channel 39; MIAMI, FL; Owner: CHANNEL 39, INC.)
WLMF-LP (Channel 53; MIAMI, FL; Owner: PAGING SYSTEMS, INC.)
WFGC (Channel 61; PALM BEACH, FL; Owner: CHRISTIAN TELEVISION OF PALM BEACH COUNTY, INC.)
WPXP (Channel 67; LAKE WORTH, FL; Owner: PAXSON WEST PALM BEACH LICENSE, INC.)
WTVJ (Channel 6; MIAMI, FL; Owner: NBC STATIONS MANAGEMENT, INC.)
WFUN-CA (Channel 48; MIAMI, ETC., FL; Owner: LOCALONE TEXAS, LTD.)
Home Mortgage Disclosure Act Aggregated Statistics For Year 2009(Based on 7 full and 4 partial tracts) A) FHA, FSA/RHS & VA B) Conventional C) Refinancings D) Home Improvement Loans E) Loans on Dwellings For 5+ Families F) Non-occupant Loans on G) Loans On Manufactured Number Average Value Number Average Value Number Average Value Number Average Value Number Average Value Number Average Value Number Average Value
LOANS ORIGINATED 306 $174,605 212 $124,380 299 $158,579 12 $68,034 1 $328,810 46 $86,994 8 $56,336 APPLICATIONS APPROVED, NOT ACCEPTED 21 $175,726 20 $107,567 43 $145,640 7 $52,433 0 $0 5 $68,030 8 $55,484 APPLICATIONS DENIED 83 $174,094 76 $93,027 257 $186,276 24 $42,523 0 $0 36 $78,423 15 $59,222 APPLICATIONS WITHDRAWN 32 $174,902 36 $112,916 103 $190,660 6 $52,573 0 $0 11 $61,056 1 $46,990 FILES CLOSED FOR INCOMPLETENESS 17 $176,937 8 $136,135 43 $199,850 2 $24,630 0 $0 2 $101,770 1 $78,720
Aggregated Statistics For Year 2008(Based on 7 full and 4 partial tracts) A) FHA, FSA/RHS & VA B) Conventional C) Refinancings D) Home Improvement Loans F) Non-occupant Loans on G) Loans On Manufactured Number Average Value Number Average Value Number Average Value Number Average Value Number Average Value Number Average Value
LOANS ORIGINATED 162 $210,704 385 $160,587 315 $170,363 20 $96,298 90 $128,502 23 $73,558 APPLICATIONS APPROVED, NOT ACCEPTED 14 $210,690 102 $183,875 99 $166,875 15 $62,271 26 $109,568 11 $70,536 APPLICATIONS DENIED 74 $212,539 182 $189,446 374 $217,212 42 $128,677 64 $169,490 17 $63,445 APPLICATIONS WITHDRAWN 29 $236,842 90 $169,898 98 $194,173 6 $101,952 18 $128,863 9 $79,491 FILES CLOSED FOR INCOMPLETENESS 9 $218,138 45 $207,012 44 $221,893 2 $69,430 8 $203,151 0 $0
Aggregated Statistics For Year 2007(Based on 7 full and 4 partial tracts) A) FHA, FSA/RHS & VA B) Conventional C) Refinancings D) Home Improvement Loans E) Loans on Dwellings For 5+ Families F) Non-occupant Loans on G) Loans On Manufactured Number Average Value Number Average Value Number Average Value Number Average Value Number Average Value Number Average Value Number Average Value
LOANS ORIGINATED 31 $260,977 963 $186,847 877 $208,996 90 $133,548 1 $16,408,050 172 $174,921 29 $75,390 APPLICATIONS APPROVED, NOT ACCEPTED 4 $177,105 179 $198,864 215 $195,748 32 $139,557 0 $0 28 $171,345 16 $79,681 APPLICATIONS DENIED 6 $294,207 553 $201,942 685 $236,677 76 $118,466 0 $0 150 $215,659 19 $81,050 APPLICATIONS WITHDRAWN 3 $146,983 162 $224,598 253 $222,199 30 $154,097 0 $0 47 $182,417 2 $86,685 FILES CLOSED FOR INCOMPLETENESS 0 $0 61 $257,702 83 $248,260 6 $145,487 0 $0 14 $210,511 1 $110,600
Aggregated Statistics For Year 2006(Based on 7 full and 4 partial tracts) A) FHA, FSA/RHS & VA B) Conventional C) Refinancings D) Home Improvement Loans E) Loans on Dwellings For 5+ Families F) Non-occupant Loans on G) Loans On Manufactured Number Average Value Number Average Value Number Average Value Number Average Value Number Average Value Number Average Value Number Average Value
LOANS ORIGINATED 16 $201,905 1,751 $178,080 1,347 $208,068 135 $131,477 1 $189,560 378 $170,311 24 $64,165 APPLICATIONS APPROVED, NOT ACCEPTED 0 $0 337 $162,812 261 $200,742 38 $99,406 0 $0 73 $179,998 54 $64,000 APPLICATIONS DENIED 1 $86,690 693 $174,245 579 $220,885 101 $116,045 0 $0 127 $175,931 40 $64,796 APPLICATIONS WITHDRAWN 2 $135,290 280 $181,006 411 $202,240 33 $111,301 0 $0 49 $165,594 0 $0 FILES CLOSED FOR INCOMPLETENESS 0 $0 65 $186,641 133 $219,553 6 $157,638 0 $0 16 $189,332 1 $26,700
Aggregated Statistics For Year 2005(Based on 7 full and 4 partial tracts) A) FHA, FSA/RHS & VA B) Conventional C) Refinancings D) Home Improvement Loans E) Loans on Dwellings For 5+ Families F) Non-occupant Loans on G) Loans On Manufactured Number Average Value Number Average Value Number Average Value Number Average Value Number Average Value Number Average Value Number Average Value
LOANS ORIGINATED 10 $185,568 1,790 $183,725 1,538 $188,711 169 $164,087 5 $21,348,986 506 $180,187 35 $59,875 APPLICATIONS APPROVED, NOT ACCEPTED 0 $0 213 $170,150 242 $177,526 25 $58,871 0 $0 37 $162,696 18 $66,874 APPLICATIONS DENIED 3 $99,130 548 $177,167 581 $190,127 114 $85,037 0 $0 161 $166,732 71 $50,894 APPLICATIONS WITHDRAWN 2 $234,460 236 $184,424 464 $180,177 55 $175,301 0 $0 56 $159,947 6 $52,055 FILES CLOSED FOR INCOMPLETENESS 0 $0 91 $168,863 274 $200,982 8 $57,030 0 $0 8 $117,360 7 $40,171
Aggregated Statistics For Year 2004(Based on 7 full and 4 partial tracts) A) FHA, FSA/RHS & VA B) Conventional C) Refinancings D) Home Improvement Loans E) Loans on Dwellings For 5+ Families F) Non-occupant Loans on G) Loans On Manufactured Number Average Value Number Average Value Number Average Value Number Average Value Number Average Value Number Average Value Number Average Value
LOANS ORIGINATED 28 $153,388 1,385 $155,813 1,382 $151,401 110 $86,464 3 $8,338,287 216 $119,434 29 $50,469 APPLICATIONS APPROVED, NOT ACCEPTED 1 $193,560 177 $143,118 231 $151,206 29 $59,065 0 $0 29 $108,876 11 $49,769 APPLICATIONS DENIED 6 $178,002 260 $137,794 583 $162,338 119 $64,313 1 $83,460 45 $105,655 40 $50,601 APPLICATIONS WITHDRAWN 2 $206,260 136 $153,776 348 $161,936 32 $82,749 0 $0 16 $140,736 2 $49,510 FILES CLOSED FOR INCOMPLETENESS 0 $0 43 $146,163 301 $170,916 19 $60,620 0 $0 7 $223,627 7 $46,179
Aggregated Statistics For Year 2003(Based on 7 full and 4 partial tracts) A) FHA, FSA/RHS & VA B) Conventional C) Refinancings D) Home Improvement Loans F) Non-occupant Loans on Number Average Value Number Average Value Number Average Value Number Average Value Number Average Value
LOANS ORIGINATED 70 $142,836 1,355 $141,571 2,933 $131,309 73 $38,009 224 $108,271 APPLICATIONS APPROVED, NOT ACCEPTED 4 $144,548 147 $141,036 430 $132,276 31 $38,514 25 $105,551 APPLICATIONS DENIED 10 $166,993 195 $137,830 892 $133,663 72 $35,537 27 $115,604 APPLICATIONS WITHDRAWN 10 $142,890 124 $142,808 470 $132,962 18 $34,871 20 $84,582 FILES CLOSED FOR INCOMPLETENESS 2 $136,070 37 $149,848 106 $144,385 10 $27,994 7 $107,806
Aggregated Statistics For Year 2002(Based on 1 full tract) A) FHA, FSA/RHS & VA B) Conventional C) Refinancings D) Home Improvement Loans F) Non-occupant Loans on Number Average Value Number Average Value Number Average Value Number Average Value Number Average Value
LOANS ORIGINATED 13 $89,319 62 $130,417 120 $118,420 7 $47,494 6 $88,427 APPLICATIONS APPROVED, NOT ACCEPTED 0 $0 6 $86,628 20 $111,800 0 $0 0 $0 APPLICATIONS DENIED 5 $99,640 10 $111,408 35 $116,647 8 $37,634 2 $102,975 APPLICATIONS WITHDRAWN 0 $0 6 $104,772 35 $130,965 1 $14,710 1 $59,820 FILES CLOSED FOR INCOMPLETENESS 0 $0 1 $51,980 8 $122,342 1 $19,610 0 $0
Aggregated Statistics For Year 2001(Based on 1 full tract) A) FHA, FSA/RHS & VA B) Conventional C) Refinancings D) Home Improvement Loans F) Non-occupant Loans on Number Average Value Number Average Value Number Average Value Number Average Value Number Average Value
LOANS ORIGINATED 14 $89,944 50 $99,698 85 $105,143 7 $15,551 6 $58,188 APPLICATIONS APPROVED, NOT ACCEPTED 2 $100,030 2 $131,415 16 $71,284 2 $7,355 0 $0 APPLICATIONS DENIED 0 $0 4 $67,422 42 $76,214 8 $20,595 4 $77,230 APPLICATIONS WITHDRAWN 1 $155,930 4 $99,050 33 $93,939 5 $24,714 0 $0 FILES CLOSED FOR INCOMPLETENESS 0 $0 3 $59,497 6 $93,330 0 $0 0 $0
Aggregated Statistics For Year 2000(Based on 1 full tract) A) FHA, FSA/RHS & VA B) Conventional C) Refinancings D) Home Improvement Loans F) Non-occupant Loans on Number Average Value Number Average Value Number Average Value Number Average Value Number Average Value
LOANS ORIGINATED 13 $92,714 35 $98,967 22 $85,588 7 $19,474 4 $55,165 APPLICATIONS APPROVED, NOT ACCEPTED 1 $121,610 1 $14,710 4 $35,550 3 $16,017 0 $0 APPLICATIONS DENIED 0 $0 11 $57,594 22 $63,523 8 $17,652 2 $35,795 APPLICATIONS WITHDRAWN 1 $72,570 5 $50,016 21 $54,872 0 $0 1 $53,940 FILES CLOSED FOR INCOMPLETENESS 0 $0 1 $199,080 13 $102,672 0 $0 0 $0
Aggregated Statistics For Year 1999(Based on 2 full and 3 partial tracts) A) FHA, FSA/RHS & VA B) Conventional C) Refinancings D) Home Improvement Loans E) Loans on Dwellings For 5+ Families F) Non-occupant Loans on Number Average Value Number Average Value Number Average Value Number Average Value Number Average Value Number Average Value
LOANS ORIGINATED 135 $94,782 1,200 $126,593 484 $101,985 70 $25,598 2 $6,934,585 102 $90,958 APPLICATIONS APPROVED, NOT ACCEPTED 6 $86,030 130 $139,534 132 $98,519 29 $24,699 0 $0 20 $83,712 APPLICATIONS DENIED 11 $85,361 224 $118,643 276 $93,447 74 $27,153 0 $0 17 $68,257 APPLICATIONS WITHDRAWN 12 $97,018 118 $138,384 217 $101,113 14 $66,604 0 $0 11 $69,690 FILES CLOSED FOR INCOMPLETENESS 2 $73,550 34 $135,950 58 $119,222 1 $45,860 0 $0 4 $44,490
Detailed mortgage data for all 11 tracts in Coconut Creek, FL
Private Mortgage Insurance Companies Aggregated Statistics For Year 2009(Based on 6 full and 4 partial tracts) A) Conventional B) Refinancings C) Non-occupant Loans on Number Average Value Number Average Value Number Average Value
LOANS ORIGINATED 13 $220,698 4 $239,295 0 $0 APPLICATIONS APPROVED, NOT ACCEPTED 14 $243,306 6 $193,918 1 $359,760 APPLICATIONS DENIED 3 $153,210 10 $266,886 1 $141,490 APPLICATIONS WITHDRAWN 5 $198,242 1 $210,930 1 $239,650 FILES CLOSED FOR INCOMPLETENESS 4 $210,672 1 $349,740 0 $0
Aggregated Statistics For Year 2008(Based on 7 full and 4 partial tracts) A) Conventional B) Refinancings C) Non-occupant Loans on Number Average Value Number Average Value Number Average Value
LOANS ORIGINATED 133 $206,162 26 $223,002 18 $179,732 APPLICATIONS APPROVED, NOT ACCEPTED 166 $240,184 41 $266,818 15 $215,191 APPLICATIONS DENIED 42 $201,070 2 $235,185 13 $211,181 APPLICATIONS WITHDRAWN 18 $222,362 2 $300,020 2 $266,985 FILES CLOSED FOR INCOMPLETENESS 10 $204,056 3 $221,053 5 $216,026
Aggregated Statistics For Year 2007(Based on 7 full and 4 partial tracts) A) Conventional B) Refinancings C) Non-occupant Loans on Number Average Value Number Average Value Number Average Value
LOANS ORIGINATED 283 $236,094 67 $263,430 27 $195,938 APPLICATIONS APPROVED, NOT ACCEPTED 64 $245,070 28 $275,270 7 $204,704 APPLICATIONS DENIED 9 $239,687 7 $232,221 2 $227,555 APPLICATIONS WITHDRAWN 20 $280,676 5 $193,894 4 $267,575 FILES CLOSED FOR INCOMPLETENESS 1 $261,060 0 $0 0 $0
Aggregated Statistics For Year 2006(Based on 7 full and 4 partial tracts) A) Conventional B) Refinancings C) Non-occupant Loans on D) Loans On Manufactured Number Average Value Number Average Value Number Average Value Number Average Value
LOANS ORIGINATED 240 $230,880 40 $284,248 34 $205,803 1 $127,540 APPLICATIONS APPROVED, NOT ACCEPTED 40 $235,018 9 $308,653 11 $195,165 0 $0 APPLICATIONS DENIED 8 $217,190 3 $438,343 3 $218,813 0 $0 APPLICATIONS WITHDRAWN 13 $246,516 4 $330,708 2 $204,885 0 $0 FILES CLOSED FOR INCOMPLETENESS 5 $217,288 1 $244,490 1 $248,220 0 $0
Aggregated Statistics For Year 2005(Based on 7 full and 4 partial tracts) A) Conventional B) Refinancings C) Non-occupant Loans on Number Average Value Number Average Value Number Average Value
LOANS ORIGINATED 267 $223,947 37 $214,611 65 $189,691 APPLICATIONS APPROVED, NOT ACCEPTED 39 $202,615 13 $233,573 8 $145,730 APPLICATIONS DENIED 10 $202,141 2 $421,770 9 $205,941 APPLICATIONS WITHDRAWN 12 $241,283 4 $166,215 4 $202,568 FILES CLOSED FOR INCOMPLETENESS 8 $198,496 0 $0 5 $191,502
Aggregated Statistics For Year 2004(Based on 7 full and 4 partial tracts) A) Conventional B) Refinancings C) Non-occupant Loans on D) Loans On Manufactured Number Average Value Number Average Value Number Average Value Number Average Value
LOANS ORIGINATED 234 $181,140 64 $172,690 25 $140,606 2 $236,950 APPLICATIONS APPROVED, NOT ACCEPTED 51 $158,089 31 $181,393 5 $179,686 0 $0 APPLICATIONS DENIED 4 $169,978 0 $0 1 $107,610 0 $0 APPLICATIONS WITHDRAWN 15 $191,083 10 $199,985 2 $142,620 0 $0 FILES CLOSED FOR INCOMPLETENESS 3 $205,560 2 $197,405 0 $0 0 $0
Aggregated Statistics For Year 2003(Based on 7 full and 4 partial tracts) A) Conventional B) Refinancings C) Non-occupant Loans on Number Average Value Number Average Value Number Average Value
LOANS ORIGINATED 421 $156,211 198 $159,823 32 $133,568 APPLICATIONS APPROVED, NOT ACCEPTED 59 $157,089 65 $168,887 6 $169,128 APPLICATIONS DENIED 7 $159,557 4 $187,282 3 $143,597 APPLICATIONS WITHDRAWN 34 $154,928 14 $203,954 5 $147,774 FILES CLOSED FOR INCOMPLETENESS 4 $167,268 2 $195,145 0 $0
Aggregated Statistics For Year 2002(Based on 1 full tract) A) Conventional B) Refinancings C) Non-occupant Loans on Number Average Value Number Average Value Number Average Value
LOANS ORIGINATED 22 $144,698 11 $134,445 1 $118,660 APPLICATIONS APPROVED, NOT ACCEPTED 4 $123,078 1 $84,340 1 $93,170 APPLICATIONS DENIED 1 $167,700 0 $0 0 $0 APPLICATIONS WITHDRAWN 0 $0 1 $156,910 0 $0 FILES CLOSED FOR INCOMPLETENESS 1 $158,870 0 $0 0 $0
Aggregated Statistics For Year 2001(Based on 1 full tract) A) Conventional B) Refinancings C) Non-occupant Loans on Number Average Value Number Average Value Number Average Value
LOANS ORIGINATED 17 $113,588 13 $128,245 2 $89,735 APPLICATIONS APPROVED, NOT ACCEPTED 3 $161,163 1 $132,390 0 $0 APPLICATIONS DENIED 0 $0 2 $129,945 0 $0 APPLICATIONS WITHDRAWN 1 $143,180 0 $0 0 $0 FILES CLOSED FOR INCOMPLETENESS 0 $0 0 $0 0 $0
Aggregated Statistics For Year 2000(Based on 1 full tract) A) Conventional B) Refinancings C) Non-occupant Loans on Number Average Value Number Average Value Number Average Value
LOANS ORIGINATED 12 $98,888 4 $117,440 1 $55,900 APPLICATIONS APPROVED, NOT ACCEPTED 2 $116,705 0 $0 0 $0 APPLICATIONS DENIED 1 $176,530 0 $0 0 $0 APPLICATIONS WITHDRAWN 0 $0 0 $0 0 $0 FILES CLOSED FOR INCOMPLETENESS 0 $0 0 $0 0 $0
Aggregated Statistics For Year 1999(Based on 2 full and 3 partial tracts) A) Conventional B) Refinancings C) Non-occupant Loans on Number Average Value Number Average Value Number Average Value
LOANS ORIGINATED 420 $134,765 70 $141,183 18 $108,691 APPLICATIONS APPROVED, NOT ACCEPTED 37 $146,587 14 $129,229 3 $121,337 APPLICATIONS DENIED 33 $135,135 3 $199,757 2 $175,360 APPLICATIONS WITHDRAWN 26 $143,177 6 $112,780 1 $45,900 FILES CLOSED FOR INCOMPLETENESS 3 $126,300 1 $49,440 0 $0
Coconut Creek compared to Florida state average:
Unemployed percentage significantly below state average. Foreign-born population percentage significantly above state average. Length of stay since moving in significantly above state average. Coconut Creek on our top lists :
#5 on the list of "Top 101 cities with largest percentage of females in industries: administrative and support and waste management services (population 50,000+)"
#15 on the list of "Top 101 cities with the highest average yearly precipitation (population 50,000+)"
#16 on the list of "Top 101 cities with largest percentage of females in occupations: legal occupations (population 50,000+)"
#22 on the list of "Top 101 cities with the highest average temperatures (population 50,000+)"
#29 on the list of "Top 100 cities with the largest percentage of females (pop. 50,000+)"
#30 on the list of "Top 101 cities with largest percentage of males in occupations: health technologists and technicians (population 50,000+)"
#37 on the list of "Top 101 cities that people commute from (largest negative percentage daily daytime population change due to commuting) (population 50,000+)"
#44 on the list of "Top 100 cities with smallest houses (pop. 50,000+)"
#46 on the list of "Top 101 cities with the smallest differences between daily high and daily low temperatures (population 50,000+)"
#46 on the list of "Top 101 cities with the smallest racial income disparities between White and Black householders (with at least 2,000 householders)"
#50 on the list of "Top 101 cities with the most residents born in Venezuela (population 500+)"
#52 on the list of "Top 101 cities with the most residents born in Brazil (population 500+)"
#61 on the list of "Top 101 cities with largest percentage of females in industries: other services, except public administration (population 50,000+)"
#62 on the list of "Top 101 cities with the smallest percentage of one, detached housing units in structures (20,000+ housing units)"
#66 on the list of "Top 101 cities with largest percentage population increases in the 1990s) (population 50,000+)"
#68 on the list of "Top 101 cities with the most residents born in South America (population 500+)"
#77 on the list of "Top 101 cities with largest percentage of males in occupations: sales and related occupations (population 50,000+)"
#77 on the list of "Top 101 cities with the smallest temperature differences during a year (population 50,000+)"
#95 on the list of "Top 101 cities with largest percentage of females in occupations: construction and extraction occupations (population 50,000+)"
#96 on the list of "Top 101 cities with largest percentage of males in occupations: installation, maintenance, and repair occupations (population 50,000+)"
#7 on the list of "Top 101 counties with the highest ground withdrawal of fresh water for public supply"
#15 on the list of "Top 101 counties with the most Evangelical Protestant congregations"
#18 on the list of "Top 101 counties with the most Evangelical Protestant adherents"
#20 on the list of "Top 101 counties with the lowest average weight of females"
#24 on the list of "Top 101 counties with the highest total withdrawal of fresh water for public supply (pop. 50,000+)"
Top Patent Applicants
Georgy Momchilov (17)
William V. Da Palma (17)
Vambi Raymundo Tolentino (16)
Wayne W. Ballantyne (15)
Eugenio Alvarez (9)
Enrique Travieso (8)
Charles Whiteman (7)
Yona Eckstein (6)
Adam Rubenstein (5)
Scott Alan Tribbey (4)
Total of 200 patent applications in 2008-2024.


 Recent articles from our blog. Our writers, many of them Ph.D. graduates or candidates, create easy-to-read articles on a wide variety of topics.


 (2.6 miles
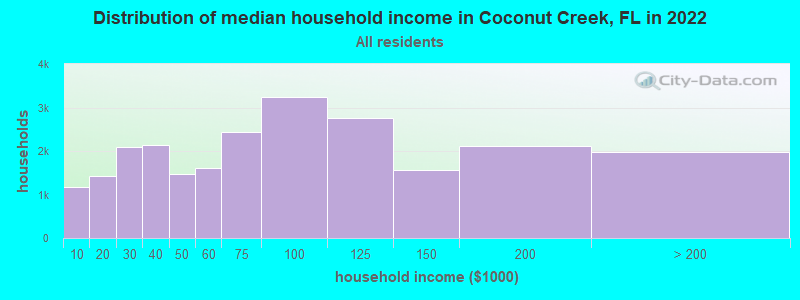
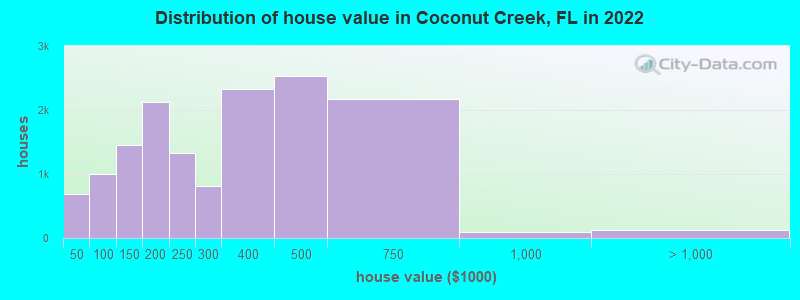
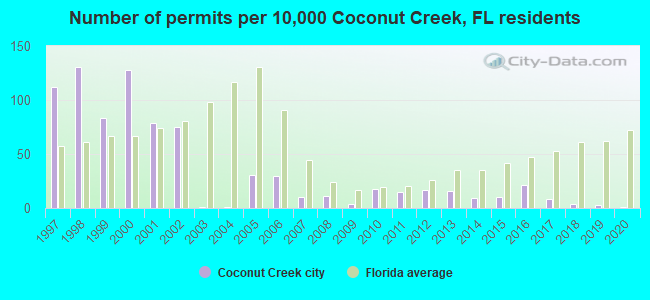

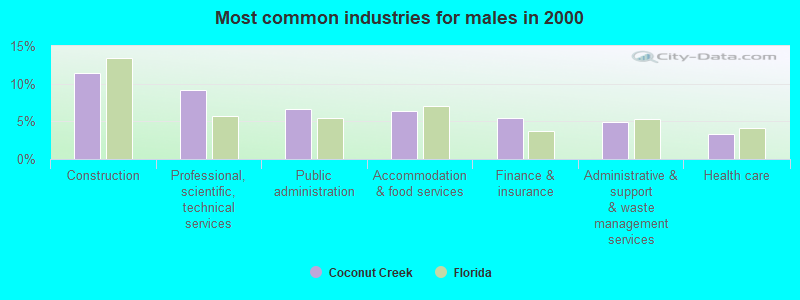
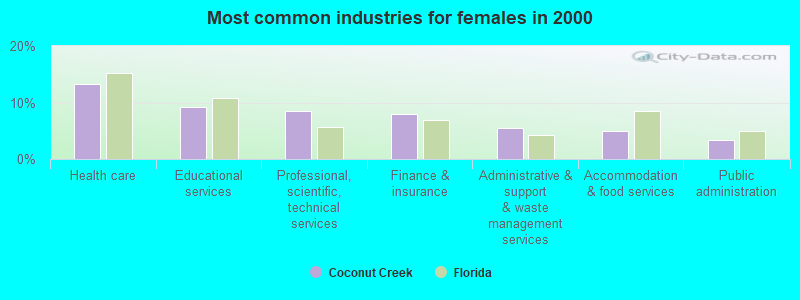
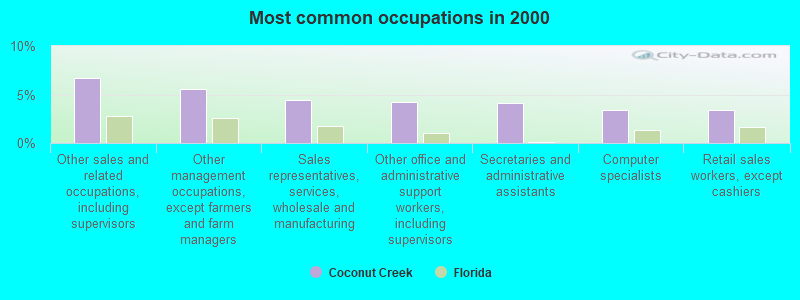
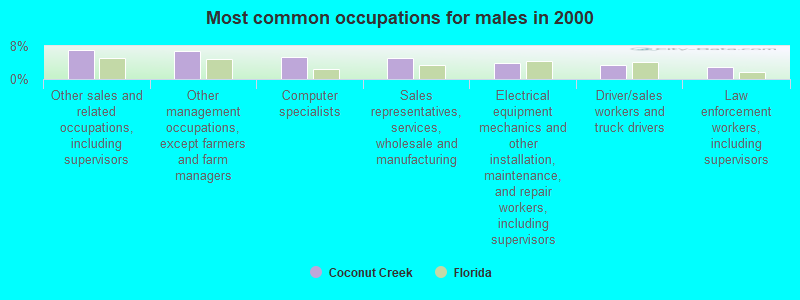
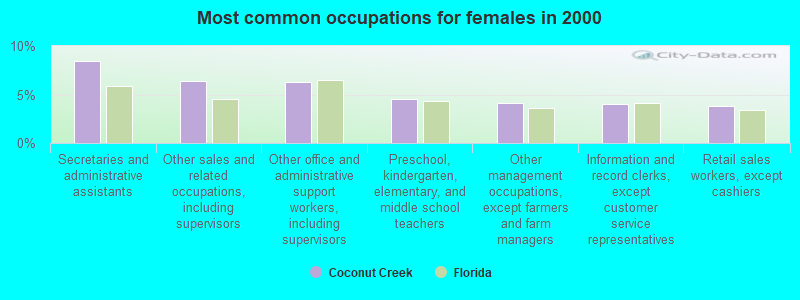
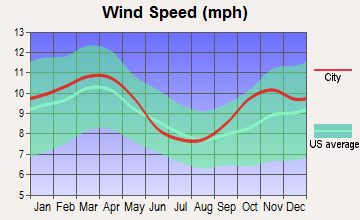
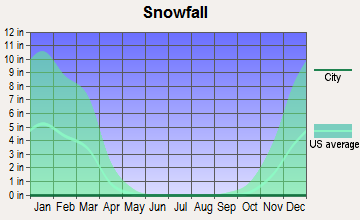
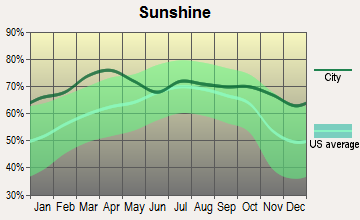
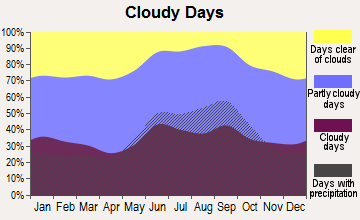
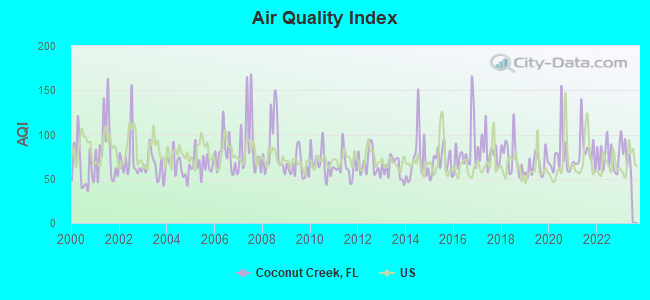
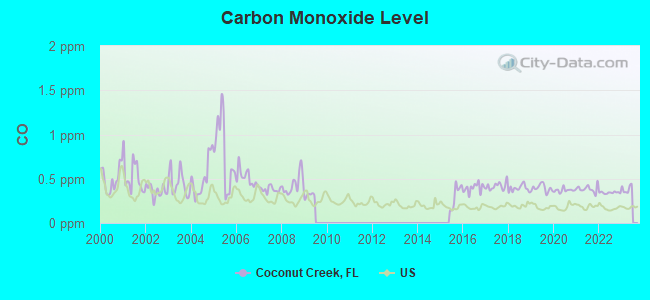
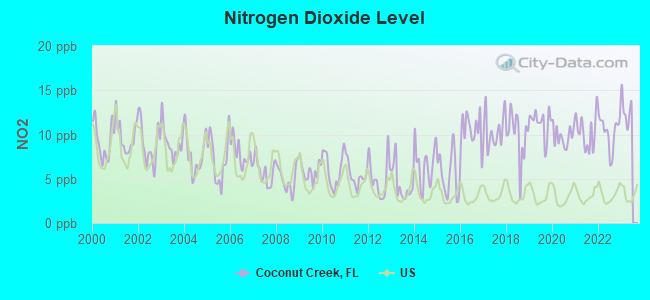
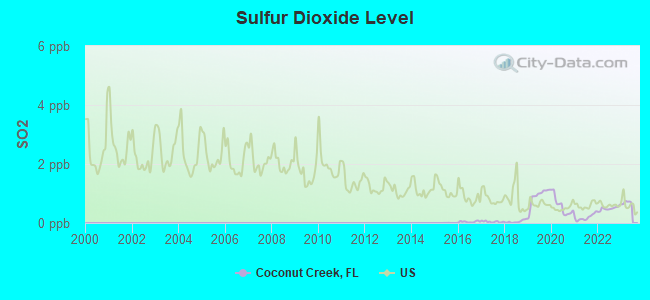
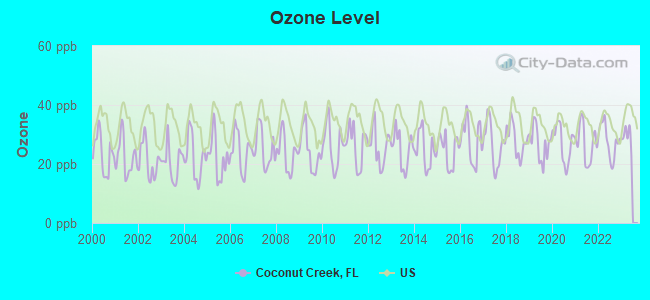
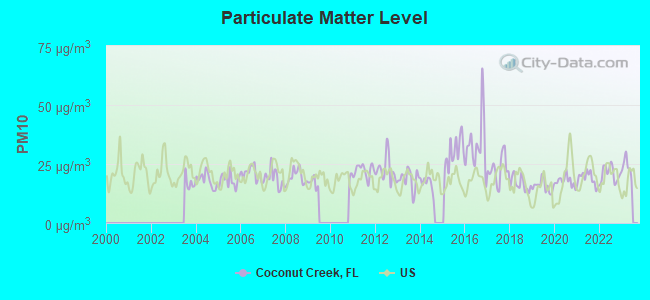
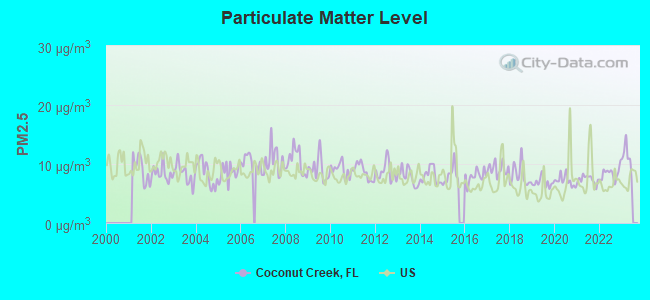
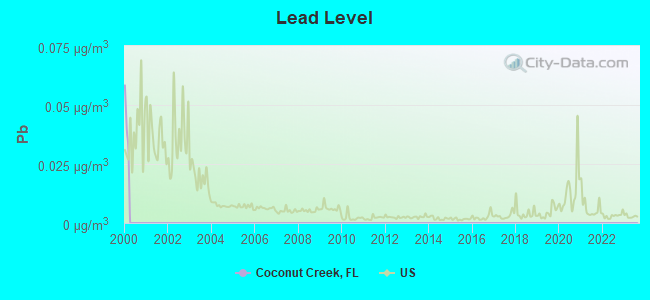
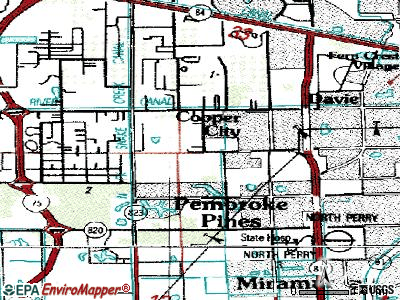
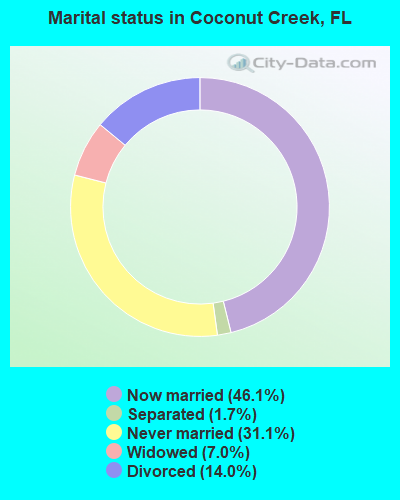
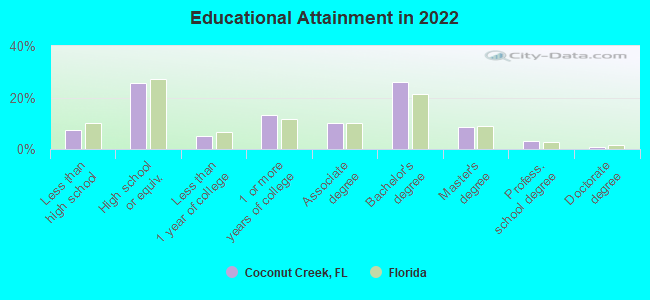
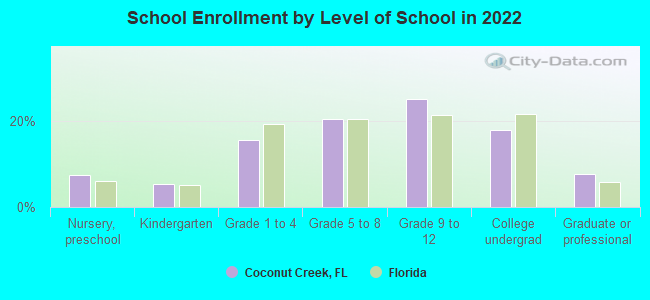
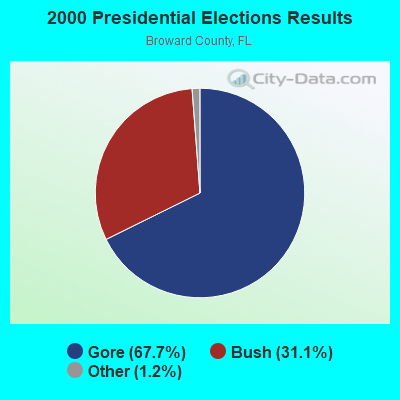
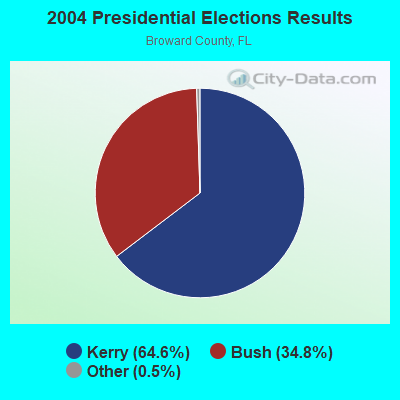
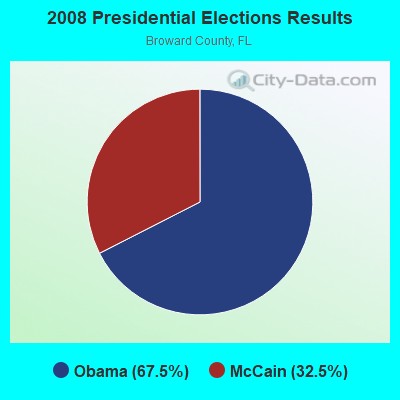
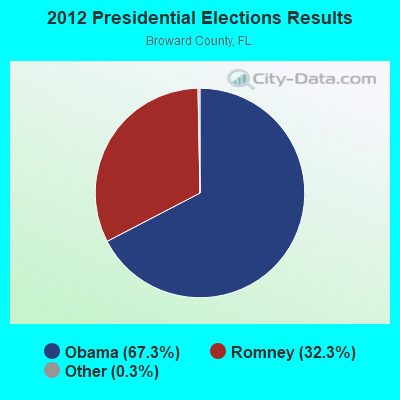
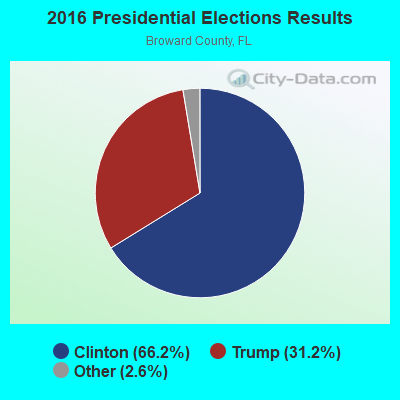
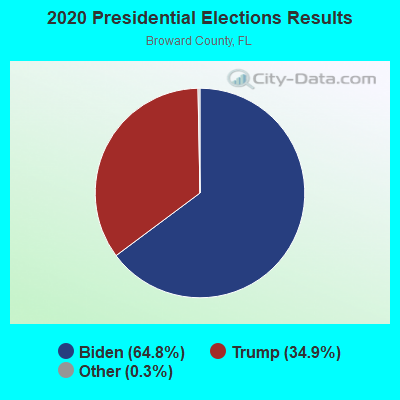
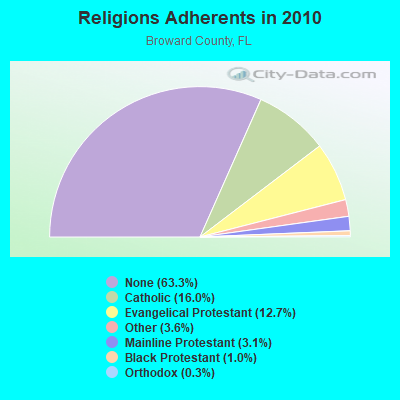
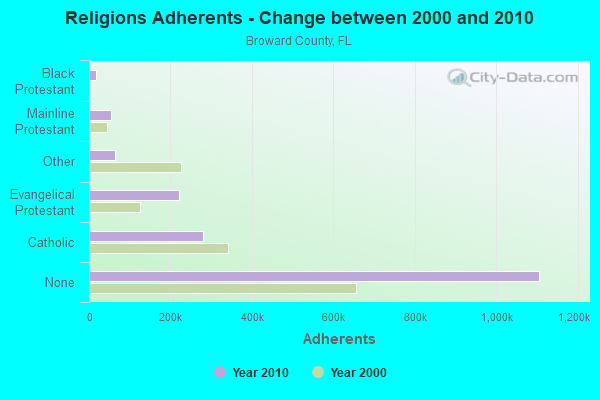
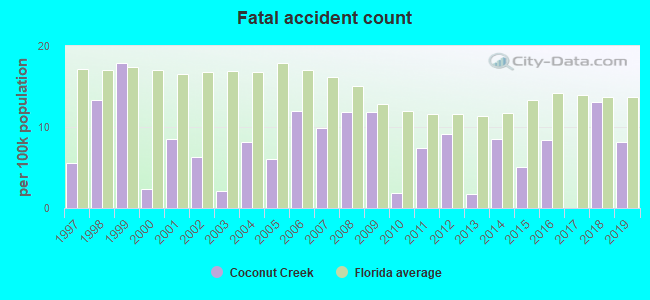
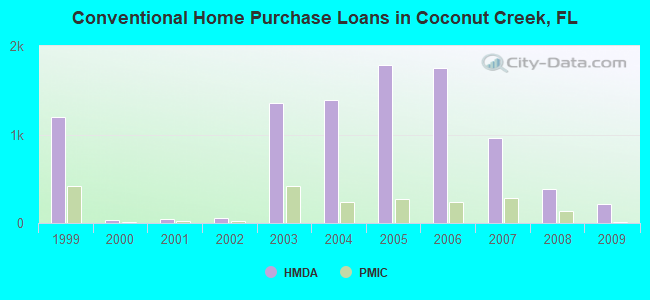
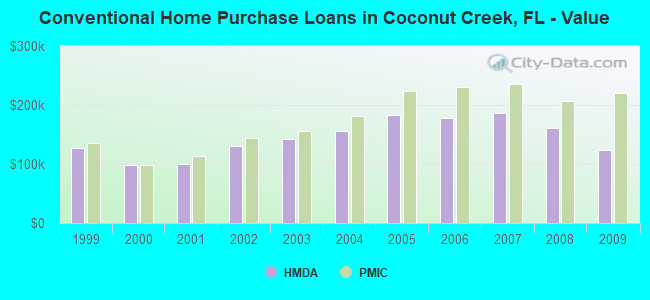
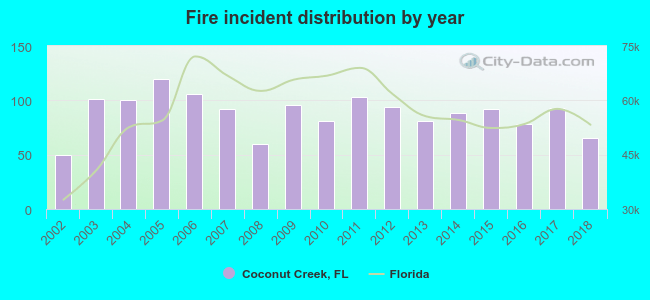 Based on the data from the years 2002 - 2018 the average number of fire incidents per year is 88. The highest number of reported fire incidents - 120 took place in 2005, and the least - 50 in 2002. The data has a rising trend.
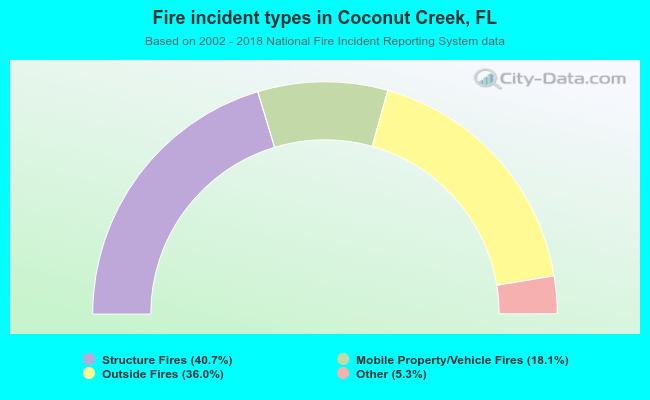 When looking into fire subcategories, the most reports belonged to: Structure Fires (40.7%), and Outside Fires (36.0%).