Crime rate in New York, New York (NY): murders, rapes, robberies, assaults, burglaries, thefts, auto thefts, arson, law enforcement employees, police officers, crime map
Crime rate in New York, NY
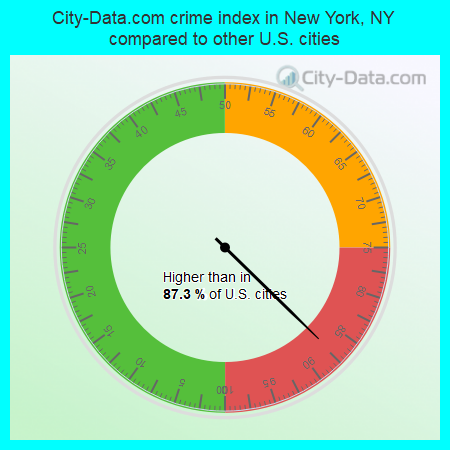
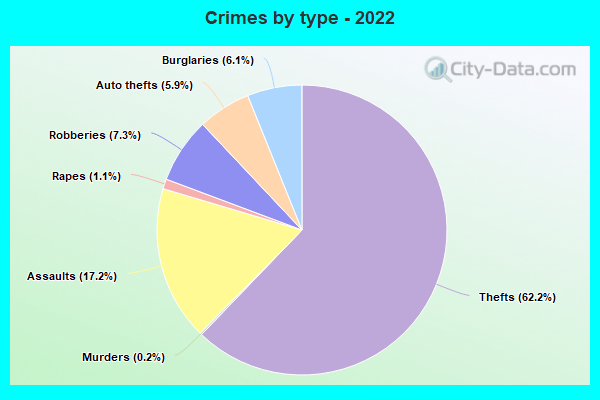
The 2022 crime rate in New York, NY is 296 (City-Data.com crime index), which is 1.2 times greater than the U.S. average. It was higher than in 87.3% U.S. cities. The 2022 New York crime rate rose by 29% compared to 2020. The number of homicides stood at 438 - a decrease of 30 compared to 2020. In the last 5 years New York has seen increasing violent crime and rise of property crime.(Note: Higher means more crime)
| New York: | 296.4 |
| Hoboken: | 111.4 |
| Union City: | 155.9 |
| West New York: | 125.7 |
| Guttenberg: | 132.6 |
| Jersey City: | 128.9 |
| Fairview: | 62.8 |
| Cliffside Park: | 31.3 |
| Edgewater: | 79.0 |
The City-Data.com crime index weighs serious crimes and violent crimes more heavily. Higher means more crime, U.S. average is 246.1. It adjusts for the number of visitors and daily workers commuting into cities.
- means the value is smaller than the state average.- means the value is about the same as the state average.
- means the value is bigger than the state average.
- means the value is much bigger than the state average.
According to our research of New York and other state lists, there were 4,554 registered sex offenders living in New York, New York as of April 27, 2024.
The ratio of all residents to sex offenders in New York is 1,875 to 1.
The ratio of registered sex offenders to all residents in this city is lower than the state average.
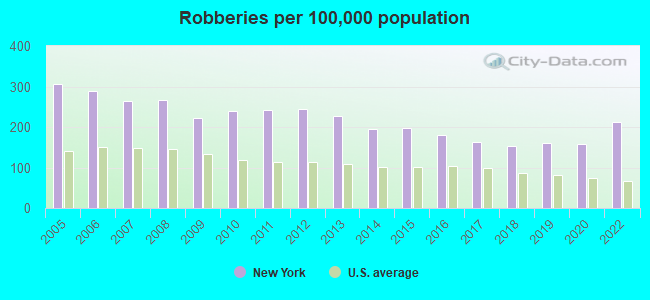
Violent crime rate in 2022
| New York: | 396.0 |
| U.S. Average: | 219.8 |
Violent crime rate in 2020
| New York: | 310.9 |
| U.S. Average: | 228.2 |
Violent crime rate in 2019
| New York: | 307.6 |
| U.S. Average: | 219.9 |
Violent crime rate in 2018
| New York: | 292.2 |
| U.S. Average: | 221.2 |
Violent crime rate in 2017
| New York: | 288.3 |
| U.S. Average: | 226.2 |
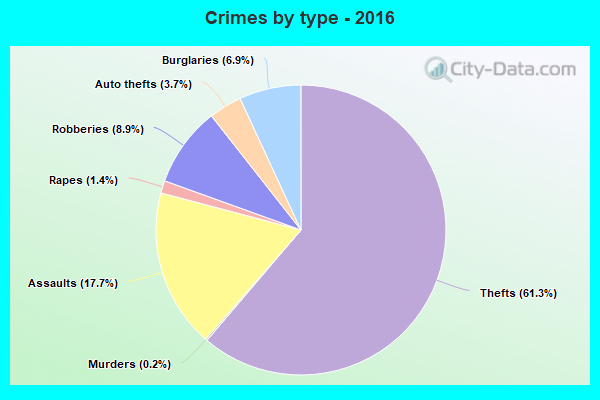
Violent crime rate in 2016
| New York: | 306.4 |
| U.S. Average: | 227.3 |
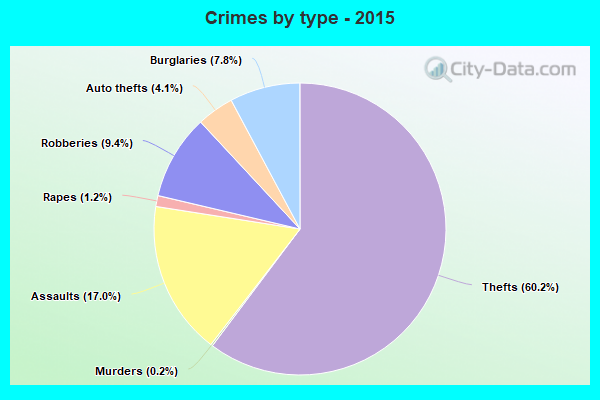
Violent crime rate in 2015
| New York: | 312.2 |
| U.S. Average: | 219.3 |
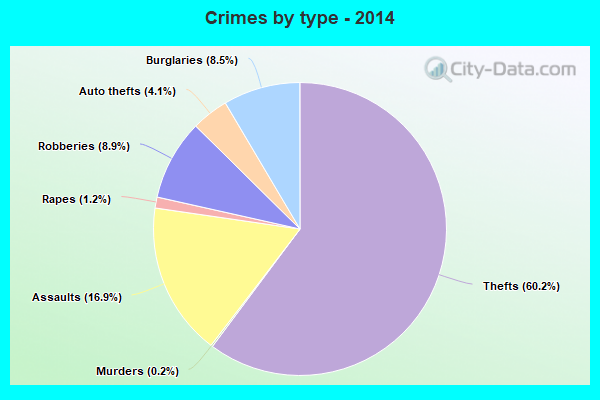
Violent crime rate in 2014
| New York: | 317.2 |
| U.S. Average: | 211.1 |
Violent crime rate in 2013
| New York: | 324.6 |
| U.S. Average: | 214.2 |
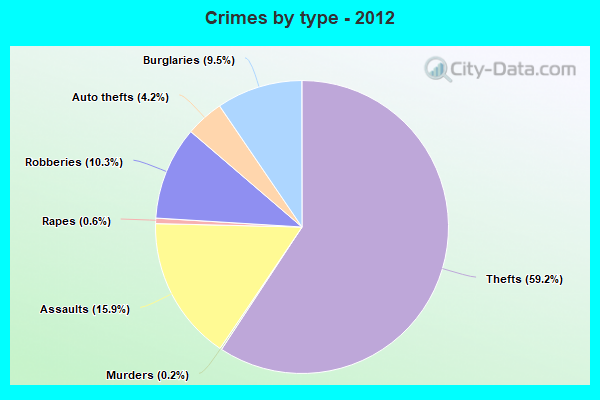
Violent crime rate in 2012
| New York: | 334.2 |
| U.S. Average: | 187.4 |
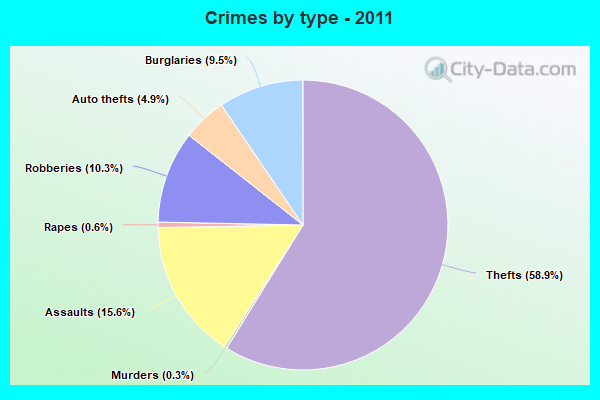
Violent crime rate in 2011
| New York: | 327.9 |
| U.S. Average: | 187.1 |
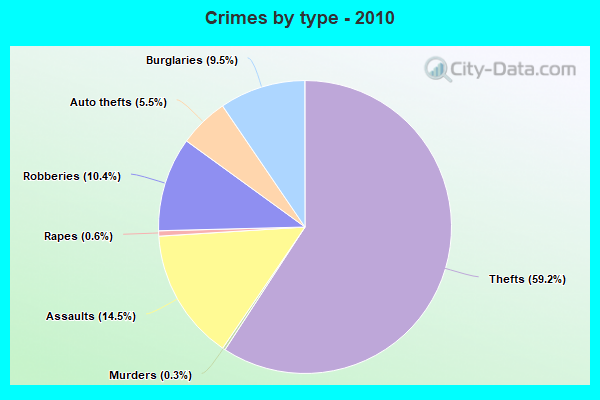
Violent crime rate in 2010
| New York: | 312.7 |
| U.S. Average: | 195.7 |
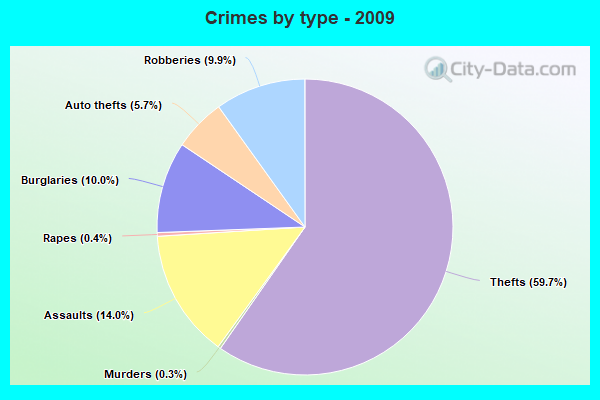
Violent crime rate in 2009
| New York: | 289.3 |
| U.S. Average: | 208.9 |
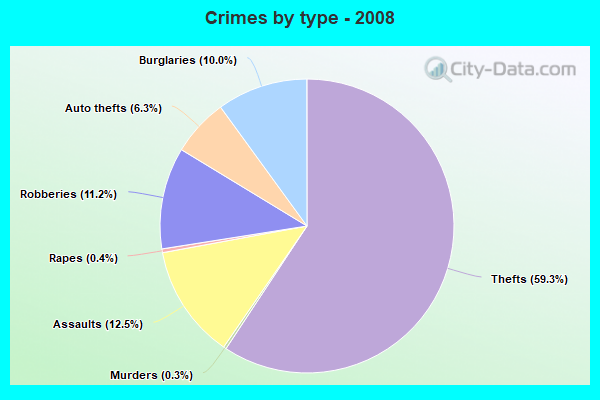
Violent crime rate in 2008
| New York: | 304.9 |
| U.S. Average: | 222.5 |
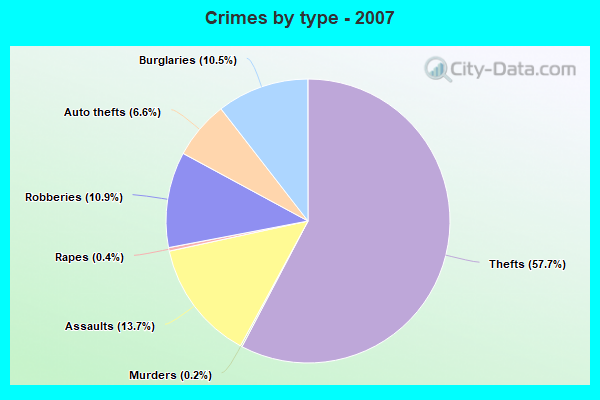
Violent crime rate in 2007
| New York: | 282.7 |
| U.S. Average: | 229.1 |
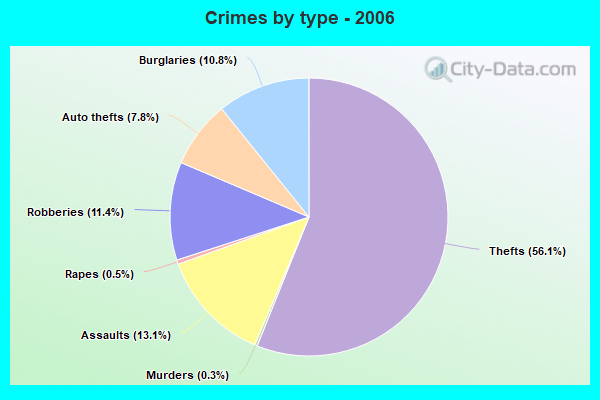
Violent crime rate in 2006
| New York: | 296.0 |
| U.S. Average: | 232.6 |
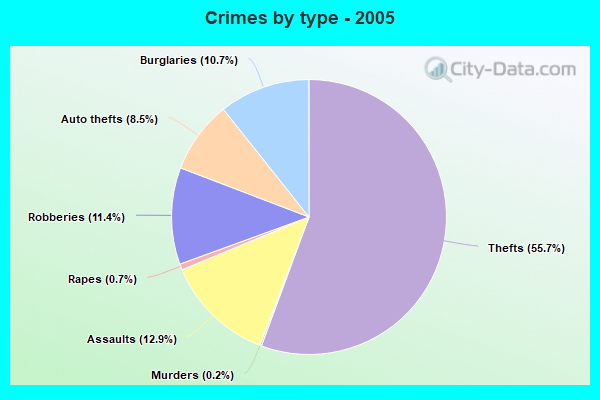
Violent crime rate in 2005
| New York: | 312.5 |
| U.S. Average: | 227.0 |
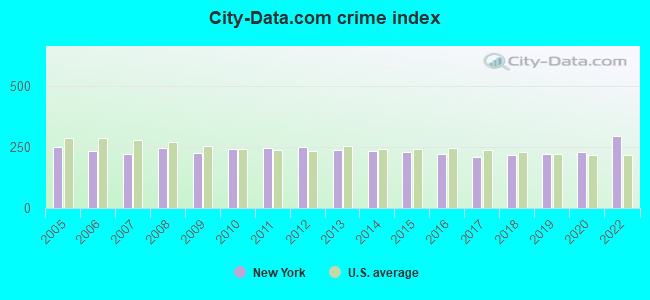
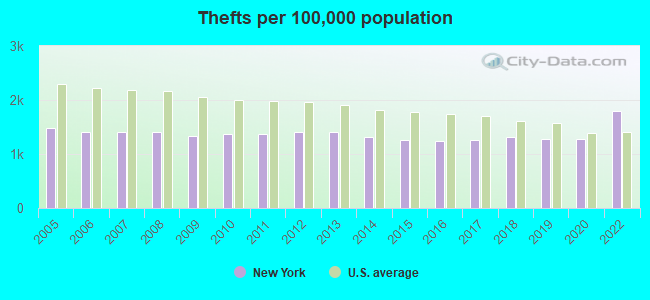
Property crime rate in 2022
| New York: | 150.5 |
| U.S. Average: | 166.5 |
Property crime rate in 2020
| New York: | 114.2 |
| U.S. Average: | 169.6 |
Property crime rate in 2019
| New York: | 97.2 |
| U.S. Average: | 179.7 |
Property crime rate in 2018
| New York: | 100.7 |
| U.S. Average: | 190.2 |
Property crime rate in 2017
| New York: | 98.4 |
| U.S. Average: | 206.4 |
Property crime rate in 2016
| New York: | 101.6 |
| U.S. Average: | 216.6 |
Property crime rate in 2015
| New York: | 109.3 |
| U.S. Average: | 221.5 |
Property crime rate in 2014
| New York: | 117.4 |
| U.S. Average: | 230.8 |
Property crime rate in 2013
| New York: | 123.1 |
| U.S. Average: | 250.4 |
Property crime rate in 2012
| New York: | 129.7 |
| U.S. Average: | 267.3 |
Property crime rate in 2011
| New York: | 130.2 |
| U.S. Average: | 273.5 |
Property crime rate in 2010
| New York: | 130.9 |
| U.S. Average: | 276.4 |
Property crime rate in 2009
| New York: | 130.8 |
| U.S. Average: | 285.6 |
Property crime rate in 2008
| New York: | 140.5 |
| U.S. Average: | 302.2 |
Property crime rate in 2007
| New York: | 127.8 |
| U.S. Average: | 309.2 |
Property crime rate in 2006
| New York: | 135.6 |
| U.S. Average: | 317.3 |
Property crime rate in 2005
| New York: | 145.8 |
| U.S. Average: | 322.3 |


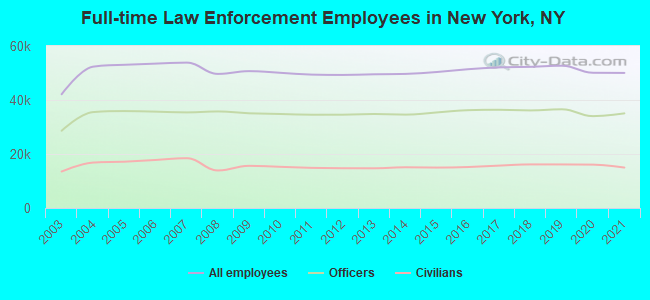
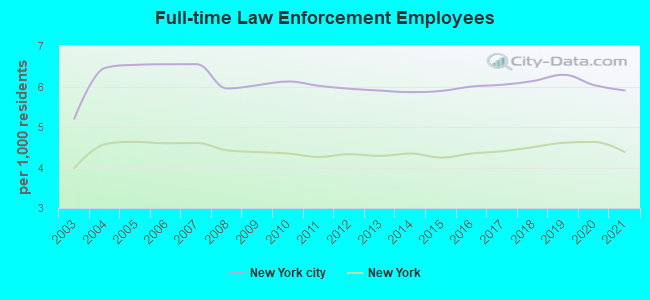
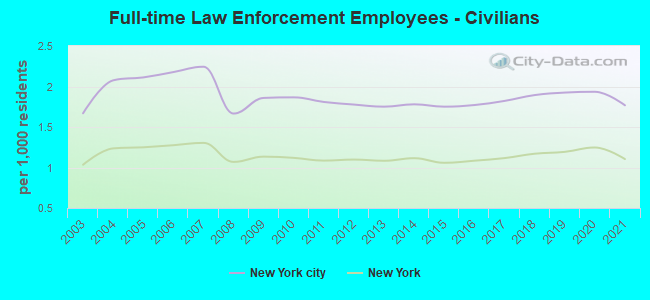
Full-time law enforcement employees in 2021, including police officers: 50,029 (35,047 officers - 28,283 male; 6,764 female).
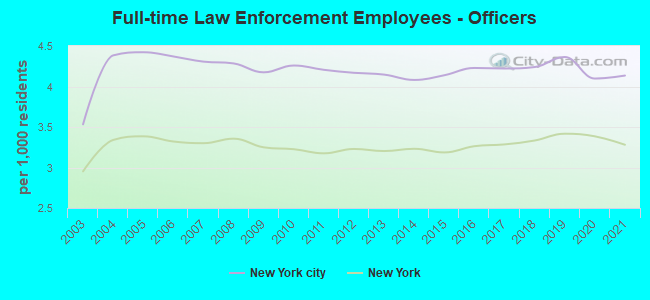
| Officers per 1,000 residents here: | 4.14 |
| New York average: | 3.28 |
Full-time law enforcement employees in 2020, including police officers: 50,083 (34,018 officers - 27,708 male; 6,310 female).
| Officers per 1,000 residents here: | 4.10 |
| New York average: | 3.38 |
Full-time law enforcement employees in 2019, including police officers: 52,696 (36,563 officers - 29,835 male; 6,728 female).
| Officers per 1,000 residents here: | 4.36 |
| New York average: | 3.42 |
Full-time law enforcement employees in 2018, including police officers: 52,278 (36,134 officers - 29,650 male; 6,484 female).
| Officers per 1,000 residents here: | 4.24 |
| New York average: | 3.33 |
Full-time law enforcement employees in 2017, including police officers: 52,079 (36,378 officers - 29,886 male; 6,492 female).
| Officers per 1,000 residents here: | 4.22 |
| New York average: | 3.28 |
Full-time law enforcement employees in 2016, including police officers: 51,399 (36,228 officers - 29,894 male; 6,334 female).
| Officers per 1,000 residents here: | 4.23 |
| New York average: | 3.26 |
Full-time law enforcement employees in 2015, including police officers: 50,366 (35,395 officers - 29,317 male; 6,078 female).
| Officers per 1,000 residents here: | 4.14 |
| New York average: | 3.19 |
Full-time law enforcement employees in 2014, including police officers: 49,665 (34,581 officers - 28,713 male; 5,868 female).
| Officers per 1,000 residents here: | 4.08 |
| New York average: | 3.23 |
Full-time law enforcement employees in 2013, including police officers: 49,526 (34,822 officers - 28,932 male; 5,890 female).
| Officers per 1,000 residents here: | 4.15 |
| New York average: | 3.20 |
Full-time law enforcement employees in 2012, including police officers: 49,283 (34,555 officers - 28,709 male; 5,846 female).
| Officers per 1,000 residents here: | 4.17 |
| New York average: | 3.23 |
Full-time law enforcement employees in 2011, including police officers: 49,401 (34,542 officers - 28,653 male; 5,889 female).
| Officers per 1,000 residents here: | 4.21 |
| New York average: | 3.18 |
Full-time law enforcement employees in 2010, including police officers: 50,068 (34,817 officers - 28,784 male; 6,033 female).
| Officers per 1,000 residents here: | 4.26 |
| New York average: | 3.23 |
Full-time law enforcement employees in 2009, including police officers: 50,688 (35,071 officers - 28,952 male; 6,119 female).
| Officers per 1,000 residents here: | 4.17 |
| New York average: | 3.25 |
Full-time law enforcement employees in 2008, including police officers: 49,664 (35,761 officers - 29,512 male; 6,249 female).
| Officers per 1,000 residents here: | 4.29 |
| New York average: | 3.36 |
Full-time law enforcement employees in 2007, including police officers: 53,848 (35,404 officers - 29,228 male; 6,176 female).
| Officers per 1,000 residents here: | 4.31 |
| New York average: | 3.30 |
Full-time law enforcement employees in 2006, including police officers: 53,473 (35,690 officers - 29,469 male; 6,221 female).
| Officers per 1,000 residents here: | 4.37 |
| New York average: | 3.32 |
Full-time law enforcement employees in 2005, including police officers: 53,035 (35,896 officers - 29,749 male; 6,147 female).
| Officers per 1,000 residents here: | 4.42 |
| New York average: | 3.39 |
Full-time law enforcement employees in 2004, including police officers: 52,335 (35,513 officers - 29,543 male; 5,970 female).
| Officers per 1,000 residents here: | 4.38 |
| New York average: | 3.34 |
Full-time law enforcement employees in 2003, including police officers: 42,128 (28,614 officers - 24,344 male; 4,270 female).
| Officers per 1,000 residents here: | 3.53 |
| New York average: | 2.95 |


Zip codes: 10001, 10002, 10003, 10004, 10005, 10006, 10007, 10009, 10010, 10011, 10012, 10013, 10014, 10016, 10017, 10018, 10019, 10020, 10021, 10022, 10023, 10024, 10025, 10026, 10027, 10028, 10029, 10030, 10031, 10032, 10033, 10034, 10035, 10036, 10037, 10038, 10039, 10040, 10044, 10065, 10069, 10075, 10103, 10110, 10111, 10112, 10115, 10119, 10128, 10152, 10153, 10154, 10162, 10165, 10167, 10168, 10169, 10170, 10171, 10172, 10173, 10174, 10177, 10199, 10271, 10278, 10279, 10280, 10282, 10301, 10302, 10303, 10304, 10305, 10306, 10307, 10308, 10309, 10310, 10311, 10312, 10314, 10451, 10452, 10453, 10454, 10455, 10456, 10457, 10458, 10459, 10460, 10461, 10462, 10463, 10464, 10465, 10466, 10467, 10468, 10469, 10470, 10471, 10472, 10473, 10474, 10475, 11004, 11005, 11101, 11102, 11103, 11104, 11105, 11106, 11109, 11201, 11203, 11204, 11205, 11206, 11207, 11208, 11209, 11210, 11211, 11212, 11213, 11214, 11215, 11216, 11217, 11218, 11219, 11220, 11221, 11222, 11223, 11224, 11225, 11226, 11228, 11229, 11230, 11231, 11232, 11233, 11234, 11235, 11236, 11237, 11238, 11239, 11351, 11354, 11355, 11356, 11357, 11358, 11359, 11360, 11361, 11362, 11363, 11364, 11365, 11366, 11367, 11368, 11369, 11370, 11371, 11372, 11373, 11374, 11375, 11377, 11378, 11379, 11385, 11411, 11412, 11413, 11414, 11415, 11416, 11417, 11418, 11419, 11420, 11421, 11422, 11423, 11424, 11425, 11426, 11427, 11428, 11429, 11430, 11432, 11433, 11434, 11435, 11436, 11451, 11691, 11692, 11693, 11694, 11697.